

Bjs Crime Against Persons With Disabilities 2009 Thru 2011 Dec 2012
Download original document:
Document text
Document text
This text is machine-read, and may contain errors. Check the original document to verify accuracy.
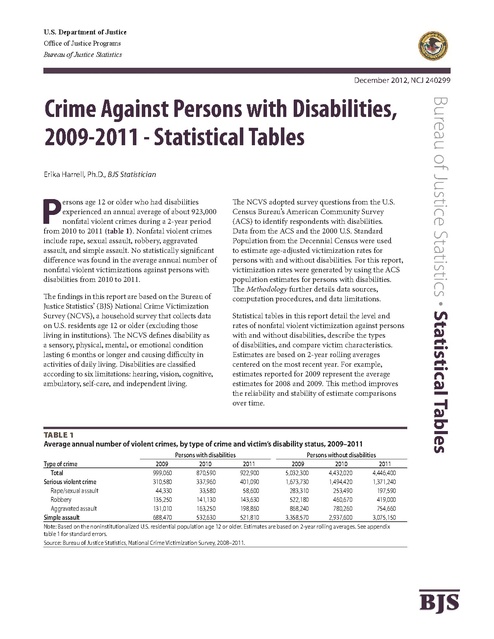
U.S. Department of Justice 41\ ~ Office of Justice Programs Bureau of Justice Statistics December 2012, NCJ 240299 Erika Harrell, Ph.D., BJS Statistician P ersons age 12 or older who had disabilities experienced an annual average of about 923,000 nonfatal violent crimes during a 2-year period from 2010 to 2011 (table 1). Nonfatal violent crimes include rape, sexual assault, robbery, aggravated assault, and simple assault. No statistically significant difference was found in the average annual number of nonfatal violent victimizations against persons with disabilities from 2010 to 2011. The findings in this report are based on the Bureau of Justice Statistics’ (BJS) National Crime Victimization Survey (NCVS), a household survey that collects data on U.S. residents age 12 or older (excluding those living in institutions). The NCVS defines disability as a sensory, physical, mental, or emotional condition lasting 6 months or longer and causing difficulty in activities of daily living. Disabilities are classified according to six limitations: hearing, vision, cognitive, ambulatory, self-care, and independent living. The NCVS adopted survey questions from the U.S. Census Bureau’s American Community Survey (ACS) to identify respondents with disabilities. Data from the ACS and the 2000 U.S. Standard Population from the Decennial Census were used to estimate age-adjusted victimization rates for persons with and without disabilities. For this report, victimization rates were generated by using the ACS population estimates for persons with disabilities. The Methodology further details data sources, computation procedures, and data limitations. Statistical tables in this report detail the level and rates of nonfatal violent victimization against persons with and without disabilities, describe the types of disabilities, and compare victim characteristics. Estimates are based on 2-year rolling averages centered on the most recent year. For example, estimates reported for 2009 represent the average estimates for 2008 and 2009. This method improves the reliability and stability of estimate comparisons over time. Table 1 Average annual number of violent crimes, by type of crime and victim’s disability status, 2009–2011 Type of crime Total Serious violent crime Rape/sexual assault Robbery Aggravated assault Simple assault 2009 999,060 310,580 44,330 135,250 131,010 688,470 Persons with disabilities 2010 870,590 337,960 33,580 141,130 163,250 532,630 2011 922,900 401,090 58,600 143,630 198,860 521,810 Persons without disabilities 2009 2010 2011 5,032,300 4,432,020 4,446,400 1,673,730 1,494,420 1,371,240 283,310 253,490 197,590 522,180 460,670 419,000 868,240 780,260 754,660 3,358,570 2,937,600 3,075,150 Bureau of Justice Statistics · Statistical Tables Crime Against Persons with Disabilities, 2009-2011 - Statistical Tables Note: Based on the noninstitutionalized U.S. residential population age 12 or older. Estimates are based on 2-year rolling averages. See appendix table 1 for standard errors. Source: Bureau of Justice Statistics, National Crime Victimization Survey, 2008–2011. BJS HJS List of tables Table 1. Average annual number of violent crimes, by type of crime and victim’s disability status, 2009–2011. . . 1 Table 2. Unadjusted violent victimization rates, by victim’s disability status and age, 2009–2011. . . . . . . . . . . . 3 Table 3. Age-adjusted and unadjusted rates of violent victimization for persons with disabilities, by type of crime, 2009–2011 . . . . . . . . . . . . . . . . . . . . . . . . . . . . . . . . . . . . . 4 Table 6. Percent of violence against persons with disabilities that involved victims with multiple disability types, by type of crime, 2009–2011 . . . . . . . . . . . . . . . . . . . . . 6 Table 7. Age-adjusted rate of violent victimization, by type of crime and number of disability types, 2009–2011.6 Table 8. Unadjusted rate of violent victimization against persons with disabilities, by disability type, 2009–2011. . 7 Table 4. Age-adjusted and unadjusted rates of violent victimization for persons without disabilities, by type of crime, 2009–2011 . . . . . . . . . . . . . . . . . . . . . . . . . . . . . . . . . . . . . 4 Table 9. Unadjusted rate of serious violent victimization against persons with disabilities, by disability type, 2009–2011. . . . . . . . . . . . . . . . . . . . . . . . . . . . . . . . . . . . . . . . . . . . 7 Table 5. Age-adjusted rates of violent victimization, by victim’s disability status, sex, race, and Hispanic origin, 2009–2011. . . . . . . . . . . . . . . . . . . . . . . . . . . . . . . . . . . . . . . . . . . . 5 Table 10. Unadjusted rate of simple assault of persons with disabilities, by disability type, 2009–2011. . . . . . . . . . 7 Table 11. Unadjusted violent victimization rate, by victim’s sex and disability type, 2009–2011. . . . . . . . . . . . . . 8 List of appendix tables Appendix table 1. Standard errors for average annual number of violent crimes, by type of crime and victim’s disability status, 2009–2011. . . . . . . . . . . . . . . . . . . . . . . . . . . 15 Appendix table 10. Standard errors for unadjusted rate of simple assault of persons with disabilities, by disability type, 2009–2011 . . . . . . . . . . . . . . . . . . . . . . . . . . . . . . . . . . . . . 17 Appendix table 2. Standard errors for unadjusted violent victimization rates, by victim’s disability status and age, 2009–2011 . . . . . . . . . . . . . . . . . . . . . . . . . . . . . . . . . . . . . . 15 Appendix table 11. Standard errors for unadjusted violent victimization rate, by victim’s sex and disability type, 2009–2011 . . . . . . . . . . . . . . . . . . . . . . . . . . . . . . . . . . . . . 17 Appendix table 3. Standard errors for age-adjusted and unadjusted rates of violent victimization for persons with disabilities, by type of crime , 2009-2011. . . . . . . . . . . . . . . 15 Appendix table 12. Numbers and percentages of U.S. population, by the victim’s disability status and demographic characteristics, 2008–2011 . . . . . . . . . . . . . . 18 Appendix table 4. Standard errors for age-adjusted and unadjusted rates of violent victimization for persons without disabilities, by type of crime , 2009–2011 . . . . . . 15 Appendix table 13. U.S. residential population calculated and according to the Census Bureau’s actual ACS estimates, by victim’s disability status and demographic characteristics, 2010 . . . . . . . . . . . . . . . . . . . . 19 Appendix table 5. Standard errors for age-adjusted rates of violent victimization, by victim’s disability status, sex, race, and Hispanic origin, 2009–2011. . . . . . . . . . . . . . 16 Appendix table 6. Standard errors for percent of violence against persons with disabilities that involved victims with multiple disability types, by type of crime, 2009–2011. . . . . . . . . . . . . . . . . . . . . . . . . . . . . . . . . . . . . . . . . . . 16 Appendix table 14. Unadjusted rate of violent victimization, by victim’s disability status and demographic characteristics, 2009–2011. . . . . . . . . . . . . . . 20 Appendix table 15. Standard errors for unadjusted rate of violent victimization, by victim’s disability status and demographic characteristics, 2009–2011. . . . . . . . . . . . . . . 20 Appendix table 7. Standard errors for age-adjusted rate of violent victimization, by type of crime and number of disability types, 2009–2011. . . . . . . . . . . . . . . . . . . . . . . . . . . 16 Appendix table 16. Unadjusted rates of violent victimization, by type of crime and victim’s number of disability types, 2009–2011 . . . . . . . . . . . . . . . . . . . . . . . . . . . 21 Appendix table 8. Standard errors for unadjusted rate of violent victimization of persons with disabilities, by disability type, 2009–2011. . . . . . . . . . . . . . . . . . . . . . . . . . . . 16 Appendix table 17. Standard errors for unadjusted rates of violent victimization, by type of crime and victim’s number of disability types, 2009–2011. . . . . . . . . . . . . . . . . . . . . . . . . . . . . . . . . . . . . . . . . . . 21 Appendix table 9. Standard errors for unadjusted rate of serious violent victimization of persons with disabilities, by disability type, 2009–2011. . . . . . . . . . . . . . 16 Crime Against Persons with Disabilities, 2009 - 2011 – Statistical Tables | December 2012 2 • Violent crime by victim’s age and disability status Among persons ages 12 to 15, the average annual unadjusted rate of violent victimization was higher for persons with disabilities (76 per 1,000) than for persons without disabilities (30 per 1,000) in 2011 (table 2). Among persons ages 16 to 19, persons with disabilities had an average annual unadjusted rate of violent victimization (123 per 1,000) that was at least three times greater than that of persons without disabilities (37 per 1,000) in 2011. From 2009 to 2011, the average annual unadjusted rate of violent victimization among persons ages 16 to 19 with disabilities increased from 77 per 1,000 to 123 per 1,000. The average annual unadjusted rate of violent victimization among persons with disabilities ages 20 to 24 slightly increased from 74 per 1,000 in 2010 to 110 per 1,000 in 2011. The use of age-adjusted rates Direct comparisons of the violent victimization rate between persons with and without disabilities without taking into account the differences in age distributions between the two populations can be misleading. The age distribution of persons with disabilities differs considerably from that of persons without disabilities, and violent crime victimization rates vary significantly with age. To compare rates of violent victimization by disability status, an age adjustment method was used to handle the differences in age distributions of persons with disabilities and without disabilities. According to the ACS, persons with disabilities are generally older than persons without disabilities. For example, about 41% of persons with disabilities were age 65 or older in 2010, compared to 11% of persons without disabilities. The age adjustment standardizes the rate of violence for persons with disabilities to show what the rate against them would be if they had the same age distribution as the 2000 U.S. Standard Population as calculated by the U.S. Census Bureau. The average annual unadjusted rate of violent victimization against persons with disabilities age 65 or older slightly increased from 2010 (3 per 1,000) to 2011 (5 per 1,000). Table 2 Unadjusted violent victimization rates, by victim’s disability status and age, 2009–2011 Age of victim Total 12–15 years old 16–19 20–24 25–34 35–49 50–64 65 or older Rate per 1,000 persons with disabilities 2009 2010 2011 28.9 25.1 26.4 106.6 69.9 75.9 77.1 101.3 123.2 103.8 73.8 110.0 49.9 39.5 55.3 55.8 48.8 41.2 25.5 24.1 20.5 2.8 2.5 4.6 Rate per 1,000 persons without disabilities 2009 2010 2011 23.3 20.2 20.1 47.8 34.7 29.6 37.2 30.9 36.6 39.4 32.8 32.5 30.3 29.3 27.9 19.9 17.2 17.9 11.5 11.3 11.3 4.0 3.8 3.2 Note: Based on the noninstitutionalized U.S. residential population age 12 or older. Estimates are based on 2-year rolling averages. The 2011 rates were calculated using 2010 populations from the American Community Survey, and 2011 populations were calculated using 2010 proportions. See Methodology. See appendix table 2 for standard errors. Sources: Bureau of Justice Statistics, National Crime Victimization Survey, 2008–2011, and U.S. Census Bureau, American Community Survey, 2008–2010. Crime Against Persons with Disabilities, 2009 - 2011 – Statistical Tables | December 2012 3 • Violent crime by type of crime The average annual age-adjusted rate of violent victimization for persons with disabilities (48 per 1,000 persons with disabilities) was more than twice the rate among persons without disabilities (19 per 1,000 persons without disabilities) in 2011 (table 3 and table 4). In 2011, the average annual age-adjusted rate of serious violent victimization for persons with disabilities (22 per 1,000) was more than three times higher than that for persons without disabilities (6 per 1,000). During 2011, serious violence (rape/sexual assault, robbery, and aggravated assault) accounted for about 43% of nonfatal violent crime against persons with disabilities, which was higher than the percentage found for persons without disabilities (31%) (not shown in table). No statistically significant difference was found in the average annual rates of violent victimization against persons with disabilities from 2009 to 2011. Among persons without disabilities, the rate of violent victimization declined from 2009 (22 per 1,000) to 2010 (20 per 1,000). No statistically significant difference was found in the average annual age-adjusted rates of violent victimization for persons without disabilities in the 2010 (20 per 1,000) and 2011 (19 per 1,000). For both persons with and without disabilities, the average annual age-adjusted rate of simple assault declined from 2009 to 2010 and remained stable in 2011. Among persons with and without disabilities, aggravated assault remained stable from 2009 to 2011. In 2011, the age-adjusted average annual rate of simple assault against persons with disabilities (26 per 1,000) was twice that for persons without disabilities (13 per 1,000). Table 3 Age-adjusted and unadjusted rates of violent victimization for persons with disabilities, by type of crime, 2009–2011 Type of crime Total Serious violent crime Rape/sexual assault Robbery Aggravated assault Simple assault Rates per 1,000 persons with disabilities Age-adjusted Unadjusted 2009 2010 2011 2009 2010 2011 50.1 42.9 47.8 28.9 25.1 26.4 15.6 17.9 21.7 9.0 9.7 11.5 1.7 1.7 2.7 1.3 1.0 1.7 7.2 7.6 8.3 3.9 4.1 4.1 6.6 8.6 10.6 3.8 4.7 5.7 34.5 25.0 26.1 19.9 15.4 14.9 Note: Based on the noninstitutionalized U.S. residential population age 12 or older. Estimates are age-based on 2-year rolling averages. Age-adjusted rates were created using direct standardization with the 2000 Standard Population. The 2011 rates were calculated using 2010 populations from the American Community Survey, and 2011 populations were calculated using 2010 proportions. See Methodology. See appendix table 3 for standard errors. Sources: Bureau of Justice Statistics, National Crime Victimization Survey, 2008–2011, and U.S. Census Bureau, 2000 Standard Population and the American Community Survey, 2008–2010. Table 4 Age-adjusted and unadjusted rates of violent victimization for persons without disabilities, by type of crime, 2009–2011 Type of crime Total Serious violent crime Rape/sexual assault Robbery Aggravated assault Simple assault Rates per 1,000 persons without disabilities Age-adjusted Unadjusted 2009 2010 2011 2009 2010 2011 22.4 19.5 19.4 23.3 20.2 20.1 7.4 6.5 6.0 7.7 6.8 6.2 1.3 1.1 0.9 1.3 1.2 0.9 2.3 2.0 1.8 2.4 2.1 1.9 3.8 3.4 3.3 4.0 3.6 3.4 15.0 13.0 13.4 15.5 13.4 13.9 Note: Based on the noninstitutionalized U.S. residential population age 12 or older. Estimates are age-based on 2-year rolling averages. Age-adjusted rates were created using direct standardization with the 2000 Standard Population. The 2011 rates were calculated using 2010 populations from the American Community Survey, and 2011 populations were calculated using 2010 proportions. See Methodology. See appendix table 4 for standard errors. Sources: Bureau of Justice Statistics, National Crime Victimization Survey, 2008–2011, and U.S. Census Bureau, 2000 Standard Population and the American Community Survey, 2008–2010. Crime Against Persons with Disabilities, 2009 - 2011 – Statistical Tables | December 2012 4 • Violent crime rates by sex, race, and Hispanic origin Sex In 2011, the average annual age-adjusted rate of violent victimization was greater for persons with disabilities than for those without disabilities for both males and females (table 5). The rate of violence for males with disabilities was 42 per 1,000 in 2011, compared to 22 per 1,000 for males without disabilities. For females with disabilities, the rate of violence was 53 per 1,000 in 2011, compared to 17 per 1,000 for females without disabilities. Among persons with disabilities, no statistically significant difference was found in the average annual age-adjusted rate of violent victimization for males and females in 2011. Race and Hispanic origin For each racial group measured, persons with disabilities had higher average annual age-adjusted violent victimization rates than persons without disabilities in 2011. For each of the racial groups examined, no statistically significant difference was found among persons with disabilities in the average annual age-adjusted rates of violent victimization for 2009 and 2011. In 2011, there was no statistically significant difference in the average annual age-adjusted rates of violent victimization for whites with disabilities (52 per 1,000) and blacks with disabilities (37 per 1,000). Persons of other races (including American Indians/ Alaska Natives, Asians, and Pacific Islanders) (26 per 1,000) had a lower average annual rate of violent victimization than whites (52 per 1,000) and persons of two or more races (78 per 1,000) in 2011. Among persons with and without disabilities, Hispanics had a lower average annual rate of violent victimization than non-Hispanics in 2011. Among Hispanics, persons with disabilities (33 per 1,000) had a higher average annual rate of violent victimization in 2010 than persons without disabilities (16 per 1,000). The same was true among non-Hispanics (51 per 1,000 persons with disabilities compared to 20 per 1,000 persons without disabilities). Table 5 Age-adjusted rates of violent victimization, by victim’s disability status, sex, race, and Hispanic origin, 2009–2011 Victim characteristic Total Sex Male Female Racea White Black Otherb Two or more races Hispanic/Latino originc Hispanic/Latino Non-Hispanic/Latino Rate per 1,000 persons with disabilities 2009 2010 2011 50.1 42.9 47.8 Rate per 1,000 persons without disabilities 2009 2010 2011 22.4 19.5 19.4 39.2 60.8 33.7 52.5 42.0 53.3 23.5 21.2 20.2 18.8 21.6 17.3 54.9 38.6 34.0 59.6 44.8 37.1 21.0 77.6 51.7 37.0 26.5 78.2 24.1 26.9 6.2 22.2 20.3 26.5 6.6 18.4 20.6 23.9 6.5 24.6 25.6 54.0 31.6 44.6 32.6 50.6 17.8 23.4 15.2 20.5 15.6 20.2 Note: Based on the noninstitutionalized U.S. residential population age 12 or older. Estimates are based on 2-year rolling averages. Rates were adjusted using direct standardization with the 2000 Standard Population. The 2010 rates were calculated using 2010 populations from the American Community Survey, and 2011 populations were calculated using 2010 proportions. See Methodology. See appendix table 5 for standard errors. aEach racial group includes persons of Hispanic or Latino origin. bIncludes American Indians, Alaska Natives, Asians, Native Hawaiians, and other Pacific Islanders. cIncludes persons of all races. Sources: Bureau of Justice Statistics, National Crime Victimization Survey, 2008–2010, and U.S. Census Bureau, 2000 Standard Population and the American Community Survey, 2008–2010. Crime Against Persons with Disabilities, 2009 - 2011 – Statistical Tables | December 2012 5 • Violent crime by number of disability types In 2011, an average annual 57% of nonfatal violent crime against persons with disabilities involved victims who had multiple disability types (hearing, vision, cognitive, ambulatory, self-care, independent living). While this was not statistically different from the percentage found in 2010 (51%), it was an increase from the percentage found in 2009 (41%) (table 6). From 2009 to 2011, the average annual percentage of violent victimization against persons with disabilities in which the victim had multiple disability types increased for rape/sexual assault, robbery, and simple assault. Persons with a single disability type (38 per 1,000) had a lower violent victimization rate than persons with more than one disability type (61 per 1,000) in 2011 (table 7). In 2011, the average annual age-adjusted rate of serious violent victimization against persons with one disability type was 16 per 1,000, compared to 30 per 1,000 among persons with multiple disability types. The average annual age-adjusted rate of violent crime against persons with a single disability type decreased from 53 per 1,000 in 2009 to 38 per 1,000 in 2011. Among persons with multiple disability types, the rate increased from 43 per 1,000 in 2009 to 61 per 1,000 in 2011. Table 6 Percent of violence against persons with disabilities that involved victims with multiple disability types, by type of crime, 2009–2011 Year 2009 2010 2011 Total violent crime 41.4% 50.7 56.9 Serious violent crime 37.3% 52.4 60.7 Rape/sexual assault 32.1%! 47.8 72.4 Robbery 27.3% 49.4 61.3 Aggravated assault 49.3% 56.0 56.9 Simple assault 43.3% 49.7 54.0 Note: Estimates are based on 2-year rolling averages. Persons age 15 or older with multiple disability types have two or more of the following disability types: hearing, vision, ambulatory, cognitive, self-care, and independent living. Persons are 12 to 14 with multiple disability types have two or more of the following disability types: hearing, vision, ambulatory, cognitive, and self-care. See Methodology for more information. See appendix table 6 for standard errors. ! Interpret with caution; based on 10 or fewer cases, or coefficient of variation is over 50%. Source: Bureau of Justice Statistics, National Crime Victimization Survey, 2008–2011. Table 7 Age-adjusted rate of violent victimization, by type of crime and number of disability types, 2009–2011 Type of crime Total Serious violent crime Rape/sexual assault Robbery Aggravated assault Simple assault Rate per 1,000 persons with one disability type 2009 2010 2011 52.9 38.3 37.6 17.2 15.2 15.9 2.2 1.5 1.9 ! 9.4 7.1 5.8 5.6 6.5 8.2 35.7 23.2 21.6 Rate per 1,000 persons with multiple disability types 2009 2010 2011 43.0 48.0 60.9 13.0 21.8 29.5 1.1 ! 1.9 3.6 3.4 8.1 11.9 8.4 11.8 14.0 30.0 26.2 31.3 Note: Estimates are based on 2-year rolling averages. Persons age 15 or older with multiple disability types have two or more of the following disability types: hearing, vision, ambulatory, cognitive, self-care, and independent living. Persons are 12 to 14 with multiple disability types have two or more of the following disability types: hearing, vision, ambulatory, cognitive, and self-care. See Methodology for more information. Rates were adjusted using direct standardization with the 2000 Standard Population. The 2010 rates were calculated using 2010 populations from the American Community Survey, and 2011 populations were calculated using 2010 proportions. See Methodology. See appendix table 7 for standard errors. ! Interpret with caution; based on 10 or fewer sample cases, or coefficient of variation is over 50%. Sources: Bureau of Justice Statistics, National Crime Victimization Survey, 2008–2011, and U.S. Census Bureau, 2000 Standard Population and American Community Survey, 2008–2010. Crime Against Persons with Disabilities, 2009 - 2011 – Statistical Tables | December 2012 6 • Types of disability Persons with cognitive disabilities had the highest average annual unadjusted rate of violent victimization from 2009 to 2011 (table 8). Among persons with cognitive disabilities, the average annual rate of serious violent victimization increased across the study period from 12 per 1,000 in 2009 to 24 per 1,000 in 2011 (table 9). The average annual rate of serious violent victimization against persons with self-care disabilities increased from 2009 (4 per 1,000) to 2011 (13 per 1,000). The average annual unadjusted rate of simple assault against persons with cognitive disabilities slightly declined from 2009 (34 per 1,000) to 2010 (26 per 1,000), then remained stable through 2011 (table 10). Table 9 Unadjusted rate of serious violent victimization against persons with disabilities, by disability type, 2009–2011 Disability type Hearing Vision Ambulatory Cognitive Self-care Independent living 2009 7.3 8.6 6.2 12.4 3.9 6.1 2010 4.5 12.0 8.2 17.9 7.9 10.2 Note: Estimates are based on 2-year rolling averages. Includes persons with multiple disability types. Age-adjusted rates were not generated by disability types due to differences and limitations with the data for these groups. Serious violent victimization includes rape, sexual assault, robbery, and aggravated assault. The 2010 rates were calculated using 2010 populations from the American Community Survey, and 2011 populations were calculated using 2010 proportions. Rates are per 1,000 persons age 12 and older, except for independent living disability, which is per 1,000 persons age 15 or older. See Methodology. See appendix table 9 for standard errors. Sources: Bureau of Justice Statistics, National Crime Victimization Survey, 2008–2011, and U.S. Census Bureau, American Community Survey, 2008–2010. Table 8 Unadjusted rate of violent victimization against persons with disabilities, by disability type, 2009–2011 Table 10 Unadjusted rate of simple assault of persons with disabilities, by disability type, 2009–2011 Disability type Hearing Vision Ambulatory Cognitive Self-care Independent living Disability type Hearing Vision Ambulatory Cognitive Self-care Independent living 2009 16.7 28.6 20.5 46.0 18.3 24.4 2010 10.6 24.9 19.7 43.5 17.8 26.4 2011 17.3 23.5 22.7 51.0 27.8 25.7 Note: Estimates are based on 2-year rolling averages. Includes persons with multiple disability types. Age-adjusted rates were not generated by disability types due to differences and limitations with the data for these groups. The 2010 rates were calculated using 2010 populations from the American Community Survey, and 2011 populations were calculated using 2010 proportions. Rates are per 1,000 persons age 12 and older, except for independent living disability, which is per 1,000 persons age 15 or older. See Methodology. See appendix table 8 for standard errors. Sources: Bureau of Justice Statistics, National Crime Victimization Survey, 2008–2011, and the U.S. Census Bureau, American Community Survey, 2008–2010. 2011 8.3 10.7 10.6 23.7 12.5 11.8 2009 9.4 20.0 14.2 33.5 14.4 18.2 2010 6.1 12.9 11.5 25.6 9.9 16.3 2011 9.0 12.8 12.1 27.3 15.3 13.9 Note: Estimates are based on 2-year rolling averages. Includes persons with multiple disability types. Age-adjusted rates were not generated by disability types due to differences and limitations with the data for these groups. Rates are per 1,000 persons age 12 and older, except for independent living disability, which is per 1,000 persons age 15 or older. The 2010 rates were calculated using 2010 populations from the American Community Survey, and 2011 populations were calculated using 2010 proportions. See Methodology. See appendix table 10 for standard errors. Sources: Bureau of Justice Statistics, National Crime Victimization Survey, 20082011, and the U.S. Census Bureau, American Community Survey, 2008-2010. Crime Against Persons with Disabilities, 2009 - 2011 – Statistical Tables | December 2012 7 • In 2011, with the exception of self-care, no differences were detected in the unadjusted rates of violent victimization by victim’s sex and disability type (table 11). Males with self-care disabilities (34 per 1,000) had a slightly higher rate of violent victimization than females with self-care disabilities (23 per 1,000) in 2011. Among males with disabilities— From 2009 to 2010, no change was detected in the average annual unadjusted rate of violent victimization against males with any disability type. From 2010 to 2011, the average annual unadjusted rate of violent victimization against males with hearing, cognitive, and self-care disabilities slightly increased. Among females with disabilities— The average annual unadjusted rate of violent victimization against females with hearing disabilities decreased from 27 per 1,000 in 2009 to 11 per 1,000 in 2010. There was no statistically significant difference in the average annual rates of violent victimization against females with hearing disabilities from 2010 to 2011. From 2010 to 2011, no statistically significant difference was found in the average annual unadjusted rates of violent victimization against females with vision, ambulatory, cognitive, self-care, and independent living disabilities. Table 11 Unadjusted violent victimization rate, by victim’s sex and disability type, 2009–2011 Disability type Hearing Vision Ambulatory Cognitive Self-care Independent living 2009 8.9 32.2 18.5 44.0 19.1 25.6 Rate per 1,000 males 2010 10.4 27.7 19.3 38.0 15.1 23.4 2011 19.6 21.6 24.7 49.9 33.9 22.1 2009 27.1 25.8 21.8 47.7 17.8 23.6 Rate per 1,000 females 2010 10.7 22.6 19.9 48.6 19.6 28.4 2011 14.2 25.0 21.3 52.0 23.4 28.0 Note: Estimates are based on 2-year rolling averages. Includes persons with multiple disability types. Age-adjusted rates were not generated by disability types due to data differences and limitations for males and females. Rates are per 1,000 persons age 12 and older, except for independent living disability, which is per 1,000 persons age 15 or older. The 2010 rates were calculated using 2010 populations from the American Community Survey, and 2011 populations were calculated using 2010 proportions. See Methodology. See appendix table 11 for standard errors. Sources: Bureau of Justice Statistics, National Crime Victimization Survey, 2008–2011, and U.S. Census Bureau, American Community Survey, 2008–2010. Crime Against Persons with Disabilities, 2009 - 2011 – Statistical Tables | December 2012 8 • Methodology Survey coverage The National Crime Victimization Survey (NCVS) is an annual data collection conducted by the U.S. Census Bureau for the Bureau of Justice Statistics (BJS). The NCVS is a selfreport survey in which interviewed persons are asked about the number and characteristics of victimizations experienced during the prior 6 months. The NCVS collects information on nonfatal personal crimes (rape or sexual assault, robbery, aggravated and simple assault, and personal larceny) and household property crimes (burglary, motor vehicle theft, and other theft) both reported and not reported to police. In addition to providing annual level and change estimates on criminal victimization, the NCVS is the primary source of information on the nature of criminal victimization incidents. Survey respondents provide information about themselves (such as age, sex, race and ethnicity, marital status, education level, and income) and if they experienced a victimization. For crime victims, information about the offender (such as age, race and ethnicity, sex, and victimoffender relationship), characteristics of the crime (including time and place of occurrence, use of weapons, nature of injury, and economic consequences), whether the crime was reported to police, reasons why the crime was or was not reported, and experiences with the criminal justice system are collected about each victimization incident. The NCVS is administered to persons age 12 or older from a nationally representative sample of households in the United States. Once selected, households remain in the sample for 3 years, and eligible persons in these households are interviewed every 6 months for a total of seven interviews. New households rotate into the sample on an ongoing basis to replace outgoing households that have been in sample for the 3-year period. The sample includes persons living in group quarters, such as dormitories, rooming houses, and religious group dwellings, and excludes persons living in military barracks and institutional settings, such as correctional or hospital facilities, and the homeless. (For more detail, see the Survey Methodology for Criminal Victimization in the United States, 2007, NCJ 227669, BJS web, March 2010.) In 2011, about 143,000 persons age 12 or older from about 79,800 households across the country were interviewed during the year. From 2008 to 2011—the primary reference period for this report—a total of 561,000 persons from about 315,000 households were interviewed. This equates to an annual average of about 140,000 persons age 12 or older in households interviewed each year from 2008 to 2011. The NCVS adopted questions from the U.S. Census Bureau’s American Community Survey (ACS) to measure the rate of victimization against people with disabilities. The NCVS does not identify persons in the general populations with disabilities. The ACS Subcommittee on Disability Questions developed the disability questions based on questions used in the 2000 Decennial Census and earlier versions of the ACS. The questions identify persons who may require assistance to maintain their independence, be at risk for discrimination, or lack opportunities available to the general population because of limitations related to a prolonged (6 months or longer) sensory, physical, mental, or emotional condition. More information about the ACS and the disability questions is available on the U.S. Census Bureau website at http://www.census.gov/acs/www/. Changes to the disability questions on the NCVS and ACS in 2008 In 2008, the U.S. Census Bureau changed some of the disability questions on the ACS. The question about sensory disability was separated into two questions about blindness and deafness, and the questions about physical disability were asked only about serious difficulty walking or climbing stairs. Also, questions on employment disability and going outside of the home were eliminated in 2008. Census Bureau analysis of 2007 and 2008 ACS disability data revealed significant conceptual and measurement differences between the 2007 and 2008 disability questions. The Census Bureau concluded that data users should not compare the 2007 estimates of the population with disabilities and those of later years. Because the 2007 and 2008 NCVS disability questions mirrored the ACS, estimates of victimization of people with disabilities from the 2007 and 2008 NCVS should not be compared. As a result, the 2007 disability data are not presented in this report. Further explanation about incomparability of the 2007 and 2008 ACS disability data is available at http://www.census.gov/hhes/www/ disability/2008ACS_disability.pdf. Definitions of disability types Disabilities are classified according to six limitations: hearing, vision, cognitive, ambulatory, self-care, independent living. Hearing limitation entails deafness or serious difficulty hearing. Vision limitation is blindness or serious difficulty seeing, even when wearing glasses. Cognitive limitation includes serious difficulty in concentrating, remembering, or making decisions because of a physical, mental, or emotional condition. Ambulatory limitation is difficulty walking or climbing stairs. Self-care limitation is a condition that causes difficulty dressing or bathing. Crime Against Persons with Disabilities, 2009 - 2011 – Statistical Tables | December 2012 9 • Independent living limitation is a physical, mental, or emotional condition that impedes doing errands alone, such as visiting a doctor or shopping. Disability questions included in the NCVS from 2008 through 2011 Questions 169a through 173 169a. Are you deaf or do you have serious difficulty hearing? 169b. Are you blind or do you have serious difficulty seeing even when wearing glasses? 170a. Because of a physical, mental, or emotional condition, do you have serious difficulty: concentrating, remembering, or making decisions? walking or climbing stairs? dressing or bathing? 170b. Because of a physical, mental, or emotional condition, do you have difficulty doing errands alone such as visiting a doctor’s office or shopping? 171. Is “Yes” marked in any of 169a–170b? (That is, has the respondent indicated that he/she has a health condition or disability?) 172. During the incident you just told me about, do you have reason to suspect you were victimized because of your health condition(s), impairment(s), or disability(ies)? 173. What health conditions, impairments, or disabilities do you believe caused you to be targeted for this incident? In the ACS, persons ages 12 to 14 are not asked about independent living and are therefore not included in the populations with independent living disabilities. Even though crime victims ages 12 to 14 receive this question in the NCVS (question 170b), victims ages 12 to 14 who respond affirmatively are excluded from rates of violent victimization against persons with an independent living disability in order to match the age limitations for having an independent living disability in the ACS (age 15 or older). In this report, rates of violence against persons with an independent living disability are per 1,000 persons age 15 or older, compared to rates per 1,000 persons ages 12 or older for other disability types. Also, violent crime victims ages 12 to 14 who report in the NCVS that they have an independent living disability and no other disability are classified as not having a disability to be compatible with age limits on disability definitions in the ACS. Limitations of the estimates The NCVS was designed to measure the incidence of criminal victimization against the U.S. civilian household population, excluding persons who live in institutions and the homeless. In this report, institutions refer to adult correctional facilities, juvenile facilities, nursing facilities or skilled nursing facilities, in-patient hospice facilities, residential schools for people with disabilities, and hospitals with patients who have no usual home elsewhere as defined by the ACS. The measures of crime against persons with disabilities (as measured by the NCVS and ACS) cover only people with disabilities who are living among the general population in household settings. Subsequently, there is some coverage error in using just the noninstitutionalized population. For example, according to the ACS, about 96% of 1.3 million persons age 65 or older living in institutions had disabilities in 2010. Because persons in these facilities would not be covered in the NCVS, estimates of violence against these persons are not counted. This lack of information from the institutions will result in an undercount of violence against persons with disabilities. Certain aspects of the NCVS design can also contribute to an underestimation of the level or type of violence against persons with disabilities. For example, the survey instruments, modes of interview, and interviewing protocols used in the NCVS may not be suited for interviewing people with difficulty communicating, especially by telephone. Currently, about 55% of the interviews conducted for the NCVS are by telephone. Some people have disabilities that limit their verbal communication and use technology to enhance their ability to communicate, but many people do not have access to such technology. Proxy interviews may also lead to an underestimate of violence against persons with disabilities. The survey requires direct interviews with eligible respondents and allows the use of proxy interviews with a caregiver or other eligible party in a limited set of circumstances. A proxy interview is allowed when a respondent is physically or mentally incapable of responding. The survey restrictions on proxy interviews were instituted because someone else may not know about the victimization experiences of the respondent, and because the person providing the information via proxy may be the perpetrator of the abuse or violence experienced by the respondent. Since proxy respondents may be more likely to omit crime incidents or may not know some details about reported crime incidents, the number or types of crimes against persons with disabilities may be underestimated. In 2011, about 5% of violent crime incidents against persons with disabilities were obtained from proxy interviews. In addition, in 2011, all of the violent incidents against persons with disabilities conducted by proxy interviews were for simple assault, compared to about 57% of violent incidents against persons with disabilities conducted from nonproxy interviews (not shown in table). Crime Against Persons with Disabilities, 2009 - 2011 – Statistical Tables | December 2012 10 • Disability population in the United States According to the ACS, about 14% of the U.S. population age 12 or older living outside of institutions in 2010 had a disability. Characteristics of the population with and without disabilities are compared in appendix table 11. Among noninstitutionalized persons with disabilities, 47% were male and 53% were female. Whites accounted for about 78% of the population with disabilities, blacks 14%, and persons of two or more races 2%. About 11% were Hispanic. About 70% of the population with disabilities was age 50 or older, compared to about 33% in the population of persons without disabilities. The sex, race, Hispanic origin, and age distributions of persons with a disability living outside of institutions did not change substantially between 2009 and 2010. The 2011 population estimates for persons with disabilities were based on the 2010 population distributions (see below). Comparing 2010 computed populations and 2010 ACS populations For this report BJS calculated 2010 age-adjusted and unadjusted rates of violent victimization by disability status and other demographics. BJS used population estimates that were computed using 2009 proportions of the populations by disability status from the American Community Survey (ACS). BJS did this because the 2010 populations by disability status were not available from the ACS. However, 2010 populations by disability status and other demographic characteristics were available from the 2010 ACS. BJS compared the two 2010 populations (calculated from proportions of demographic information in the 2009 ACS and actual estimates from the 2010 ACS) (appendix table 12). Even though the calculated counts differ from the ACS counts for each demographic group within both disability statuses, no systematic differences were detected between the calculated populations and the 2010 ACS populations. As a result, a decision was made to continue this practice for the 2011 rates. Computation of 2011 populations by disability status Data from 2011 were available from the NCVS but not the ACS for this report. Therefore, another method was used to generate populations used to calculate estimates of 2011 rates by disability status. First, the total resident noninstitutionalized U.S. population age 12 or older for 2011 was generated from the NCVS. Next, the proportions of the 2010 overall population by disability status and by demographic groups within each disability status were calculated from the ACS. These proportions were then applied to the overall 2011 population from the NCVS to generate 2011 populations by disability status. The 2011 rates were then calculated using the same method used to calculate the 2008, 2009, and 2010 rates, using numerators from the 2011 NCVS and the 2011 populations generated using proportions of the 2010 ACS population. Direct standardization with the 2000 U.S. Standard Population1 The method used to generate age-adjusted rates of violent victimization presented in this report was direct standardization with the 2000 U.S. Standard Population from the Decennial Census as the standard population. Age-adjusted standardization eliminates the problem of different age distributions between and within groups. In general, persons with disabilities are an older population than persons without disabilities. Since crime rates vary by age, direct standardization produces age-adjusted rates that would occur if both populations had the same age distribution as the standard population. The 2000 U.S. Standard Population was created by the U.S. Census Bureau Population Projection Program (www. census.gov/population/www/projections/index.html), which uses data from the Current Population Survey. To calculate age groups using the 2000 U.S. Standard Population, populations of single years of age were obtained for persons age 12 or older from the Census P25–1130 (www.census.gov/prod/1/pop/p25-1130/) series estimates of the 2000 populations generated by the U. S. Census Bureau Population Projection Program. These single-year populations for persons age 12 or older were then summed to create the following age groups: ages 12 to 15, 16 to 19, 20 to 24, 25 to 34, 35 to 49, 50 to 64, and 65 or older. In this report, the total standard population refers to the 2000 U.S. Standard Population age 12 or older. All weights created for this report based on the 2000 U.S. Standard Population are not race- or sex-specific, so they do not adjust for differences in the racial or sex distributions between populations of persons with and without disabilities. There is little difference in the race and sex distributions between populations of persons with and without disabilities. According to the 2010 ACS, among noninstitutionalized persons with disabilities, about 47% were male and 53% were female, compared to 49% of persons without disabilities being male and 51% being female. Whites accounted for 78% of persons with disabilities and 75% of persons without disabilities. Blacks accounted for about 14% of persons with disabilities and about 12% of persons without disabilities. Persons of other racial groups accounted for about 7% of persons with disabilities and about 11% of persons without disabilities. Persons of two or more races made up the same percentage (about 2%) of the population with and without disabilities. Hispanics accounted for about 11% of persons with disabilities and about 16% of persons without disabilities 1For more information on direct standardization, see L. R. Curtin, Ph.D. and R.J. Klein, M.P.H., (1995) Direct Standardization (Age-adjusted Death Rates). Centers for Disease Control and Prevention. National Center for Health Statistics, 6. Available at: http://www.cdc.gov/nchs/data/statnt/ statnt06rv.pdf Crime Against Persons with Disabilities, 2009 - 2011 – Statistical Tables | December 2012 11 • in 2010. Non-Hispanics accounted for about 89% of persons with disabilities and about 84% of persons without disabilities. The violent victimization rate, age-adjusted using direct standardization with the 2000 U.S. Standard Population as the standard population (Rd), is calculated as— Rd = ∑ (wa * ra) where Rd = age-adjusted rate of violent victimization of the population of interest calculated using direct standardization wa = weight calculated from the 2000 U.S. Standard Population for age group a ra = unadjusted rate of violent victimization for age group a. The weight (wa) for age group a is calculated as— wa = na / N where wa = weight calculated from the 2000 U.S. Standard Population for age group a na = number of persons in age group a in the 2000 U.S. Standard Population N = total number of persons in the 2000 U.S. Standard Population This method produces rates of violent victimization as if the population of interest had the same age distribution as the 2000 U.S. Standard Population. To use this method to produce age-adjusted rates of violent victimization for persons with disabilities, ra would represent the unadjusted violent victimization rate against persons with disabilities in age group a. To calculate the violent victimization rate of persons without disabilities, ra would represent the unadjusted violent victimization rate against persons without disabilities in age group a. Property crime In the first two reports in this series, Crime Against People with Disabilities, 2007, BJS web, NCJ 227814, October 2009, and Crime Against People with Disabilities, 2008, BJS web, NCJ 231328, December 2010, property crime by disability status was included. These statistics are not included in this report due to potential underreporting of property crimes against persons with disabilities. The NCVS measure of property crime is a household-based measure. The questions NCVS uses to identify whether a person has a disability are asked only of those respondents who reported that they have been victimized. If the person who reports the property crime is a household member with a disability, then the NCVS identifies the property crime as one against a household that has a person with a disability. If a household member without a disability reports the property crime during the survey, the NCVS does not ask whether any other household member has a disability. For this reason, any estimate of property crime against people with disabilities using the NCVS may be an undercount of such crimes. As a result, information regarding property crime is not included in this report. Nonresponse and weighting adjustments The 79,800 households that participated in the NCVS in 2011 represent a 90% household response rate. The personlevel response rate—the percentage of persons age 12 or older in participating households who completed an NCVS interview—was 88% in 2011. Estimates in this report use data from the 2008 to 2011 NCVS data files weighted to produce annual estimates for persons age 12 or older living in U.S. households. Because the NCVS relies on a sample rather than a census of the entire U.S. population, weights are designed to inflate sample point estimates to known population totals and to compensate for survey nonresponse and other aspects of the sample design. The NCVS data files include both household and person weights. The household weight is commonly used to calculate estimates of property crimes, such as motor vehicle theft or burglary, which are identified with the household. Person weights provide an estimate of the population represented by each person in the sample. Person weights are most frequently used to compute estimates of crime victimizations of persons in the total population. After proper adjustment, both household and person weights are also used to form the denominator in calculations of crime rates. The victimization weights used in this analysis account for the number of persons present during an incident and for repeat victims of series incidents. The weight counts series incidents as the actual number of incidents reported by the victim, up to a maximum of ten incidents. Series victimizations are victimizations that are similar in type but occur with such frequency that a victim is unable to recall each individual event or to describe each event in detail. Survey procedures allow NCVS interviewers to identify and classify these similar victimizations as series victimizations and collect detailed information on only the most recent incident in the series. In 2010 and 2011, about 3% of all victimizations were series incidents. The approach to weighting series incidents as the number of incidents up to a maximum of ten produces more reliable estimates of crime levels, while the cap at 10 minimizes the effect of extreme outliers on the rates. Additional information on the series enumeration is detailed in the report Methods for Counting Crime Against Persons with Disabilities, 2009 - 2011 – Statistical Tables | December 2012 12 • High Frequency Repeat Victimizations in the National Crime Victimization Survey, NCJ 237308, BJS web, April 2012. For this report, prior to applying the weights to the data, all victimizations that occurred outside of the U.S. were excluded. From 2008 to 2011, about 30 of the approximately 5,100 total unweighted violent victimizations occurred outside of the U.S. and were excluded from the analyses. Data users can use the estimates and the standard errors of the estimates provided in this report to generate a confidence interval around the estimate as a measure of the margin of error. The following example illustrates how standard errors can be used to generate confidence intervals: According to the NCVS, during 2010 and 2011, 56.9% of violent crime against persons with disabilities involved victims with multiple disability types (see table 6). Using the GVFs, BJS determined that the estimate has a standard error of 2.5% (see appendix table 5). A confidence interval around the estimate was generated by multiplying the standard errors by ±1.96 (the t-score of a normal, two-tailed distribution that excludes 2.5% at either end of the distribution). Therefore, the confidence interval around the 56.9% estimate from 2011 is 56.9% ± 2.5% x 1.96 or (52.0% to 61.8%). In others words, if different samples using the same procedures were taken from the U.S. population during 2010 and 2011, 95% of the time the percentage of violent crimes against persons with disabilities in which the victim had multiple disability types would fall between 52.0% and 61.8%. Standard error computations for percentages and unadjusted rates When national estimates are derived from a sample, as is the case with the NCVS, caution must be taken when comparing one estimate to another or when comparing estimates over time. Although one estimate may be larger than another, estimates based on a sample have some degree of sampling error. The sampling error of an estimate depends on several factors, including the amount of variation in the responses, the size of the sample, and the size of the subgroup for which the estimate is computed. When the sampling error around the estimates is taken into consideration, the estimates that appear different may, in fact, not be statistically different. One measure of the sampling error associated with an estimate is the standard error. The standard error can vary from one estimate to the next. In general, for a given metric, an estimate with a smaller standard error provides a more reliable approximation of the true value than an estimate with a larger standard error. Estimates with relatively large standard errors are associated with less precision and reliability and should be interpreted with caution. In order to generate standard errors around numbers and estimates from the NCVS, the Census Bureau produces generalized variance function (GVF) parameters for BJS. The GVFs take into account aspects of the NCVS complex sample design and represent the curve fitted to a selection of individual standard errors based on the Jackknife Repeated Replication technique. The GVF parameters were used to generate standard errors for each point estimate (such as counts, percentages, and rates) in the report. For average annual estimates, standard errors were based on the ratio of the sums of victimizations and respondents across years. In this report, BJS conducted tests to determine whether differences in estimated numbers and percentages were statistically significant once sampling error was taken into account. Using statistical programs developed specifically for the NCVS, we tested the significance of all comparisons in the text. The primary test procedure used was Student’s t-statistic, which tests the difference between two sample estimates. To ensure that the observed differences between estimates were larger than might be expected due to sampling variation, we set the significance level at the 95% confidence level. In this report, a coefficient of variation (CV), representing the ratio of the standard error to the estimate, was also calculated for all estimates. CVs provide a measure of reliability and a means to compare the precision of estimates across measures with differing levels or metrics. In cases where the CV was greater than 50%, or the unweighted sample had 10 or fewer cases, the estimate was noted with a “!” symbol (interpret data with caution; estimate based on 10 or fewer sample cases, or coefficient of variation exceeds 50%). Standard error computations and statistical significance for age-adjusted rates2 Due to the complexity in generating age-adjusted rates of violent crime, other methods were used to compute standard errors and determine statistical significance. For each age-adjusted rate, variances were computed for each age group-specific rate using information from the generalized variance function (GVF) parameters that the Census Bureau produced for the NCVS. For each age group, the variance was multiplied by the squared weight for that particular age group in the 2000 U.S. Standard Population. The result was then summed across all age groups to produce the variance for the age-adjusted rate. The square root was taken of this variance to produce the standard error of the age-adjusted 2For more information on computing standard errors for age-adjusted rates, see Anderson, R.N., Rosenberg, H.M. (1998). Age standardization of death rates: implementation of the year 2000 standard national vital statistic reports, 47 (3), Hyattsville, Maryland: National Center for Health Statistics. Available at http://www.cdc.gov/nchs/data/nvsr/nvsr47/nvs47_03.pdf. Crime Against Persons with Disabilities, 2009 - 2011 – Statistical Tables | December 2012 13 • rate. To calculate statistical significance among age-adjusted rates, the standard errors were computed for each ageadjusted rate. Next, confidence intervals were generated using these standard errors with the following formula (Rd ± 1.96 * sd), in which Rd represents the age-adjusted rate and sd represents the standard error of Rd. If the confidence intervals of two age-adjusted rates did not overlap, the difference was considered statistically significant at the .05 level. If the confidence intervals of two age-adjusted rates did overlap, the difference was considered to be not statistically significant at the .05 level. Crime Victims with Disabilities Awareness Act (Public Law 105-301), 1998 The Crime Victims with Disabilities Awareness Act mandates that the National Crime Victimization Survey (NCVS) include statistics on crimes against people with disabilities and the characteristics of these victims. The act was designed “to increase public awareness of the plight of victims of crime with developmental disabilities, to collect data to measure the magnitude of the problem, and to develop strategies to address the safety and justice needs of victims of crime with developmental disabilities.” Section 5 of the act directed the Department of Justice to include statistics relating to “the nature of crimes against people with developmental disabilities; and the specific characteristics of the victims of those crimes” in the NCVS. This report is a part of the Bureau of Justice Statistics’ (BJS) series on crime against people with disabilities. More information can be found on the BJS website. Because of changes in the questionnaire, comparisons between 2007 data and later years should not be made. (See Methodology for more information on changes to the NCVS and ACS questionnaires.) Crime Against Persons with Disabilities, 2009 - 2011 – Statistical Tables | December 2012 14 • Appendix table 1 Standard errors for average annual number of violent crimes, by type of crime and victim’s disability status, 2009–2011 Type of crime Total Serious violent crime Rape/sexual assault Robbery Aggravated assault Simple assault 2009 85,795 44,167 13,930 26,598 26,376 66,656 Persons with disabilities 2010 81,674 47,216 11,910 23,563 27,846 64,157 2011 71,405 43,922 13,569 24,009 29,381 52,219 2009 224,509 116,066 37,876 56,197 75,843 169,346 Persons without disabilities 2010 218,761 112,680 35,757 45,850 67,919 177,807 2011 186,203 90,466 26,359 43,849 63,071 151,311 Source: Bureau of Justice Statistics, National Crime Victimization Survey, 2008–2011. Appendix table 2 Standard errors for unadjusted violent victimization rates, by victim’s disability status and age, 2009–2011 Age of victim Total 12–15 years old 16–19 20–24 25–34 35–49 50–64 65 or older Rate per 1,000 persons with disabilities 2009 2010 2011 1.8 1.7 1.5 17.5 14.3 12.5 14.4 16.6 15.4 15.5 13.3 13.7 7.8 7.1 7.2 5.5 5.3 4.1 2.9 2.9 2.2 0.7 0.7 0.8 Rate per 1,000 persons without disabilities 2009 2010 2011 0.8 0.8 0.7 3.3 2.9 2.2 2.8 2.6 2.4 2.7 2.5 2.1 1.8 1.8 1.5 1.2 1.1 1.0 1.0 1.0 0.8 0.7 0.7 0.5 Sources: Bureau of Justice Statistics, National Crime Victimization Survey, 2008–2011, and U.S. Census Bureau, American Community Survey, 2008–2010. Appendix table 3 Standard errors for age-adjusted and unadjusted rates of violent victimization for persons with disabilities, by type of crime , 2009–2011 Type of crime Total Serious violent crime Rape/sexual assault Robbery Aggravated assault Simple assault Rates per 1,000 persons with disabilities Age-adjusted Unadjusted 2009 2010 2011 2009 2010 2011 2.9 2.7 2.5 1.8 1.7 1.5 1.6 1.7 1.6 0.9 1.0 0.9 0.4 0.5 0.5 0.3 0.2 0.3 1.0 0.9 1.0 0.6 0.5 0.5 1.0 1.1 1.1 0.6 0.6 0.6 2.3 2.1 1.8 1.4 1.4 1.1 Sources: Bureau of Justice Statistics, National Crime Victimization Survey, 2008–2011, and U.S. Census Bureau, 2000 Standard Population and the American Community Survey, 2008–2010. Appendix table 4 Standard errors for age-adjusted and unadjusted rates of violent victimization for persons without disabilities, by type of crime , 2009–2011 Type of crime Total Serious violent crime Rape/sexual assault Robbery Aggravated assault Simple assault Rates per 1,000 persons without disabilities Age-adjusted Unadjusted 2009 2010 2011 2009 2010 2011 0.6 0.6 0.5 0.8 0.8 0.7 0.3 0.3 0.3 0.4 0.4 0.3 0.1 0.1 0.1 0.1 0.1 0.1 0.2 0.1 0.1 0.2 0.2 0.1 0.2 0.2 0.2 0.3 0.2 0.2 0.5 0.5 0.4 0.6 0.6 0.5 Sources: Bureau of Justice Statistics, National Crime Victimization Survey, 2008–2011, and U.S. Census Bureau, 2000 Standard Population and the American Community Survey, 2008–2010. Crime Against Persons with Disabilities, 2009 - 2011 – Statistical Tables | December 2012 15 • Appendix table 5 Standard errors for age-adjusted rates of violent victimization, by victim’s disability status, sex, race, and Hispanic origin, 2009–2011 Rate per 1,000 persons with disabilities 2009 2010 2011 2.9 2.7 2.5 Victim characteristic Total Sex Male Female Race White Black Other Two or more races Hispanic/Latino origin Hispanic/Latino Non-Hispanic/Latino Rate per 1,000 persons without disabilities 2009 2010 2011 0.6 0.6 0.5 3.3 4.5 3.1 4.3 3.0 3.7 0.8 0.8 0.8 0.8 0.7 0.6 3.6 5.5 7.3 14.8 3.3 5.5 5.8 14.8 3.0 4.8 5.5 11.7 0.7 1.7 0.8 3.9 0.7 1.7 0.8 3.2 0.6 1.3 0.7 3.3 5.0 3.2 5.4 3.0 4.7 2.7 1.2 0.7 1.1 0.7 0.9 0.6 Sources: Bureau of Justice Statistics, National Crime Victimization Survey, 2008–2011, and U.S. Census Bureau, 2000 Standard Population and the American Community Survey, 2008–2010. Appendix table 6 Standard errors for percent of violence against persons with disabilities that involved victims with multiple disability types, by type of crime, 2009–2011 Year 2009 2010 2011 Total 2.8% 3.1 2.5 Serious violent crime 4.6% 4.7 3.6 Rape/sexual assault 10.1% 12.2 7.1 Robbery 5.9% 5.7 5.5 Aggravated assault 6.9% 5.7 4.9 Simple assault 3.2% 4.0 3.3 Source: Bureau of Justice Statistics, National Crime Victimization Survey, 2008–2011. Appendix table 7 Standard errors for age-adjusted rate of violent victimization, by type of crime and number of disability types, 2009–2011 Rate per 1,000 persons with one disability type 2009 2010 2011 3.8 3.2 2.7 2.1 2.0 1.8 0.6 0.6 0.6 1.5 1.1 1.1 1.1 1.2 1.2 3.0 2.6 2.1 Type of crime Total Serious violent crime Rape/sexual assault Robbery Aggravated assault Simple assault Rate per 1,000 persons with multiple disability types 2009 2010 2011 4.0 4.3 4.2 2.3 3.0 3.0 0.5 0.7 0.9 1.0 1.5 1.9 1.9 2.0 2.0 3.2 3.2 3.1 Sources: Bureau of Justice Statistics, National Crime Victimization Survey, 2008–2011, and U.S. Census Bureau, 2000 Standard Population and the American Community Survey, 2008–2010. Appendix table 8 Standard errors for unadjusted rate of violent victimization of persons with disabilities, by disability type, 2009–2011 Disability type Hearing Vision Ambulatory Cognitive Self-care Independent living 2009 2.3 3.7 1.9 3.6 2.8 2.5 2010 1.8 3.5 1.9 3.6 2.8 2.6 2011 2.0 2.9 1.7 3.3 3.0 2.2 Sources: Bureau of Justice Statistics, National Crime Victimization Survey, 2008–2011, and U.S. Census Bureau, 2000 Standard Population and the American Community Survey, 2008–2010. Appendix table 9 Standard errors for unadjusted rate of serious violent victimization of persons with disabilities, by disability type, 2009–2011 Disability type Hearing Vision Ambulatory Cognitive Self-care Independent living 2009 1.4 1.9 1.0 1.7 1.2 1.2 2010 1.1 2.4 1.2 2.2 1.8 1.6 2011 1.3 1.9 1.1 2.1 1.9 1.4 Sources: Bureau of Justice Statistics, National Crime Victimization Survey, 2008–2011, and U.S. Census Bureau, 2000 Standard Population and the American Community Survey, 2008–2010. Crime Against Persons with Disabilities, 2009 - 2011 – Statistical Tables | December 2012 16 • Appendix table 10 Standard errors for unadjusted rate of simple assault of persons with disabilities, by disability type, 2009–2011 Disability type Hearing Vision Ambulatory Cognitive Self-care Independent living 2009 1.6 2.9 1.5 2.9 2.4 2.0 2010 1.4 2.6 1.5 2.8 2.1 2.1 2011 1.4 2.1 1.2 2.3 2.2 1.6 Sources: Bureau of Justice Statistics, National Crime Victimization Survey, 2008–2011, and U.S. Census Bureau, American Community Survey, 2008–2010. Appendix table 11 Standard errors for unadjusted violent victimization rate, by victim’s sex and disability type, 2009–2011 Disability type Hearing Vision Ambulatory Cognitive Self-care Independent living 2009 2.1 5.7 2.7 4.8 4.3 3.8 Rate per 1,000 males 2010 2.3 5.4 2.8 4.5 3.8 3.7 2011 2.7 4.0 2.7 4.3 4.9 3.0 2009 4.3 4.5 2.5 4.8 3.5 3.0 Rate per 1,000 females 2010 2.7 4.4 2.4 5.0 3.7 3.4 2011 2.6 3.9 2.1 4.3 3.4 2.8 Sources: Bureau of Justice Statistics, National Crime Victimization Survey, 2008–2011, and U.S. Census Bureau, American Community Survey, 2008–2010. Crime Against Persons with Disabilities, 2009 - 2011 – Statistical Tables | December 2012 17 • Appendix table 12 Numbers and percentages of U.S. population, by the victim’s disability status and demographic characteristics, 2008–2011 Percent Number of total 34,542,850 100% Persons with disabilities 2009 2010 Percent Percent Number of total Number of total 34,594,740 100% 34,764,390 100% 2011a Percent Number of total 35,044,480 100% 16,134,760 18,408,100 46.7% 53.3 16,145,870 18,448,880 46.7% 53.3 16,348,080 18,416,320 47.0% 53.0 16,479,790 18,564,690 26,779,910 4,750,700 2,321,130 691,130 77.5% 13.8 6.7 2.0 26,770,240 4,758,810 2,330,640 735,050 77.4% 13.8 6.7 2.1 26,928,340 4,801,350 2,248,630 786,080 77.5% 13.8 6.5 2.3 3,570,960 30,971,900 10.3% 89.7 3,621,420 30,973,320 10.5% 89.5 3,684,640 31,079,750 891,960 966,910 1,108,790 2,254,470 5,847,340 9,293,610 14,179,780 2.6% 2.8 3.2 6.5 16.9 26.9 41.0 893,740 966,820 1,132,250 2,273,010 5,682,810 9,457,110 14,189,010 2.6% 2.8 3.3 6.6 16.4 27.3 41.0 902,410 954,390 1,091,830 2,161,570 5,484,270 9,818,280 14,351,650 2008 Demographic characteristic Total Sex Male Female Raceb White Black/African American Otherc Two or more races Hispanic/Latino origind Hispanic/Latino Non-Hispanic/Latino Age 12–15 years old 16–19 20–24 25–34 35–49 50–64 65 or older Percent Number of total 215,281,100 100% Persons without disabilities 2009 2010 Percent Percent Number of total Number of total 217,432,740 100% 220,719,440 100% 2011a Percent Number of total 222,497,760 100% 47.0% 53.0 105,024,230 48.8% 110,256,880 51.2 106,103,860 48.8% 111,328,880 51.2 107,190,190 48.6% 113,529,260 51.4 108,053,810 48.6% 114,443,950 51.4 27,145,300 4,840,030 2,266,740 792,410 77.5% 13.8 6.5 2.3 164,212,730 76.3% 24,747,120 11.5 22,603,650 10.5 3,717,600 1.7 165,491,020 76.1% 25,097,270 11.5 22,851,160 10.5 3,993,300 1.8 166,184,620 75.3% 25,836,680 11.7 24,068,660 10.9 4,629,490 2.1 167,523,550 75.3% 26,044,840 11.7 24,262,580 10.9 4,666,790 2.1 10.6% 89.4 3,714,330 31,330,160 10.6% 89.4 31,381,360 14.6% 183,899,740 85.4 32,306,700 14.9% 185,126,050 85.1 34,555,840 15.7% 186,163,600 84.3 34,834,250 15.7% 187,663,500 84.3 2.6% 2.7 3.1 6.2 15.8 28.2 41.3 909,680 962,070 1,100,620 2,178,980 5,528,450 9,897,380 14,467,280 2.6% 2.7 3.1 6.2 15.8 28.2 41.3 2008 15,589,310 16,508,510 19,176,890 36,890,080 58,637,060 45,449,810 23,029,460 7.2% 7.7 8.9 17.1 27.2 21.1 10.7 15,608,380 16,400,530 19,554,590 37,884,080 57,658,620 46,583,060 23,743,490 7.2% 7.5 9.0 17.4 26.5 21.4 10.9 15,745,360 16,661,360 19,885,940 37,667,390 57,228,680 48,750,130 24,780,600 7.1% 7.5 9.0 17.1 25.9 22.1 11.2 15,872,220 16,795,600 20,046,150 37,970,870 57,689,770 49,142,900 24,980,250 7.1% 7.5 9.0 17.1 25.9 22.1 11.2 Note: Based on the noninstitutionalized U.S. residential population age 12 or older. aThe 2011 populations are estimated based on 2010 proportions. bIncludes persons of Hispanic or Latino origin. cIncludes American Indians, Alaska Natives, Asians, Native Hawaiians, and other Pacific Islanders. dIncludes persons of all races. Sources: U.S. Census Bureau, American Community Survey, 2008–2010. Crime Against Persons with Disabilities, 2008 - 2011 – Statistical Tables | April 2012 18 Appendix table 13 U.S. residential population calculated and according to the Census Bureau’s actual ACS estimates, by victim’s disability status and demographic characteristics, 2010 Demographic characteristic Total Sex Male Female Racec White Black/African American Other raced Two or more races Hispanic/Latino origine Hispanic/Latino Non-Hispanic/Latino Age 12–15 years old 16–19 20–24 25–34 35–49 50–64 65 or older Calculateda Percent Number of total 35,134,800 100% Persons with disabilities ACS estimate Percent Number of total 34,764,390 100% Differenceb Percent Number change 370,420 1.1% Calculateda Percent Number of total 220,827,130 100% Persons without disabilities ACS estimate Percent Number of total 220,719,440 100% Differenceb Percent Number change 107,690 0.0%f 16,397,920 18,736,890 46.7% 53.3 16,348,080 18,416,320 47.0% 53.0 49,840 320,570 0.3% 1.7 107,760,270 113,066,860 48.8% 51.2 107,190,190 113,529,260 48.6% 51.4 570,080 -462,390 0.5% -0.4 27,188,160 4,833,100 2,367,020 746,520 77.4% 13.8 6.7 2.1 26,928,340 4,801,350 2,248,630 786,080 77.5% 13.8 6.5 2.3 259,820 31,750 118,400 -39,560 1.0% 0.7 5.3 -5.0 168,074,540 25,489,060 23,207,900 4,055,640 76.1% 11.5 10.5 1.8 166,184,620 25,836,680 24,068,660 4,629,490 75.3% 11.7 10.9 2.1 1,889,920 -347,620 -860,770 -573,850 1.1% -1.3 -3.6 -12.4 3,677,950 31,456,850 10.5% 89.5 3,684,640 31,079,750 10.6% 89.4 -6,690 377,100 -0.2% 1.2 32,811,040 188,016,090 14.9% 85.1 34,555,840 186,163,600 15.7% 84.3 -1,744,790 1,852,490 -5.0% 1.0 908,060 981,910 1,149,920 2,308,490 5,771,530 9,604,740 14,410,510 2.6% 2.8 3.3 6.6 16.4 27.3 41.0 902,410 954,390 1,091,830 2,161,570 5,484,270 9,818,280 14,351,660 2.6% 2.7 3.1 6.2 15.8 28.2 41.3 5,650 27,530 58,090 146,920 287,260 -213,540 58,860 0.6% 2.9 5.3 6.8 5.2 -2.2 0.4 15,852,040 16,656,560 19,859,860 38,475,500 58,558,740 47,310,280 24,114,160 7.2% 7.5 9.0 17.4 26.5 21.4 10.9 15,745,360 16,661,360 19,885,940 37,667,390 57,228,680 48,750,130 24,780,600 7.1% 7.5 9.0 17.1 25.9 22.1 11.2 106,680 -4,800 -26,080 808,110 1,330,060 -1,439,850 -666,450 0.7% -0.0g -0.1 2.1 2.3 -3.0 -2.7 Note: Based on the U.S. noninstituionalized resident U.S. population age 12 or older. aCalculated based on 2009 proportions. See Methodology. bNegative estimate means that the calculated estimate was lower than the actual estimate from the U.S. Census Bureau’s American Community Survey. cEach racial group includes Hispanics and Latinos. dIncludes American Indians, Alaska Natives, Asians, Native Hawaiians, and other Pacific Islanders. eIncludes persons of all racial groups. fRounds to less than 0.1%. gRounds to less than -0.1%. Source: The U.S. Census Bureau, American Community Survey, 2009-2010. Crime Against Persons with Disabilities, 2008 - 2011 – Statistical Tables | April 2012 19 Appendix table 14 Unadjusted rate of violent victimization, by victim’s disability status and demographic characteristics, 2009–2011 Demographic characteristic Total Sex Male Female Racea White Black Otherb Two or more races Hispanic/Latino originc Hispanic/Latino Non-Hispanic/Latino Rate per 1,000 persons with disabilities 2009 2010 2011 28.9 25.1 26.4 Rate per 1,000 persons without disabilities 2009 2010 2011 23.3 20.2 20.1 25.9 31.5 22.9 27.1 26.0 26.8 24.8 21.8 21.2 19.3 22.6 17.7 28.0 31.7 25.3 54.8 23.9 28.0 14.4 83.4 25.0 25.5 22.3 91.7 24.2 30.4 7.2 29.3 20.4 29.9 7.9 24.4 20.5 27.4 7.7 28.2 19.8 29.9 24.9 25.1 25.7 26.5 21.1 23.6 18.1 20.6 18.9 20.3 Note: Based on the noninstitutionalized U.S. residential population age 12 or older. Estimates are based on two-year rolling averages. The 2011 rates were calculated using 2010 populations from the American Community Survey, and 2011 populations were calculated using 2010 proportions. See Methodology. See appendix table 15 for standard errors. aEach racial group includes persons of Hispanic or Latino origin. bIncludes American Indians, Alaska Natives, Asians, Native Hawaiians, and other Pacific Islanders. cIncludes persons of all races. Sources: Bureau of Justice Statistics, National Crime Victimization Survey, 2008–2011, and U.S. Census Bureau, American Community Survey, 2008–2010. Appendix table 15 Standard errors for unadjusted rate of violent victimization, by victim’s disability status and demographic characteristics, 2009–2011 Demographic characteristic Total Sex Male Female Race White Black Other Two or more races Hispanic/Latino origin Hispanic/Latino Non-Hispanic/Latino Rate per 1,000 persons with disabilities 2009 2010 2011 1.8 1.7 1.5 Rate per 1,000 persons without disabilities 2009 2010 2011 0.8 0.8 0.7 2.3 2.5 2.2 2.3 2.0 2.0 1.1 1.0 1.0 1.0 0.9 0.8 2.0 4.4 5.5 14.0 1.9 4.2 4.1 16.8 1.6 3.4 4.4 14.6 0.9 2.1 1.0 4.7 0.9 2.2 1.0 4.1 0.7 1.7 0.9 3.6 3.9 1.9 4.4 1.8 3.8 1.6 1.6 0.9 1.5 0.8 1.2 0.7 Sources: Bureau of Justice Statistics, National Crime Victimization Survey, 2008–2011, and U.S. Census Bureau, American Community Survey, 2008–2010. Crime Against Persons with Disabilities, 2009 - 2011 – Statistical Tables | December 2012 20 • Appendix table 16 Unadjusted rates of violent victimization, by type of crime and victim’s number of disability types, 2009–2011 Type of crime Total Serious violent crime Rape/sexual assault Robbery Aggravated assault Simple assault Rate per 1,000 persons with one disability type 2009 2010 2011 33.3 24.4 22.5 11.1 9.1 8.9 1.7 1.0 0.9 ! 5.6 4.1 3.1 3.8 4.1 4.8 22.2 15.2 13.6 Rate per 1,000 persons with multiple disability types 2009 2010 2011 24.3 25.9 30.5 6.8 10.4 14.1 0.8 ! 0.9 2.5 2.2 4.1 5.1 3.8 5.4 6.6 17.5 15.5 16.3 Note: Based on the noninstitutionalized U.S. residential population age 12 or older. Estimates are based on two-year rolling averages. Disability types measured are hearing, vision, cognitive, ambulatory, self-care, and independent living. Disability types are defined in the Methodology. The 2010-2011 rates were calculated using 2010 populations from the American Community Survey, and 2011 populations were calculated using 2010 proportions. See Methodology. See appendix table 17 for standard errors. ! Interpret with caution; based on 10 or fewer sample cases, or coefficient of variation is greater than 50%. Sources: Bureau of Justice Statistics, National Crime Victimization Survey, 2008–2011, and U.S. Census Bureau, American Community Survey, 2008–2010. Appendix table 17 Standard errors for unadjusted rates of violent victimization, by type of crime and victim’s number of disability types, 2009–2011 Type of crime Total Serious violent crime Rape/sexual assault Robbery Aggravated assault Simple assault Rate per 1,000 persons with one disability type 2009 2010 2011 2.6 2.2 1.8 1.4 1.3 1.1 0.5 0.3 0.3 0.9 0.7 0.6 0.8 0.7 0.8 2.0 1.8 1.4 Rate per 1,000 persons with multiple disability types 2009 2010 2011 2.2 2.3 2.2 1.1 1.4 1.4 0.3 0.3 0.5 0.6 0.7 0.8 0.8 0.9 0.9 1.8 1.8 1.6 Sources: Bureau of Justice Statistics, National Crime Victimization Survey, 2008–2011, and U.S. Census Bureau, American Community Survey, 2008–2010. Crime Against Persons with Disabilities, 2009 - 2011 – Statistical Tables | December 2012 21 • The Bureau of Justice Statistics is the statistical agency of the U.S. Department of Justice. James P. Lynch is director. This report was prepared and data were analyzed by Erika Harrell, Ph.D. Jennifer Truman, Ph.D. verified the report. Vanessa Curto and Jill Thomas edited the report, and Barbara Quinn produced the report under the supervision of Doris J. James. December, NCJ 240299 NCJ237961 Office of Justice Programs Innovation • Partnerships • Safer Neighborhoods www.ojp.usdoj.gov


