

Bjs, Justice Expenditure and Employment, 2003
Download original document:
Document text
Document text
This text is machine-read, and may contain errors. Check the original document to verify accuracy.
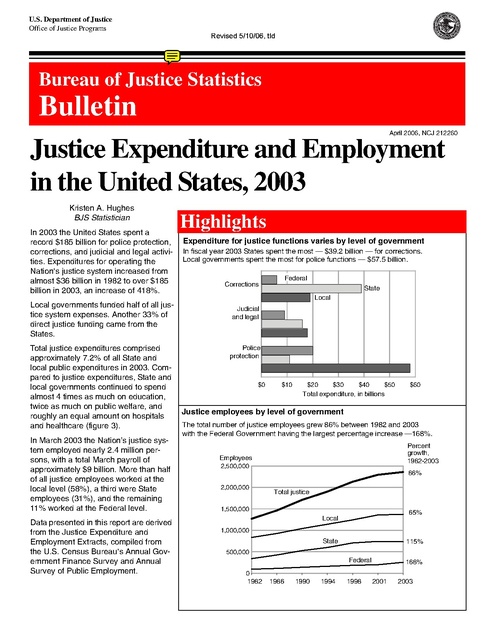
U.S. Department of Justice
Office of Justice Programs

Revised 5/10/06, tld

Bureau of Justice Statistics

Bulletin
April 2006, NCJ 212260

Justice Expenditure and Employment
in the United States, 2003
Kristen A. Hughes
BJS Statistician
In 2003 the United States spent a
record $185 billion for police protection,
corrections, and judicial and legal activities. Expenditures for operating the
Nation=s justice system increased from
almost $36 billion in 1982 to over $185
billion in 2003, an increase of 418%.

Highlights
Expenditure for justice functions varies by level of government
In fiscal year 2003 States spent the most — $39.2 billion — for corrections.
Local governments spent the most for police functions — $57.5 billion.
Federal
Corrections

State
Local

Local governments funded half of all justice system expenses. Another 33% of
direct justice funding came from the
States.
Total justice expenditures comprised
approximately 7.2% of all State and
local public expenditures in 2003. Compared to justice expenditures, State and
local governments continued to spend
almost 4 times as much on education,
twice as much on public welfare, and
roughly an equal amount on hospitals
and healthcare (figure 3).
In March 2003 the Nation’s justice system employed nearly 2.4 million persons, with a total March payroll of
approximately $9 billion. More than half
of all justice employees worked at the
local level (58%), a third were State
employees (31%), and the remaining
11% worked at the Federal level.
Data presented in this report are derived
from the Justice Expenditure and
Employment Extracts, compiled from
the U.S. Census Bureau=s Annual Government Finance Survey and Annual
Survey of Public Employment.

Judicial
and legal

Police
protection

$0

$10

$20
$30
$40
$50
Total expenditure, in billions

$60

Justice employees by level of government
The total number of justice employees grew 86% between 1982 and 2003
with the Federal Government having the largest percentage increase —168%.
Percent
growth,
1982-2003

Employees
2,500,000

86%
2,000,000

Total justice

1,500,000

65%

Local
1,000,000

State

115%

500,000

Federal
0
1982

1986

1990

1994

1998

168%
2001

2003

Revised 5/10/06, tld

The extracts present public expenditure and employment data pertaining
to justice activities in the United States,
including police protection, judicial and
legal services, and correctional activities. (For definition of terms, see page
9).
Trends in spending by level
of government
Between 1982 and 2003, per capita
expenditure, including Federal, State,
and local governments across justice
functions, increased from $158 to
$638, over 300% (see Appendix table,
page 9). During the same time period:
• Correction expenditures increased
423%, from $40 to $209 per U.S.
resident (figure 1).

enforcement related grant programs in
the 1980's and 1990's.1

The total justice expenditure reflected
the Federal Government=s expanded
role as it had a larger average annual
increase in justice spending from 1982
to 2003 (10%) than State and local
governments (8% and 7% respectively).

Between 1982 and 2003, the Federal
Government increased expenditures
on police protection by 708%, judicial
and legal services by 573%, and
corrections by 925%. State and local
governments had smaller percent
increases in all functions (table 2).

Federal intergovernmental spending
on justice activities rose from $189 million in 1982 to more than $5.1 billion in
2003. This increase was due primarily
to the creation of several large law

1
For detailed information on Federal Government grants and payments to State and local
governments see U.S. Census Bureau publication Federal Aid to States for Fiscal Year 2003 at
<http://www.census.gov/prod/abs/fas.html>.

Total per capita expenditure for each justice functions increased between 1982
and 2003, with corrections having the largest per capita increase — 423%
Percent
growth,
1982-2003

Expenditure per capita
$300

• Judicial and legal expenditures
increased 321%, from $34 to $143.

241%

$250

• Police protection expenditures
increased 241%, from $84 to $286.

423%

$200

Police

$150

Since 1982 total direct expenditures
increased more than five-fold from
nearly $36 billion to over $185 billion, a
418% increase (figure 2). The average
annual increase between 1982 and
2003 was nearly 8% (table 1).

321%
Corrections

$100

Judicial and legal
$50
$0
1982

1987

1992

1997

2003

Note: See Appendix table on page 9 for more information.

Figure 1

Table 1. Total, direct, and intergovernmental justice expenditure and percent change, by level of government fiscal years
1982-2003

Year
Expenditure (in millions)
1982
1987
1992
1997
2000
2001
2002
2003
Percent change
1982-2003
Average annual percent
change, 1982-2003

Total*
(Federal,
State, and
local direct)
$35,842
58,871
93,777
129,793
155,722
167,113
179,580
185,490

Federal
Total
$4,458
7,496
17,423
27,065
27,820
30,443
34,346
35,323

Direct
$4,269
7,231
13,529
20,524
23,086
25,285
28,548
30,197

State
Intergovernmental
$189
265
3,894
6,541
4,734
5,158
5,798
5,126

Total

Direct

$11,602
20,157
33,755
46,444
58,165
63,372
65,508
66,114

$10,651
18,465
30,271
42,353
53,991
58,820
60,912
61,743

Local
Intergovernmental
$951
1,692
3,484
4,091
4,175
4,552
4,596
4,371

Total
$20,968
33,265
50,115
67,083
78,995
83,377
90,485
93,877

Direct
$20,922
33,175
49,977
66,916
78,644
83,007
90,120
93,550

Intergovernmental
$46
90
138
167
351
370
366
327

417.5%

692.4%

607.4%

2,612.2%

469.9%

479.7%

359.6%

347.7%

347.1%

610.9%

7.7%

9.9%

9.3%

16.2%

8.2%

8.3%

7.2%

7.1%

7.0%

9.3%

Note: Detail may not add to total because of rounding.
*Duplicative transactions between levels of government (intergovernmental transfers) are excluded from the total for all governments, the State total,
and the local total. These intergovernmental expenditures consist of payments from one government to another and are presented as a direct expenditure of a recipient government. See page 9 for further details.

2 Justice Expenditure and Employment in the United States, 2003

Revised 5/10/06, tld

Trends by function

Accounting for inflation

The average annual increase was highest for corrections,
ranging from a 9% increase by the local governments to
an 11% increase by the Federal Government.

The Consumer Price Index (CPI), reported by the Bureau
of Labor Statistics, is a commonly used measure of inflation.* According to the CPI, the average price level for all
urban consumers increased 184% between the base years
1982-84 and 2003; the annual average increase was
2.3%.

Among State and local governments police protection
experienced the lowest average annual increase; the
average annual increase was about 6.5%. The Federal
Government expenditure for police protection has
increased 10% annually.

To maintain consistency in reporting, the expenditure data
discussed in this Bulletin are not adjusted for inflation.
However, expenditure on all justice functions and among
all levels of government increased at a rate greater than
inflation. For example, if increases in total justice expenditure were limited to the rate of inflation (184%) after 1982,
expenditures in 2003 would have been approximately
$65.7 billion ($35.7B x 184%), as opposed to the actual
$185.5 billion.

The total direct justice expenditure for all levels of
government grew from $36 billion in 1982 to $185
billion in 2003, a 418% increase
Percent
growth,
1982-2003
418%

Expenditure in billions
$200

Justice expenditure relative to the Gross Domestic
Product (GDP)

$150

A common way to express the size and growth of government functions is the ratio of expenditure to the GDP or
"percent GDP."** In 2003, the ratio of justice expenditure to
GDP was $185 billion/$10,182 billion (1.8%). In 1982 the
percent GDP was 1.1%.

Total justice
$100

347%

Local

480%
$50

State

607%
Federal

$0
1982

1986

1990

*For more information about the Bureau of Labor Statistics website:
<http://www.bls.gov>.
**For more information about the GDP, see the Bureau of Economic
Analysis website: <http://www.bea.gov>.

1994 1998 2003

Note: Does not include indirect expenditures.
Figure 2

Table 2. Total direct and intergovernmental expenditure of Federal, State, and local governments
for each justice function, and percent change, fiscal years 1982-2003

Total
Expenditure
(in millions)
1982
1987
1992
1997
2000
2001
2002
2003
Percent change
1982-2003
Average annual
percent change,
1982-2003

Federal
Judicial
Police
and
protection legal

$4,458
7,496
17,423
27,065
27,820
30,443
34,346
35,323

$2,527
4,231
7,400
12,518
13,999
15,014
17,626
20,422

Corrections

$1,390
2,271
7,377
10,651
9,353
10,230
11,013
9,356

$541
994
2,646
3,896
4,467
5,199
5,707
5,545

Total

State
Judicial
Police
and
protection legal

$11,602
20,157
33,755
46,444
58,165
63,372
65,508
66,114

$2,833
4,067
5,593
7,501
9,787
10,497
11,081
11,144

Local
Corrections

$2,748
4,339
7,723
9,803
13,249
14,444
15,365
15,782

Total

Police
Judicial
Correcprotection and legal tions

$6,020 $20,968
11,691
33,265
20,439
50,115
29,141
67,083
35,129
78,995
38,432
83,377
39,062
90,485
39,187
93,877

$14,172
21,089
29,659
40,976
48,219
50,718
55,086
57,503

$3,784
6,230
10,052
13,101
14,842
15,938
17,042
17,718

$3,011
5,947
10,404
13,007
15,934
16,721
18,358
18,656

692.4%

708.2%

573.1%

925.0%

469.9%

293.4%

474.3%

550.9%

347.7%

305.8%

368.2%

519.6%

9.9%

10.0%

9.1%

11.2%

8.2%

6.4%

8.3%

8.9%

7.1%

6.6%

7.3%

8.6%

Note: Detail may not add to total because of rounding.
Sources for Federal Expenditure Data: 1982-96 Annual Finance Survey, U.S. Census Bureau. For 1997-99, detailed functional
tables, Budget Authority by Function, Category and Program. For 2000-03, historical tables, "Outlays by function and subfunction," Office of Management and Budget, Executive Office of the President.

Justice Expenditure and Employment in the United States, 2003

3

Revised 5/10/06, tld

Distribution of direct expenditure by
level of government and activity
Within each category of justice activity,
the distribution of expenditure by level
of government reflects the different
responsibilities of each level (table 3):
• Overall, police spending represented
45% of the Nation's total justice expenditure, and corrections accounted for
the second largest portion, 33%.
• Police protection is primarily a local
responsibility; accordingly, local governments spent 69% of the total police
protection expenditure in the country in
2003.
• Corrections is primarily a State
responsibility; as such State governments accounted for 61% of the
Nation's corrections expenditure.
• Judicial and legal services in the
United States were funded primarily by
local (42%) and State (36%) governments.

Table 3. Expenditure by level of government and justice activity, fiscal year 2003
Amounts (millions of dollars) spent fiscal year 2003
All
Federal
State
Local
governments government government government

Activity
Total justice system
Direct Expenditure
Intergovernmental

-$185,490
--

$35,323
30,197
5,126

$66,114
61,743
4,371

$93,877
93,550
327

Police protection
Direct Expenditure
Intergovernmental

-$83,089
--

$20,422
15,728
4,694

$11,144
9,860
1,284

$57,503
57,501
2

Judicial and legal
Direct Expenditure
Intergovernmental

-$41,545
--

$9,356
9,085
271

$15,782
14,945
837

$17,718
17,516
203

Corrections
Direct Expenditure
Intergovernmental

-$60,855
--

$5,545
5,384
161

$39,188
36,938
2,250

$18,656
18,533
123

Note: Detail may not add to total because of rounding. Local government data are estimates subject to sampling variability. The total figure for each justice activity, and for the total justice system,
exclude duplicative intergovernmental amounts. Artificial inflation would result if an intergovernmental expenditure of a government were tabulated and then counted again when the recipient
government(s) spent the amount. The intergovernmental expenditure lines are not totaled for the
same reason.
--Not applicable

Justice share of State and local expenditures
In 2003, 7.2% of total State and local expenditures
was for justice activities – 3% for police protection,
2.6% for corrections, and 1.5% for judicial and legal
services (figure 3).
By comparison, 29% of State and local government
spending went to education, 14% to public welfare,
7% to health care and hospitals, and 4% to interest
on debt.
From 1977 to 2003 total State and local expenditure
for all functions increased 567%:
• police protection — 545%
• corrections — 1,173%
• judicial and legal — 1,974%
Other government functions also increased during
the same period:
• education — 505%
• hospitals and health care — 572%
• interest on debt — 577%
• public welfare — 766%

was for police protection, much of
which was distributed through law
enforcement related grants.

The Federal Government spent the
most on intergovernmental
grants-in-aid, shared revenues, and
amounts paid to other governments for
services performed. Almost 92% of the
Federal intergovernmental expenditure

Percent of State and local direct expenditures
for selected functions, 1977-2003
40%

Education

30%

20%

Public welfare
10%

Health and hospitals

Criminal and civil
justice system

Interest on debt
0%
1977

1982

1987

1992

Natural resources,
parks, and recreation
1997

2003

Note: The government functions included will not sum to 100% of government
spending, because some functions were excluded for display purposes.
Figures may not match those from the Expenditure and Employment Extracts
because of definitional difference.
Source: Historical Finances, U.S. Census Bureau

Figure 3

4 Justice Expenditure and Employment in the United States, 2003

Revised 5/10/06, tld

Expenditure of State governments

Table 4. Per capita justice system expenditure of State governments, 2003

In 2003 total justice system expenditure of State governments increased
from $34 billion in 1993 to over $66
billion in 2003 — a 93% increase.

State

Total per capita justice expenditure of
all State governments was $227 (table
4). Alaska spent the most on justice
functions at $621 per U.S. resident,
followed by Delaware ($478) and Connecticut ($372). Mississippi and
Nevada spent the least per capita for
all justice functions at $150 and $147,
respectively.

Alaska
Delaware
Connecticut
Massachusetts
Wyoming
Maryland
Vermont
New Mexico
Virginia
Rhode Island
California
Hawaii
New Jersey
New York
Oregon
Kentucky
Pennsylvania
Wisconsin
Louisiana
Colorado
All States

Population (2003)

Total

Per capita

648,510
817,827
3,485,881
6,417,565
501,915
5,512,477
619,092
1,879,252
7,383,387
1,075,729

$402,981,000
391,138,000
1,295,675,000
2,195,841,000
166,963,000
1,779,373,000
185,909,000
550,994,000
2,151,666,000
304,930,000

$621
478
372
342
333
323
300
293
291
283

35,456,602
1,248,200
8,640,028
19,228,031
3,562,681
4,116,780
12,364,930
5,471,792
4,490,380
4,548,071

9,999,263,000
340,525,000
2,331,274,000
5,119,031,000
905,606,000
995,024,000
2,952,157,000
1,288,541,000
1,034,713,000
1,040,540,000

282
273
270
266
254
242
239
235
230
229

290,292,159

66,114,297,000

228

Michigan
Oklahoma
Montana
Kansas
Iowa
North Carolina
Utah
Ohio
Florida
Georgia

10,078,146
3,504,917
917,885
2,724,224
2,941,362
8,422,375
2,378,696
11,431,748
16,993,369
8,746,849

2,263,094,000
766,469,000
198,787,000
582,578,000
624,765,000
1,740,172,000
489,339,000
2,279,090,000
3,349,401,000
1,716,621,000

225
219
217
214
212
207
206
199
197
196

Maine
Arizona
Texas
Idaho
West Virginia
Arkansas
New Hampshire
Washington
Missouri
Minnesota

1,308,245
5,577,784
22,099,136
1,368,111
1,810,347
2,726,166
1,287,594
6,131,131
5,718,717
5,061,662

254,318,000
1,073,579,000
4,232,878,000
261,872,000
339,981,000
505,996,000
235,600,000
1,121,650,000
1,033,070,000
904,850,000

194
192
192
191
188
186
183
183
181
179

South Carolina
Nebraska
South Dakota
Illinois
Alabama
Tennessee
Indiana
North Dakota
Mississippi
Nevada

4,146,753
1,738,013
764,599
12,649,940
4,501,862
5,841,585
6,196,269
633,051
2,880,793
2,241,700

740,178,000
301,564,000
132,376,000
2,089,490,000
712,838,000
914,068,000
959,292,000
97,689,000
432,090,000
328,458,000

178
174
173
165
158
156
155
154
150
147

Note: Population figures are from the U.S. Census Bureau, Annual Population
Estimates 2000-2005.
Source: Criminal Justice Expenditure and Employment Extracts Program (CJEE),
table 9. <www.ojp.usdoj.gov/bjs/eande.htm>

Justice Expenditure and Employment in the United States, 2003

5

Revised 5/10/06, tld

Distribution of employment by level
of government and activity
In March 2003 the Nation=s civil and
criminal justice system employed over
2.3 million persons, with a total March
payroll of $9 billion (table 5). Relative
to the entire employed population in
2003, approximately 2% of the
Nation=s labor force worked in the justice system. (For more detailed information on the national labor force, see
<http://www.bls.gov/cps/cpsaat1.pdf>.)
Local governments accounted for
more justice employment than the Federal and State governments combined.
Of all the Nation=s justice employees,
58% were engaged in local justice
activities.

Throughout the justice system, an estimated 59% of total justice expenditures were for payroll.2
2This

figure was calculated by multiplying the
March 2003 payroll figure by 12 and dividing by
total justice expenditure.

Police protection was the activity with
the highest percentage of expenditure
going to payrolls (66%). In particular
70% of local government justice
expenditure went to police protection.
The activity with the lowest percentage
of payroll expenditure for all levels of
government was corrections at approximately 50%.

Local governments employed over 850,000 persons for police protection in
March 2003 and over half of all judicial and legal employees across all levels of
government
Federal

The State and local governments
employed almost 89% of all justice
system workers, while the Federal
Government employed the remaining
11%.
The distribution of corrections employment reflects State government dominance in that sector — 62% of
corrections employees worked for
State governments, followed by 33% at
the local level and 5% at the Federal
level (figure 4).

In 2003, the Federal Government
spent less on payrolls relative to total
expenditure ($15 billion out of 35 billion
or 43%) than did State and local governments (48% and 65% respectively).

As law enforcement is primarily the
responsibility of local governments,
77% of the Nation=s police employees
worked at the local level. The Federal
Government employed 14% of police
protection personnel while State governments employed the remaining
10%.

Corrections

State
Local

Judicial
and legal

Police protection
0

300,000
600,000
Number of employees

900,000

Figure 4

Table 5. Employment and monthly payroll of the justice system, by activity and level of government, March 2003
Activity
Total justice system
Total employees
2003 March payroll*
Police protection
Total employees
2003 March payroll*
Judicial and legal
Total employees
2003 March payroll*
Corrections
Total employees
2003 March payroll*

All governments

Federal

State

Local

Total

Percent distribution
Federal
State

Local

2,361,193
$9,041

253,367
$1,279

733,570
$2,639

1,374,256
$5,123

100%
100

10.7%
14.1

31.1%
29.2

58.2%
56.1

1,118,936
$4,545

156,607
$760

105,933
$438

856,396
$3,347

100%
100

14.0%
16.7

9.5%
9.6

76.5%
73.6

494,007
$1,969

61,984
$353

164,051
$682

267,972
$934

100%
100

12.5%
17.9

33.2%
34.6

54.2%
47.4

748,250
$2,526

34,776
$165

463,586
$1,519

249,888
$842

100%
100

4.6%
6.5

62.0%
60.1

33.4%
33.3

Note: Detail may not add to total because of rounding. These data are based on a summation of responses from individual State and local government agencies. Local government data are estimates subject to sampling variability, see Methodology for details. Refer to Bureau of Justice
Statistics Report, Federal Law Enforcement Officers, 2002 for detail of Federal employment <http://www.ojp.usdoj.gov/bjs/abstract/fleo02.htm>.
*Payroll is in millions.

6 Justice Expenditure and Employment in the United States, 2003

Revised 5/10/06, tld

Employment by State
In total, almost 13% of State and local employees
worked in the justice system (table 6). Nevada had the
highest percentage of justice employees relative to all
public employees (16.9%), followed by Florida (16.6%).

Table 6. State and local justice system employment and percent
of all public employment, by State, March 2003

The States with the lowest percentage of justice
employees were Vermont and North Dakota (both at
less than 8%).

Nevada
Florida
Arizona
District of Columbia
Delaware
New Jersey
New York
Maryland
Pennsylvania
Louisiana
Illinois
Missouri
Georgia
California
Massachusetts
Connecticut

92,655
806,682
261,492
44,271
45,947
489,448
1,193,262
287,513
569,356
279,087
641,248
311,972
484,515
1,805,446
320,372
176,369

15,687
133,772
40,583
6,870
73,934
6,926
176,622
39,577
78,232
37,861
86,279
41,803
64,637
238,806
42,151
22,626

16.9%
16.6
15.5
15.5
15.1
15.1
14.8
13.8
13.7
13.6
13.5
13.4
13.3
13.2
13.2
12.8

All State and local

15,760,451

2,002,706

12.7%

619,869
71,764
1,253,022
512,026
288,044
311,601
122,040
242,222
411,100
181,607
55,944
256,018
332,380
469,942
153,382
321,153
122,209
201,632
78,548
51,102
178,042
43,651
52,886
68,192
227,902
93,383
269,674
186,130
283,691
113,703
43,445
179,633
75,041
41,178
38,660

78,124
8,879
155,979
62,597
35,225
37,024
14,348
28,496
47,922
21,049
6,469
29,205
38,048
53,684
17,345
35,619
13,146
21,597
8,194
5,191
18,221
4,467
5,337
6,893
22,879
9,341
26,036
17,592
26,155
10,372
3,865
14,868
6,205
3,110
2,858

12.6%
12.4
12.4
12.2
12.2
11.9
11.8
11.8
11.7
11.6
11.6
11.4
11.4
11.4
11.3
11.1
10.8
10.7
10.4
10.2
10.2
10.2
10.1
10.1
10.0
10.0
9.7
9.5
9.2
9.1
8.9
8.3
8.3
7.6
7.4

Expansion of the Nation’s justice system
1982-2003
The increase in justice expenditures over nearly 20
years reflects the expansion of the Nation=s justice
system. For example, in 1982 the justice system
employed approximately 1.27 million persons; in
2003 it reached over 2.3 million.

Police protection
One indicator of police workload, the FBI’s arrest
estimates for State and local police agencies, grew
from 12 million in 1982 to an estimated 13.6 million
in 2003.* The number of employees in police
protection increased from approximately 724,000 to
over 1.1 million.

Judicial and legal
The judicial and legal workload, including civil and
criminal cases, prosecutor functions, and public
defender services, also expanded during this
period. Cases of all kinds (criminal, civil, domestic,
juvenile, and traffic) filed in the nearly 16,000
general and limited jurisdiction State courts went
from about 86 million to 100 million in the 16-year
period, 1987-2003.** The total of judicial and legal
employees grew about 101% to over 494,000
persons in 2003.

Corrections
The total number of State and Federal inmates
grew from 403,000 in 1982 to over 1.4 million in
2003. The number of local jail inmates more than
tripled from approximately 207,000 in 1982 to over
691,000 in 2003. Adults on probation increased
from over 1.4 million to about 4.1 million persons.***
Overall, corrections employment more than
doubled from nearly 300,000 to over 748,000
during this same period.
*

Crime in the United States, 1982 (FBI, 1983) and 2003 (FBI,
2004), <http://www.fbi.gov/ucr/cius_03/pdf/toc03.pdf>.
**Examining the Work of State Courts, 2003: A National Perspective from the Court Statistics Project, National Center for State
Courts,
<http://www.ncsconline.org/D_Research/csp/2003_Files/
2003_Main_Page.html>.
***Sourcebook of Criminal Justice Statistics, 2003 (table 6.1.2004),
<http://www.albany.edu/sourcebook/pdf/t612004.pdf>.

State

Ohio
Hawaii
Texas
Michigan
Wisconsin
Tennessee
New Mexico
South Carolina
Virginia
Oregon
Rhode Island
Colorado
Indiana
North Carolina
Arkansas
Washington
Utah
Oklahoma
Idaho
Alaska
Kansas
Wyoming
Montana
New Hampshire
Kentucky
West Virginia
Alabama
Mississippi
Minnesota
Nebraska
South Dakota
Iowa
Maine
North Dakota
Vermont

Full-time equivalent employment
All State and
State and local Justice as a
local public
justice
percent of total

Note: These data are based on a summation of responses from individual
State and local government agencies. Local government data are estimates
subject to sampling variability. See Methodology for details.
Source: Annual Survey of Government Employment, U.S. Census Bureau,
March (2003).

Justice Expenditure and Employment in the United States, 2003

7

California had the most State and local
employees (1.8 million) as well as the
largest number of employees in the
justice system (247,110).3 Vermont
was the State with the fewest justice
employees in State and local government (slightly over 3,000) and for all
functions (approximately 39,000).
In March 2003 the number of full-time
equivalent (FTE) State and local government justice system employees
was just over 2 million (table 7). Almost
45% of all FTE justice system State
and local employees worked in police
protection; 35% were employed in corrections, while the remaining 20%
were in judicial and legal jobs.
The District of Columbia had the largest percentage of FTE State and local
justice system employees working in
police protection at 63%. Massachusetts and Rhode Island followed at
56% and 54%, respectively. At 37%,
Delaware had the smallest percentage
of employees working in police protection.
In corrections, Texas had the largest
percentage of FTE State and local justice system employees at 46%. Virginia and North Carolina followed at
44% and 43%, respectively.
3Source

for these data is the Criminal Justice
Expenditure and Employment Extracts Program
(CJEE), table 5. <www.ojp.usdoj.gov/bjs/
eande.htm>.

Table 7. Justice system employment and percent distribution of full-time
equivalent employment, by State and local government and activities,
March 2003.

State
Total
California
New York
Texas
Florida
Illinois
Pennsylvania
Ohio
New Jersey
Georgia
Michigan
North Carolina
Virginia
Massachusetts
Missouri
Arizona
Maryland
Indiana
Louisiana
Tennessee
Washington
Wisconsin
Colorado
South Carolina
Minnesota
Alabama
Kentucky
Connecticut
Oklahoma
Oregon
Kansas
Mississippi
Arkansas
Nevada
Iowa
New Mexico
Utah
Nebraska
West Virginia
Hawaii
Idaho
Delaware
New Hampshire
District of Columbia
Rhode Island
Maine
Montana
Alaska
Wyoming
South Dakota
North Dakota
Vermont

Total justice
system
2,002,706
238,806
176,622
155,979
133,772
86,279
78,232
78,124
73,934
64,637
62,597
53,684
47,922
42,151
41,803
40,583
39,577
38,048
37,861
37,024
35,619
35,225
29,205
28,496
26,155
26,036
22,879
22,626
21,597
21,049
18,221
17,592
17,345
15,687
14,868
14,348
13,146
10,372
9,341
8,879
8,194
6,926
6,893
6,870
6,469
6,205
5,337
5,191
4,467
3,865
3,110
2,858

Full-time equivalent employees*
Percent distribution
Police
Judicial and
protection
legal
Corrections
44.7%

20.4%

35.0%

42.6
49.0
38.8
44.7
53.2
40.6
42.3
48.0
39.4
41.6
44.2
41.0
55.6
45.2
43.1
43.2
45.2
43.5
48.7
40.2
46.3
45.5
48.9
43.8
51.0
42.6
45.8
49.0
39.3
47.3
51.0
45.9
44.4
48.7
39.2
42.6
46.1
40.3
41.0
45.0
36.9
53.2
63.0
53.6
50.0
43.4
39.4
48.3
45.5
45.6
43.2

22.8
17.3
15.7
24.0
19.8
22.5
25.6
29.2
18.4
19.5
12.4
15.4
21.9
19.5
22.5
18.6
19.2
20.0
16.4
21.6
17.0
20.1
13.9
24.0
19.5
27.2
20.9
19.2
21.3
19.6
15.0
18.8
20.7
21.3
21.0
20.6
17.5
24.3
31.9
19.9
22.8
18.1
21.7
19.4
16.4
24.5
25.3
19.3
20.9
24.8
22.3

34.6
33.7
45.5
31.3
27.0
36.8
32.1
22.8
42.2
38.9
43.4
43.6
22.6
35.3
34.4
38.2
35.6
36.4
34.9
38.2
36.7
34.4
37.3
32.2
29.5
30.2
33.2
31.7
39.4
33.0
34.0
35.3
34.9
30.0
39.7
36.8
36.4
35.4
27.1
35.1
40.3
28.7
15.3
27.1
33.6
32.1
35.3
32.4
33.6
29.6
34.4

Notes: Local government data are estimates subject to variability.
*Justice system employment of independent school districts and special school districts
(primarily for special police) are not available.

8 Justice Expenditure and Employment in the United States, 2003

Revised 5/10/06, tld

Appendix table. Direct and per capita justice expenditure across government and by function, selected years, 1982-2003

Year

Population

2003
2002
1997
1992
1987
1982

290,850,000
287,985,000
267,784,000
245,807,000
243,400,000
226,548,000

Justice expenditure
across government
and function
Total
(in millions) Per capita
$185,490
179,580
129,793
93,777
58,871
35,842

$638
624
485
382
242
158

Police protection
Judicial and legal
expenditure
expenditure
Corrections expenditure
Total
Total
Total
(in millions) Per capita (in millions) Per capita (in millions)
Per capita
$83,089
79,540
57,754
41,327
28,778
19,022

$286
276
216
168
118
84

$41,545
40,431
28,529
20,989
12,555
7,771

$143
140
107
85
52
34

$60,855
59,609
43,511
31,461
17,549
9,049

$209
207
162
128
72
40

Note: Using the Consumer Price Index (CPI) to adjust the 2003 per capita figure of $638 for inflation would yield approximately $335 in 1982 dollars.
For more information on the CPI see the Bureau of Labor Statistics website <www.bls.gov>. Population figures are from the U.S. Census Bureau,
Annual Population Estimates 2000-2005.

Definition of terms

Expenditure includes only external
cash payments made from any source
of funds, including any payments
financed from borrowing, fund balances, intergovernmental revenue,
and other current revenue. It excludes
any intragovernmental transfers and
noncash transactions, such as the provision of meals or housing of employees. It also excludes retirement of
debt, investment in securities, extensions of loans, or agency transactions.
Total expenditures for all government
functions do include interest payments
on debt, but the justice expenditure
data do not.
Expenditures two major categories —
• Direct expenditure is all expenditure
except that classified as intergovernmental. It includes "direct current
expenditure" (salaries, wages, fees,

and commissions and purchases of
supplies, materials, and contractual
services) and "capital outlays"
(construction and purchase of
equipment, land, and existing
structures). Capital outlays are
included for the year when the direct
expenditure is made, regardless of
how the funds are raised (for example,
by bond issue) or when they are paid
back.
• Intergovernmental expenditure is the
sum of payments from one government to another, including grantsin-aid, shared revenues, payments in
lieu of taxes, and amounts for services
performed by one government for
another on a reimbursable or
cost-sharing basis (for example, payments by one government to another
for boarding prisoners). It excludes
amounts paid to other governments for
purchase of commodities, property, or
utility services.

Components of total expenditure
The expenditure data discussed in this Bulletin include direct expenditure and
intergovernmental expenditure. Intergovernmental expenditure is the sum of
payments from one government to another, including grants-in-aid, shared revenues, and amounts for services performed by one government for another on
a reimbursable or cost-sharing basis.
The three levels of government in the United States (Federal, State, and local)
have varying responsibilities for justice activities, and funds are often passed
between governments to reflect these responsibilities. For example, Federal
intergovernmental expenditures include grants to States, and State direct
expenditures will include those grants.

Employees are all persons on
government payrolls during the pay
period including March 15, 2003. They
include all paid officials and persons on
paid leave, but exclude unpaid
officials, persons on unpaid leave,
pensioners, and contractors.
Full-time employees are all persons
employed on a full-time basis,
including all full-time temporary or
seasonal workers who were employed
during this pay period.
Full-time equivalent employment (FTE)
is a statistical measure that estimates
the number of full-time employees that
could have been employed if the
reported number of hours worked by
part-time employees had been worked
by full-time employees. This statistic is
calculated separately for each function
of a government by dividing the
"part-time hours paid" by the standard
number of hours for full-time
employees in the particular
government and then adding the
resulting quotient to the number of
full-time employees.
Payroll is the gross 1-month payroll
before deductions and includes
salaries, wages, fees, and
commissions paid to employees as
defined above for March 2003.

To avoid double counting the sum of Federal, State, and local intergovernmental expenditures, the direct expenditure is used to calculate total expenditure
for all governments. For 2003, the total direct expenditure for all governments
was over $185 billion.

Justice Expenditure and Employment in the United States, 2003

9

Police protection is the function of
enforcing the law, preserving order,
and apprehending those who violate
the law, whether these activities are
performed by a city police department,
sheriff's department, State police, or
Federal law enforcement agency such
as the Federal Bureau of Investigation
or the Drug Enforcement
Administration. Private security police
are outside the scope of the survey.
Judicial and legal services include all
civil and criminal courts and activities
associated with courts such as law
libraries, grand juries, petit juries,
medical and social service activities,
court reporters, judicial councils,
bailiffs, and probate functions. It also
includes the civil and criminal justice
activities of the attorneys general,
district attorneys, State's attorneys,
and their variously named equivalents
and corporation counsels, solicitors,
and legal departments with various
names. It excludes legal units of
noncriminal justice agencies, whose
functions may be performed by a legal
services department in other
jurisdictions (such as a county
counsel).
Corrections involves the community
supervision, confinement, and
rehabilitation of adults and juveniles
convicted of offenses against the law
and the confinement of persons
suspected of a crime awaiting trial or
adjudication. It includes the costs of
operation and employment for jails,
prisons, probation, parole, pardon, and
correctional administration. Data for
institutions with authority to hold
prisoners beyond arraignment (usually
48 hours or more) are included in this
sector. Data for lockups or "tanks"
holding prisoners less than 48 hours
are included in "police protection."

10

Methodology
The justice data in this report include
the expenditures and employment of
the Federal Government, the State
governments, and a sample of county,
municipal, and township governments.
Unless otherwise noted, data for total
governmental functions and non-justice governmental functions also
include the expenditures of special districts and school districts, which generally do not have justice functions.
This report is based on a compilation
of data from the U.S. Census Bureau’s
annual surveys of governmental
finances and employment. The survey
sample was selected from the 1997
Census of Local Governments and
consists of large units of government
(including all 50 States) sampled with
certainty and smaller units selected
with a probability proportional to the
unit’s expenditure. The total number of
local governments in the finance sample was 7,002, and the number of local
governments in the employment sample was 10,574.
Certain limitations reflect the fact that
the surveys from which this Bulletin
was extracted are not designed to
obtain data on specific justice functions. The sampling variability, or standard error, for each of the justice
activities is likely to be larger than for
the major categories that the surveys
were designed to estimate. Similarly,
the standard error is likely to be greater
for local governments than for
State-local aggregates which are sampled in part with certainty. Specific
standard errors can be found on the
Census Bureau’s website (<http://
www. census.gov>).
Differences in functional responsibilities from State to State and government to government can affect the
comparability of expenditure and
employment data. Readers should be
generally cautious in comparing governmental expenditures because of
this variation in the division of responsibilities.

Justice Expenditure and Employment in the United States, 2003

The data in this report differ in some
cases from those previously published
in the Census Bureau=s finance and
employment survey reports because of
definitional differences and the more
intensive review procedures and data
refinements used for this compilation.
Data on State and local justice system
per capita expenditure by State and
activity were not collected in 2003.
These data are available for 2002.
The data here differ from other BJS
series which collect agency-based
employment and expenditure data
because of collection methods, units of
analysis, and data collection purposes.
These include —

Law Enforcement Management and
Administrative Statistics, Prosecutors
in State Courts and various court statistics series, The Census of Local
Jails, 1999, The Census of State and
Federal Correctional Facilities, 2000,
and the report State Prison Expenditures, 2001.
Financial data for the Federal Government were extracted from The Budget
of the United States Government, FY
2003, Appendix. The historical finance
data may differ slightly from the justice
expenditure data found in the Expenditure and Employment Extracts
because of definitional differences.
Federal Government civilian employment data were obtained from the U.S.
Office of Personnel Management. Statistics for State and local governments
were obtained by a mail survey including all State departments, agencies,
and institutions, and a local central
reporting office supplemented by special mailings.

Trend comparisons between the data
in this report and reports covering data
for 1971-79, 1985, 1988, 1990, and
1997 from the Justice Assistance Data
Survey (JADS) are complicated by differences in methodology. These differences are described in the BJS reports
for these years, and on the BJS website. In making trend comparisons,
users should limit their analysis to one
of the two sources:
• long-term trends for 1971-79, 1985,
1988,1990, and 1997 from the JADS
• recent year-to-year trends from the
1980-2001 Justice Expenditure and
Employment Extracts data.
A more detailed description of the survey methodology (including sample
design and sampling errors) can be
found in the Justice Expenditure and
Employment Extracts at <http://www.
ojp.usdoj.gov/bjs>.

This report is available in portable
document format and in ASCII.
Its related statistical data and tables
are available at the BJS World Wide
Web Internet site: <http://
www.ojp.usdoj.gov/bjs/>
The data from the Justice
Expenditure and Employment
Extracts are available from the
National Archive of Criminal Justice
Data, maintained by the Interuniversity Consortium for Political
and Social Research at the University
of Michigan, 1-800-999-0960. The
archive may also be accessed
through the BJS Internet site.

Office of Justice Programs
Partnerships for Safer Communities
http://www.ojp.usdoj.gov

The Bureau of Justice Statistics is
the statistical agency of the U.S.
Department of Justice. Jeffrey L.
Sedgwick is director.
BJS Bulletins present the first
release of findings from permanent
data collection programs.
Kristen Hughes wrote this report
under the supervision of Steven K.
Smith. Mark Motivans and Steven
D. Owens provided statistical
review. Tina Dorsey and Marianne
W. Zawitz produced and edited the
report. Jayne Robinson prepared
the report for final printing.
The data extraction, editing, and
tabulation for the 2002 and 2003
Justice Expenditure and
Employment Extracts were
performed at the U.S. Census
Bureau by Steven D. Owens.
April 2006, NCJ 212260

Justice Expenditure and Employment in the United States, 2003

11

U.S. Department of Justice
Office of Justice Programs
Bureau of Justice Statistics

*NCJ~212260*

Washington, DC 20531

Official Business
Penalty for Private Use $300

12

Justice Expenditure and Employment in the United States, 2003

PRESORTED STANDARD
POSTAGE & FEES PAID
DOJ/BJS
Permit No. G-91

