

Bojs Hispanic Victims of Violent Crimes 2000
Download original document:
Document text
Document text
This text is machine-read, and may contain errors. Check the original document to verify accuracy.
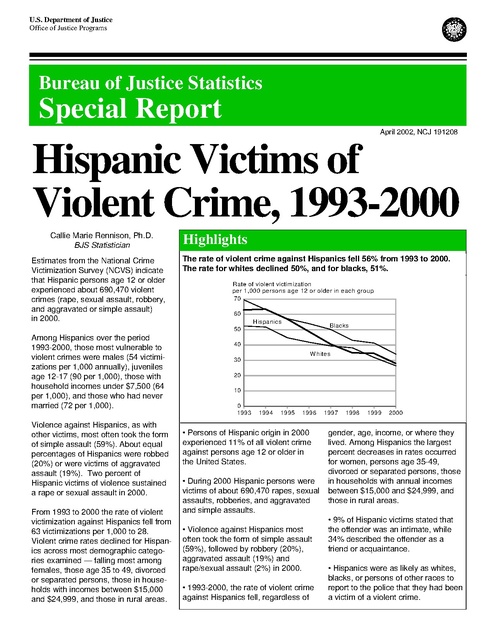
U.S. Department of Justice
Office of Justice Programs

Bureau of Justice Statistics

Special Report
April 2002, NCJ 191208

Hispanic Victims of
Violent Crime, 1993-2000
Callie Marie Rennison, Ph.D.
BJS Statistician
Estimates from the National Crime
Victimization Survey (NCVS) indicate
that Hispanic persons age 12 or older
experienced about 690,470 violent
crimes (rape, sexual assault, robbery,
and aggravated or simple assault)
in 2000.

Highlights
The rate of violent crime against Hispanics fell 56% from 1993 to 2000.
The rate for whites declined 50%, and for blacks, 51%.
Rate of violent victim ization
per 1,000 persons age 12 or older in each group
70
60

Hispanics

Blacks

50

Among Hispanics over the period
1993-2000, those most vulnerable to
violent crimes were males (54 victimizations per 1,000 annually), juveniles
age 12-17 (90 per 1,000), those with
household incomes under $7,500 (64
per 1,000), and those who had never
married (72 per 1,000).
Violence against Hispanics, as with
other victims, most often took the form
of simple assault (59%). About equal
percentages of Hispanics were robbed
(20%) or were victims of aggravated
assault (19%). Two percent of
Hispanic victims of violence sustained
a rape or sexual assault in 2000.
From 1993 to 2000 the rate of violent
victimization against Hispanics fell from
63 victimizations per 1,000 to 28.
Violent crime rates declined for Hispanics across most demographic categories examined — falling most among
females, those age 35 to 49, divorced
or separated persons, those in households with incomes between $15,000
and $24,999, and those in rural areas.

40

W hites
30
20
10
0
1993

1994

1995

1996

• Persons of Hispanic origin in 2000
experienced 11% of all violent crime
against persons age 12 or older in
the United States.
• During 2000 Hispanic persons were
victims of about 690,470 rapes, sexual
assaults, robberies, and aggravated
and simple assaults.
• Violence against Hispanics most
often took the form of simple assault
(59%), followed by robbery (20%),
aggravated assault (19%) and
rape/sexual assault (2%) in 2000.
• 1993-2000, the rate of violent crime
against Hispanics fell, regardless of

1997

1998

1999

2000

gender, age, income, or where they
lived. Among Hispanics the largest
percent decreases in rates occurred
for women, persons age 35-49,
divorced or separated persons, those
in households with annual incomes
between $15,000 and $24,999, and
those in rural areas.
• 9% of Hispanic victims stated that
the offender was an intimate, while
34% described the offender as a
friend or acquaintance.
• Hispanics were as likely as whites,
blacks, or persons of other races to
report to the police that they had been
a victim of a violent crime.

Data and definitions
Estimates of violent crime are drawn
from National Criminal Victimization
Survey (NCVS) data collected by the
Bureau of Justice Statistics (BJS).
Respondents to the NCVS who identified themselves as Mexican-American,
Chicano, Mexican, Puerto Rican,
Cuban, Central or South American
(Spanish-speaking countries) or other
Spanish origin are defined as Hispanics in this report. The category
"Hispanic" includes persons of any
race. Comparison groups include
non-Hispanic persons who were white,
black, American Indian, or Asian.
Thus, in this report the terms "white,"
"black," "American Indian," and "Asian"
refer only to non-Hispanic persons.
Violent acts examined include threatened, attempted and completed rape,
sexual assault, robbery, aggravated
assault, and simple assault. Only
limited homicide data are available.

The National Crime Victimization
Survey
The NCVS is the Nation's primary
source of information on the
frequency, characteristics, and
consequences of criminal victimization. One of the largest continuous
household surveys conducted by the
Federal Government, the NCVS
collects information about crimes
both reported and not reported to
police. The survey provides the
largest national forum for victims to
describe their experiences of victimization, the impact of crime, and the
characteristics of violent offenders.
For the most current overall
estimates of criminal victimization in
the United States, see Criminal
Victimization 2000: Changes 19992000, with Trends 1993-2000 (NCJ
187007).
Findings from the NCVS are also
on the BJS website <www.ojp.usdoj.
gov/bjs/>

Table 1. Number and rate of violent victimization, by type of crime,
race, and Hispanic origin, 2000

Number of
victimizations
Total violent crime
Rape/sexual assault
Robbery
Aggravated assault
Simple assault
Rate of victimizations
per 1,000 in each group
Total violent crime
Rape/sexual assault
Robbery
Aggravated assault
Simple assault

Hispanic

White

690,470
13,810
140,450
131,150
405,060

4,363,350
183,180
400,290
871,900
2,907,980

27.9
0.6
5.7
5.3
16.4

26.5
1.1
2.4
5.3
17.7

Non-Hispanic
American
Black Indian

929,860
39,760
176,810
164,480
548,800

34.1
1.5
6.5
6.0
20.1

Asian

50,970
7,540
2,510
15,880
25,050

68,880
1,990
15,300
7,680
43,910

52.3
7.7
2.6
16.3
25.7

8.4
0.2
1.9
0.9
5.4

Note: Detail may not add to total because of rounding.

Violence against Hispanics, 2000
During 2000 persons of Hispanic origin
experienced 11% of all violent crime
against persons age 12 or older in the
United States, and they were about
10% of the general population. In total
during 2000, Hispanic persons were
victims of about 690,470 rapes, sexual
assaults, robberies, and aggravated
and simple assaults. As a rate, there
were 28 violent victimizations per 1,000
persons of Hispanic ethnicity (table 1).
As with other victims, most violence
against Hispanic persons was simple
assault (59%), an offense committed
without a weapon and resulting in, at
most, minor injury. Twenty percent of
Hispanic victims were robbed, and
19% were victims of an aggravated
assault, an offense committed with a
weapon or resulting in serious injury or

both. Rapes and sexual assaults
accounted for 2% of all violence
against persons of Hispanic origin.
During 2000 Hispanics were victims of
rape and sexual assault at rates lower
than those for whites, blacks, and
American Indians. The Hispanic rates
of rape and sexual assault were similar
to those of Asians.
Hispanics and blacks were robbed at
similar rates, and those rates were the
highest of the groups examined. In
2000 the robbery rate was 6 victimizations per 1,000 Hispanics.
Hispanics were victims of aggravated
assault at a rate similar to those for
whites and blacks. American Indians
experienced aggravated assault at the
highest rate, and Asians experienced
aggravated assault at the lowest rate
during 2000.

Hispanic homicide victims
The Uniform Crime Reporting Program (UCR) of the FBI collects information
about homicide from local and State law enforcement agencies. Many jurisdictions do not obtain information on the Hispanic origin of the victim, so that
national UCR data on Hispanic homicide victims are not available.
The National Vital Statistics System (NVSS), maintained by the National
Center for Health Statistics of the Centers for Disease Control and Prevention,
collects information on homicides of Hispanics from death certificates filed in
State vital statistics offices.
Between 1993 and 1999 (the year of most recent data) the NVSS recorded
an annual average of 409 Hispanics being killed — a rate of 12.6 homicides
per 100,000 Hispanics. The national homicide rate was 8.9 per 100,000.

2 Hispanic Victims of Violent Crime, 1993-2000

Whites, blacks, and Hispanics were
victims of simple assault at similar
rates during 2000. Simple assaults
were experienced by American Indians
at the highest rate, and by Asians at
the lowest during 2000.
Victim characteristics, 1993-2000
Though all persons are vulnerable to
violent crime, data demonstrate that
some groups are victimized at different
rates. For example, for the various
demographic characteristics, Hispanics
were generally victims of crime at rates
higher than those of Asians but lower
than those of American Indians (table
2).* Rates also varied among Hispanics in different demographic categories.
Gender
As within the racial groups, Hispanic
males experienced violent crime at a
rate higher than that for Hispanic
females. Among males, Hispanics
were victims of violent crime at a rate
greater than that for whites, but similar
to that for blacks. Among females,
Hispanics were violently victimized at a
rate similar to that for whites but at a
rate lower than that for blacks.
Age
For Hispanics, 1993-2000, the young
were more likely than older persons
to be victims of violent crime:
90 per 1,000 Hispanics age 12 to 17,
70 per 1,000 Hispanics age 18 to 24,
7 per 1,000 Hispanics age 65 or older
were victims of violent crime each year.
During the period, among persons age
18 to 49, Hispanics were victims of
violence at rates lower than those for
whites and blacks. Among persons
age 12-17 and 50 or older, Hispanics
were victimized at rates similar to those
for blacks.
*Because of the consistent patterns of relative
rates of victimization compared to Hispanics,
American Indians and Asians are not discussed
in this section of the report, although their rates
are presented in the tables. For more information, see Violent Victimization and Race, 199398, NCJ 176354, and American Indians and
Crime, NCJ 173386.

Table 2. Rates of violent crime, by Hispanic origin, race, gender, age,
marital status, annual household income, and residence, 1993-2000

Characteristic
of victim
Total

Average annual victimization rate
per 1,000 persons age 12 or older
Non-Hispanic
American
Hispanic White
Black Indian
Asian
44.8
40.8
51.2
105.0
21.7

Gender
Male
Female

53.9
36.0

48.0
34.0

56.6
46.7

125.6
86.4

28.6
15.2

Age
12 to 17
18 to 24
25 to 34
35 to 49
50 to 64
65 or older

90.1
70.3
39.5
28.5
14.2
7.1

98.0
89.7
53.0
34.3
15.9
4.1

99.9
91.3
52.9
39.2
15.6
7.6

159.1
153.0
167.2
62.4
42.1
22.8

43.6
36.2
22.7
16.4
8.5
3.5

Marital status
Never married
Married
Widowed
Divorced/separated

72.3
22.8
10.4
56.3

80.8
20.1
7.9
69.1

76.5
22.0
11.5
54.3

143.7
56.0
39.3
147.5

35.0
11.9
6.6
49.8

Annual household income
Less than $7,500
$7,500 to $14,999
$15,000 to $24,999
$25,000 to $34,999
$35,000 to $49,999
$50,000 to $74,999
$75,000 or more

64.2
49.6
42.0
40.9
39.1
48.3
46.7

83.3
51.2
45.1
44.8
40.7
37.7
30.0

72.4
61.7
53.8
46.6
42.0
41.8
51.9

152.1
144.1
62.0
95.0
122.2
36.1
49.7

28.8
30.5
22.9
23.6
15.8
18.2
17.1

Location of residence
Urban
Suburban
Rural

46.6
43.6
41.2

55.0
39.2
31.1

60.8
45.3
28.2

121.3
103.7
70.8

22.7
21.1
17.9

*Based on 10 or fewer sample cases. See Methodology, page 7.

Marital status

Annual household income

From 1993 through 2000 never
married, married, widowed, and
divorced/separated Hispanics experienced violence at different rates. For
Hispanics, as for members of the racial
groups examined, persons who had
never married or those who were
divorced or separated were the most
vulnerable to violent crime.

For Hispanics, persons in households
with an annual income of less than
$7,500 were more likely to be victimized than persons in households at all
higher levels of income except one.
Only a marginal difference between
rates of violent victimization separated
persons in households with an annual
income of less than $7,500 from those
with an average annual income $7,500
to $14,999.

Among persons who had never
married and those who were divorced
or separated, Hispanics were victimized at a rate lower than that for whites
and at a rate similar to that for blacks.
Among married persons, Hispanics
were victimized at a rate similar to that
for blacks and at a rate higher than that
for whites. No differences in rates
of violence among widowed persons
emerged.

While at some levels of income the
rates of violent victimization of Hispanics were different from those of whites
and blacks, a consistent pattern of
difference was not present.

Hispanic Victims of Violent Crime, 1993-2000

3

Location of residence
Hispanics in urban, suburban, and rural
areas were violently victimized at
statistically similar rates between 1993
and 2000.
Hispanics were victimized in urban
areas at a rate lower than those for
blacks and whites. In suburban
settings, Hispanics were victims of
violent crimes at a rate higher than that
for whites but lower than that for
blacks. In rural areas Hispanics
sustained violent victimizations at a
rate higher than those for whites and
blacks.
Characteristics of the crime event,
1993-2000
Victim-offender relationship
The percentages of Hispanic victims
of violence who were victimized by an
intimate partner (9%) or some other
relative (4%) were similar to those of
the non-Hispanic groups examined,
1993-2000 (table 3).
A smaller percentage of violent victimization of Hispanics than of whites was
committed by friends or acquaintances.
Apparent differences in the percentages of violent crimes by friends or
acquaintances — between Hispanics
and blacks, American Indians, or
Asians — were not statistically significant. Of victims of violence, a smaller
percentage of Hispanics than of whites
stated they were victimized by a
relative who was not a spouse.
Fifty-two percent of Hispanic victims of
violence identified the offender as a
stranger. A higher percentage of Asian
victims (64%) and a lower percentage
of white victims (46%) did the same.
Presence of weapons
Between 1993 and 2000, 34% of
Hispanic victims of violence reported
that the offender had a weapon during
their victimization (table 4). The
percentage of Hispanics who faced an
armed offender was greater than the
percentage of whites (23%), but similar

Table 3. Relationship of victim to violent offender, by race
and Hispanic origin of the victim, 1993-2000

Victim-offender
relationship
Total
Intimate*
Other relative
Friend/acquaintance
Stranger

Percent of violent victimizations
Non-Hispanic
American
White
Black
Indian
100 %
100%
100%
11
12
12
5
6
6
38
38
38
46
45
44

Hispanic
100%
9
4
34
52

Average annual number 942,360

6,631,250

1,318,130

Asian
100%
3
2
30
64

105,690

155,700

Note: Detail may not add to total because of rounding.
*Intimates include current or former spouses, boyfriends, or girlfriends.

Table 4. Presence and type of weapons, by race
and Hispanic origin of the victim, 1993-2000

Presence and
type of weapon

Hispanic

Total
No weapon
Unknown if weapon was present
Weapon

100 %
59
8
34

Firearm
Knife
Other weapon
Don't know type of weapon
Average annual number

Percent of victims of violent crimes
Non-Hispanic
American
White
Black
Indian
100 %
54
10
36

100 %
66
7
26

100 %
57
10
32

7
6
9
1

17
8
9
1

11
5
13
1*

8
8
9
1*

14
8
10
1
942,360

Asian

100 %
69
8
23

6,631,250

1,318,130

105,690

155,700

Note: Detail may not add to total because of rounding.
*Based on 10 or fewer sample cases. See Methodology, page 7.

Table 5. Injury from crime and treatment of that injury, by race
and Hispanic origin of the victim, 1993-2000

Injury
and type of treatment
Total
Not injured
Injured
Not treated
Don't know if treated
Treated
At scene/home
Doctor's office/clinic
Hospital but not admitted
Treated other locale
Admitted to hospital
Average annual number

Hispanic

Percent of victims of violent crimes
Non-Hispanic
American
White
Black
Indian

100 %
73
27
15
0
12
5
1
4
0*
1
942,360

Asian

100 %
75
25

100 %
71
29

100 %
64
36

100 %
77
23

15
0*
10

13
0
16

16
0
20

12
0
11

4
1
4
0
0

6
2
7
0*
1

6,631,250

1,318,130

8
2*
8
0*
1*
105,690

4
1*
5
0*
0*
155,700

Note: Detail may not add to total because of rounding.
*Based on 10 or fewer sample cases. See Methodology, page 7.

to the percentages among the other
racial groups.
A firearm was present in 14% of the
violent victimizations of Hispanics.

4 Hispanic Victims of Violent Crime, 1993-2000

This percentage exceeded 7% of white
victims but did not differ statistically
from the percentages of black, American Indian, and Asian victims facing
an offender armed with a firearm.

Injuries and treatment
Between 1993 and 2000, 73% of
Hispanic victims of violence were not
injured (table 5). Similar percentages
of victims who were white, black, or
Asian were not injured (75%, 71%, and
77%, respectively). A somewhat lower
percentage of American Indian victims
(64%) escaped injury.

Table 6. Victim's perception of the violent offender's use of drugs
or alcohol, by race and Hispanic origin of the victim, 1993-2000

Annual average number

Among the Hispanics injured during a
violent crime, 15% did not seek
medical treatment for their injuries.
This response was similar to that of
whites (15%), blacks (13%), American
Indians (16%), and Asians (12%).

Percent of violent victimizations
Non-Hispanic
American
White
Black
Indian
100 %
100 %
100 %
32
24
44
29
29
19
39
47
37

Victim's perception
of drug or alcohol
use by the offender
Hispanic
Total
100 %
Using alcohol or drugs
28
Not using alcohol or drugs
28
Don't know
44
927,410

6,553,650

Total
Yes
No
Don't know
Average annual number

Hispanic
100 %
44
55
1*

152,920

influence of drugs or alcohol at the time Violence sustained by Hispanics at
different income levels was reported
of the incident.
to the police at similar percentages.
Reporting to police
The percentages of violent victimizations that were reported to the police
between 1993 and 2000 were similar
for Hispanics and members of nonHispanic racial groups (table 7). Fortyfour percent of all violence against
Hispanic individuals was reported to
the police; this compares to 39% for
Asian victims, 42% for whites, 45% for
American Indians, and 48% for blacks.
Among Hispanics, violence against
those who were male, under age 20,
or never married was reported at
percentages lower than violence
against other Hispanic subgroups
(table 8).

Table 7. Reporting of violence to the police, by race
and Hispanic origin of the victim, 1993-2000

Reported violence
to police

105,410

Note: The annual average numbers differ from those in other tables because sample
cases in which the respondent did not provide an answer were excluded.

Alcohol and/or drug use of offender
Twenty-eight percent of Hispanic
victims of violent crime perceived the
offender to be under the influence of
drugs and/or alcohol, 1993-2000 (table
6). Higher percentages of whites
(32%) and American Indians (44%)
reported such drug or alcohol use.
Compared to Hispanic victims, a
slightly lower percentage of blacks and
a lower percentage of Asians stated
that the offender acted under the influence of drugs or alcohol. A large
percentage of victims in each racial/
ethnic category state that they did not
know if the offender was under the

1,303,740

Asian
100 %
19
26
55

Percent of victims of violent crimes
Non-Hispanic
American
White
Black
Indian

Asian

100 %
42
56
1*

100 %
48
50
1*

100 %
45
53
2*

100 %
39
61
0*

941,750 6,626,660

1,316,660

105,690

155,700

Note: The average annual numbers differ from those in other tables because sample
cases in which the respondent did not provide an answer were excluded. Detail may not
add to total because of rounding.
*Based on 10 or fewer sample cases. See Methodology, page 7.

Table 8. Percent of violence against
Hispanic victims reported to police,
by victim characteristics, 1993-2000

Characteristic
of victim

Percent of violence
against Hispanics
reported to the police

Gender
Male
Female

39%
53

Age
12 to 17
18 to 24
25 to 34
35 to 49
50 to 64
65 or older

29%
45
56
55
47
43

Marital status
Never married
Married
Widowed
Divorced/separated

38%
55
58
58

Annual household
income
Less than $7,500
$7,500 to $14,999
$15,000 to $24,999
$25,000 to $34,999
$35,000 to $49,999
$50,000 to $74,999
$75,000 or more

47%
45
45
41
40
42
46

Location of
residence
Urban
Suburban
Rural

46%
42
47

Hispanic Victims of Violent Crime, 1993-2000

5

Reasons for not reporting to police
Hispanic men and women emphasized
different reasons for not reporting to
police the violence they had experienced (table 9). A higher percentage
of males than females gave "minor
crime" and "lack of proof" as reasons
for not reporting to the police. A
somewhat higher percentage of males
cited "not important to the police."
A higher percentage of female than
male victims of violence did not report
to the police because the victim "feared
reprisal" or was "protecting the
offender."
Differing racial or ethnic backgrounds
were not associated with the most
commonly cited reasons for not reporting violence to the police. Victims of all
racial or ethnic groups were most likely
to say that the violence was not
reported because it was a "private or
personal matter," or because it was a
"minor crime."
Trends in nonfatal violence,
1993-2000
The overall rate of violence against
Hispanics decreased 56% between
1993 and 2000 — from 63 to 28
victimizations per 1,000 Hispanics age
12 or older (appendix table). The
estimated number of violent crimes
against Hispanics decreased from the
1993 level of about 1.1 million to
690,470 in 2000.

R ate of violent victim ization
per 1,000 H ispanics in e ach category
80

Suburban

Table 9. Reasons for not reporting violence to police,
by race or Hispanic origin of victim, 1993-2000
Hispanic
Reason for not
reporting to police
Total

Total
Male
100% 100%

Female White
100%
100%

Private or personal matter
Minor crime, no loss
Reported to other official
Not important to police

17
18
14
5

16
20
13
6

18
15
14
4

21
17
14
6

20
15
13
6

Fear of reprisal
Not clear a crime occurred
Lack of proof
Protect offender

6
3
5
3

5
3
5
2

8
2
3
4

4
4
3
3

5
3
5
4

5*
2*
2*
4*

6
4
6
2*

4
2
24

4
2
23

4
3
25

3
3
22

3
3
25

3*
2*
24

6
1*
21

Too inconvenient
Child offender
Other reasons‡

For every demographic characteristic
considered, the rate of violence against
Hispanics declined between 1993 and
2000. Some of the largest percentage
decreases in rates occurred for
females (a 63% decline), those age
35-49 (66% decrease), divorced or
separated persons (64% decline),
those in households with annual
incomes between $15,000 and
$24,999 (71% decrease), and those in
rural areas (71% decline) (see
Highlights figure on page 1, figures 1,
2, and 3, and appendix table).

This report presents data from the
National Crime Victimization Survey
(NCVS) of the Bureau of Justice Statistics. The NCVS gathers data about
crimes using an ongoing, nationally
representative sample of households in
the United States. NCVS data include
information about crime victims (age,
gender, race, ethnicity, income, and
educational level), criminal offenders
(gender, race, approximate age, and
victim-offender relations), and the
nature of the crime (time and place of
occurrence, use of weapons, nature of
injury, and economic consequences).
These data include incidents both
reported and not reported to police.

R ate of violent victim ization
per 1,000 H ispanics in each category
140

100

120

12-17

100
80

U rban
60

R ural
40

D ivorced/
separated

25-34
40

20

20

M arried
0
1993

1999 2000

18-24

60

20

1997

Methodology

R ate of violent victim ization
per 1,000 H ispanics in e ach category
120

N ever m arried

1995

1995

1997

35-49
50 or older

1999 2000

0
1993

N ote: "W idowed" is not shown because of
sm all sam ple size.

Figure 1

15
21
12
6

Other reasons include no insurance, found out too late, can't recover property, police inefficient
or biased, offender was an officer, advised not to report it, and other unspecified reasons.
*Based on 10 or fewer sample cases. See Methodology, page 7.

80

0
1993

24
16
12
9

‡

60

40

Non-Hispanic
American
Black Indian
Asian
100%
100% 100%

Figure 2

6 Hispanic Victims of Violent Crime, 1993-2000

Figure 3

1995

1997

1999 2000

Between 1993 and 2000 about 731,460
individuals of all races and ethnic
groups age 12 or older were interviewed. For the NCVS data presented,
response rates varied between 89%
and 92% of eligible individuals.
Respondents to the NCVS who identified themselves as Mexican-American,
Chicano, Mexican, Puerto Rican,
Cuban, Central or South American
(Spanish-speaking countries) or other
Spanish origin are defined as Hispanics in this report. The category
"Hispanic" includes persons of any
race. Comparison groups include
non-Hispanic persons who were white,
black, American Indian, or Asian.
Thus, in this report the terms "white,"
"black," "American Indian," and "Asian"
refer only to non-Hispanic persons.
Violent acts examined include threatened, attempted and completed rape,
sexual assault, robbery, aggravated
assault, and simple assault.
Hypothesis testing and the NCVS
Standard error computations
Comparisons of estimates discussed in
this report were tested to determine if
the differences were statistically significant. Differences described as higher,
lower, or different passed a hypothesis
test at the .05-level of statistical significance (95%-level of confidence). The
tested difference was greater than
about twice the standard error of that
difference. For comparisons of
estimates which were statistically
significant at the 0.10 level (90%confidence level), differences are
described as somewhat, marginal,
or slight.
Caution is required when making
comparisons of estimates not explicitly
discussed in this report. What may
appear to be a large difference in
estimates may not test as statistically
significant at the 95%- or even the
90%-confidence level. Significance

Appendix table. Rates per 1,000 Hispanic victims of violent crime, by gender,
age, marital status, annual household income, and residence, 1993-2000
1993

1994

Rates per 1,000 Hispanics, 1993-2000
1995
1996 1997 1998 1999

2000

Total

62.8

63.3

56.8

48.7

40.5

34.8

34.4

27.9

Gender
Male
Female

72.6
53.3

73.0
53.9

73.9
39.9

56.8
40.8

46.8
34.4

40.6
29.1

43.1
25.9

36.3
19.5

84.7
63.7
31.6
29.4
12.2
13.2*

80.9
52.2
28.5
20.6
11.3
0.0*

58.9
59.0
28.7
25.5
10.5
7.4*

54.9
40.1
28.1
17.6
10.2*
4.6*

Age
12-17
18-24
25-34
35-49
50-64
65 or older

120.7 132.8 107.0 100.9
84.9
95.6 100.0
82.0
56.4
60.4
45.4
43.8
51.6
34.3
34.4
24.1
19.3
22.2
13.0
18.8
10.3*
7.2* 24.5*
4.0*

Marital status
Never married
Married
Widowed
Divorced/separated

95.1 104.2
34.9
20.6
3.8*
3.6*
93.9
75.7

91.3
28.8
16.4*
72.4

84.3
23.4
18.1*
46.2

65.7
21.5
8.9*
44.6

60.5
14.1
0.0*
43.0

51.7
19.2
9.4*
49.7

43.7
14.3
20.2*
33.4

Annual household
income
Less than $7,500
$7,500-$14,999
$15,000-$24,999
$25,000-$34,999
$35,000-$49,999
$50,000-$74,999
$75,000 or more

98.5
66.1
71.4
38.7
40.5
77.0
45.8*

94.6
66.0
48.3
57.7
56.1
66.8
80.2

65.0
57.5
54.1
57.9
63.1
62.9
75.0

53.2
58.0
44.3
47.2
43.0
71.4
27.7*

50.2
36.2
40.2
43.6
43.6
45.1
21.2*

43.4
40.8
36.1
29.9
22.5
28.5
46.9

40.9
31.9
28.0
35.5
38.5
29.4
58.6

43.4
38.0
20.6
24.7
20.8
33.1
35.7

Residence
Urban
Suburban
Rural

63.0
60.4
70.0

66.6
65.2
45.0

57.0
61.2
38.8

47.1
52.4
38.3

41.4
39.2
41.6

40.3
28.6
38.0

37.1
33.2
23.3

30.5
26.2
20.9*

Note: For the population estimates used, please see the files associated
with this report on the BJS website <http://www.ojp.usdoj.gov/bjs/abstract/hvvc00.htm>.
*Based on 10 or fewer sample cases. See Methodology, this page.

testing calculations were conducted at
BJS using statistical programs developed specifically for the NCVS by the
U.S. Census Bureau. These programs
consider the complex NCVS sample
design when calculating generalized
variance estimates.
Estimates based on 10 or fewer
sample cases have high relative
standard errors. Because calculated
standard errors for such estimates may
not be accurate, care should be taken
when comparing estimates based on
10 or fewer cases to other estimates.
It is not advisable to make comparisons between estimates when both are
based on 10 or fewer sample cases.

Testing trends in violent victimization
Unless stated otherwise when a statement is made describing differences in
estimates between years, it was tested
for significance using a computer
program designed specifically for the
NCVS. These tests determine whether
an estimate in one year differs from
that of another, regardless of intervening estimate variation.

Hispanic Victims of Violent Crime, 1993-2000

7

The Bureau of Justice Statistics
is the statistical agency of the
U.S. Department of Justice.
Lawrence A. Greenfeld is
acting director.
BJS Special Reports address a
specific topic in depth from one or
more datasets that cover many
topics.

To keep current on criminal justice
statistics, at no cost...
Subscribe to e-mail notification of the
latest statistical releases from BJS,
the FBI, and the Office of Juvenile
Justice and Delinquency Prevention
through JUSTSTATS. To learn how
to subscribe, see
http://www.ojp.usdoj.gov/bjs/juststats.htm

Callie Marie Rennison, BJS Statistician, wrote this report under the
supervision of Michael R. Rand.
Cathy T. Maston provided the
statistical review. Tom Hester
produced and edited the report.
Jayne Robinson prepared the
report for printing.
April 2002, NCJ 191208

8 Hispanic Victims of Violent Crime, 1993-2000

This report and others from the
Bureau of Justice Statistics are
available through the Internet —
http://www.ojp.usdoj.gov/bjs
The data from the National Criminal
Victimization Survey are available
from the National Archive of Criminal
Justice Data, maintained by the
Institute for Social Research at the
University of Michigan, 1-800-9990960. The archive may also be
accessed through the BJS Internet
site.


