

Capital Punishment Statistical Trends BJS 2012
Download original document:
Document text
Document text
This text is machine-read, and may contain errors. Check the original document to verify accuracy.
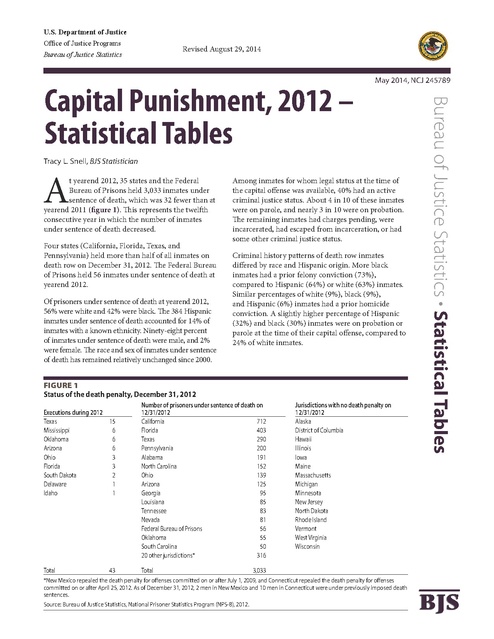
U.S. Department of Justice
Office of Justice Programs

Revised August 29, 2014

Bureau of Justice Statistics

Tracy L. Snell, BJS Statistician

A

t yearend 2012, 35 states and the Federal
Bureau of Prisons held 3,033 inmates under
sentence of death, which was 32 fewer than at
yearend 2011 (figure 1). This represents the twelfth
consecutive year in which the number of inmates
under sentence of death decreased.
Four states (California, Florida, Texas, and
Pennsylvania) held more than half of all inmates on
death row on December 31, 2012. The Federal Bureau
of Prisons held 56 inmates under sentence of death at
yearend 2012.
Of prisoners under sentence of death at yearend 2012,
56% were white and 42% were black. The 384 Hispanic
inmates under sentence of death accounted for 14% of
inmates with a known ethnicity. Ninety-eight percent
of inmates under sentence of death were male, and 2%
were female. The race and sex of inmates under sentence
of death has remained relatively unchanged since 2000.

Among inmates for whom legal status at the time of
the capital offense was available, 40% had an active
criminal justice status. About 4 in 10 of these inmates
were on parole, and nearly 3 in 10 were on probation.
The remaining inmates had charges pending, were
incarcerated, had escaped from incarceration, or had
some other criminal justice status.
Criminal history patterns of death row inmates
differed by race and Hispanic origin. More black
inmates had a prior felony conviction (73%),
compared to Hispanic (64%) or white (63%) inmates.
Similar percentages of white (9%), black (9%),
and Hispanic (6%) inmates had a prior homicide
conviction. A slightly higher percentage of Hispanic
(32%) and black (30%) inmates were on probation or
parole at the time of their capital offense, compared to
24% of white inmates.

Figure 1
Status of the death penalty, December 31, 2012
Executions during 2012
Texas
15
Mississippi
6
Oklahoma
6
Arizona
6
Ohio
3
Florida
3
South Dakota
2
Delaware
1
Idaho
1

Total

43

Number of prisoners under sentence of death on
12/31/2012
California
712
Florida
403
Texas
290
Pennsylvania
200
Alabama
191
North Carolina
152
Ohio
139
Arizona
125
Georgia
95
Louisiana
85
Tennessee
83
Nevada
81
Federal Bureau of Prisons
56
Oklahoma
55
South Carolina
50
20 other jurisdictions*
316
Total

Jurisdictions with no death penalty on
12/31/2012
Alaska
District of Columbia
Hawaii
Illinois
Iowa
Maine
Massachusetts
Michigan
Minnesota
New Jersey
North Dakota
Rhode Island
Vermont
West Virginia
Wisconsin

Bureau of Justice Statistics · Statistical Tables

Capital Punishment, 2012 –
Statistical Tables

May 2014, NCJ 245789

3,033

*New Mexico repealed the death penalty for offenses committed on or after July 1, 2009, and Connecticut repealed the death penalty for offenses
committed on or after April 25, 2012. As of December 31, 2012, 2 men in New Mexico and 10 men in Connecticut were under previously imposed death
sentences.
Source: Bureau of Justice Statistics, National Prisoner Statistics Program (NPS-8), 2012.

BJS

In 2012, 19 states and the Federal Bureau of Prisons reported
that 79 inmates were received under sentence of death.
Admissions in Florida (20), California (13), Texas (9), and
Pennsylvania (6) accounted for 61% of those sentenced to
death in 2012.
Twenty states and the Federal Bureau of Prisons removed
111 inmates from under sentence of death: 43 were executed,
17 died by means other than execution, and 51 were
removed as a result of commutations or courts overturning
sentences or convictions. Removals in Texas (17) and
Florida (10) accounted for a quarter of all inmates removed
from under sentence of death in 2012.
Nine states executed 43 inmates in 2012. The inmates
executed in 2012 had been under sentence of death an
average of 15 years and 10 months, which was 8 months less
than those executed in 2011.
Among the 36 jurisdictions with prisoners under sentence of
death at yearend 2012, 5 jurisdictions had more inmates than
at yearend 2011, 13 had fewer inmates, and 18 had the same
number. Florida showed the largest increase (up 10 inmates).
Oklahoma and Texas (down 8 each), followed by Mississippi
(down 7), North Carolina (down 6), and Arizona (down 5)
had the largest decreases.
The U.S. Supreme Court reinstated the death penalty in 1976
(see Gregg v. Georgia, 427 U.S. 153 (1976) and its companion
cases). From 1976 to 2000, the number of inmates under
sentence of death in the U.S. steadily increased until it

Figure 2
Number of persons under sentence of death, 1953–2012

peaked at 3,601 inmates on December 31, 2000 (figure 2).
In 2001, the number of inmates removed from under
sentence of death was higher than the number admitted for
the first time since 1976 (figure 3). The number of annual
removals of those under sentence of death exceeded the
number of admissions every year since 2001. The 79 inmates
received under sentence of death in 2012 represent a 5%
decrease from the 83 inmates received in 2011. The number
of inmates received in 2012 was the smallest number of
admissions to death row since 1973 when 44 persons
were admitted.
Of the 8,032 people under sentence of death between 1977
and 2012, 16% had been executed, 6% died by causes other
than execution, and 40% received other dispositions.1 The
federal government began collecting annual execution
statistics in 1930. Between 1930 and 2012, a total of 5,179
inmates were executed under civil authority (figure 4).2
After the Supreme Court reinstated death penalty statutes
in 1976, 35 states and the federal government executed
1,320 inmates.
1Following the U.S. Supreme Court’s 1976 approval of revised

statutes in some states (Gregg v. Georgia), executions of inmates
resumed in 1977.
2Military authorities carried out an additional 160 executions
between 1930 and 1961, which are not included in this report.

Figure 3
Admissions to and removals from a sentence of death,
1973–2012

Number
4,000

Number
350
300

3,000

250
200

2,000

Removals

150
1,000

100
Admissions

50
0
1953

1960

1970

1980

1990

2000

2012

Source: Bureau of Justice Statistics, National Prisoner Statistics Program (NPS-8),
2012.

Capital Punishment, 2012 - Statistical Tables | May 2014

0
1973

1980

1990

2000

2012

Source: Bureau of Justice Statistics, National Prisoner Statistics Program (NPS-8),
2012.

2

One state repealed its death penalty statute in
2012, one state had a portion of its statute declared
unconstitutional, and one state revised its capital statute
As of December 31, 2012, 36 states and the federal
government authorized the death penalty (table 1).
Although New Mexico repealed the death penalty in 2009
(Laws 2009, ch. 11 § 5), the repeal was not retroactive,
and offenders charged with a capital offense committed
prior to the repeal may be eligible for a death sentence. As
of December 31, 2012, New Mexico held two men under
previously imposed death sentences, and one person was
awaiting sentencing with the state seeking the death penalty.

Figure 4
Number of persons executed in the United States, 1930–2012
Executions
200

150

100

In 2012, the Connecticut legislature repealed the death
penalty (Public Act No. 12-5), effective for only those capital
offenses committed on or after April 25, 2012. Since the
repeal was prospective, 10 men remained under sentence of
death as of December 31, 2012.

50

0
1930

Three states accounted for nearly threequarters of the executions carried out during this period: Texas executed 16 inmates,
Florida executed 7 inmates, and Oklahoma
executed 6 inmates.
Of the 39 executions carried out in 2013,
38 were by lethal injection. One inmate in
Virginia was executed by electrocution.
A woman was executed in 2013 in Texas.

1960

1970

1980

1990

2000

2012

Lethal injection was authorized by all states with
capital statutes
As of December 31, 2012, all 36 states with death penalty
statutes authorized lethal injection as a method of execution
(table 2).
In addition to lethal injection, 15 states authorized an
alternative method of execution; 8 states authorized
electrocution; 3 states, lethal gas; 3 states, hanging; and
2 states, firing squad.

During 2012, Delaware revised its statutory provisions
relating to the death penalty. The legislature added home
invasion as a class B felony offense to the statute (11 Del.
Code Ann. 11 Del. Code Ann. § 826A) and amended
the aggravating factors for which a death penalty may be
imposed to include murder committed in the course of a
home invasion (11 Del. Code Ann. § 4209(e)(1)j), effective
June 1, 2012.

In 2013, 9 states executed 39 inmates,
which was four fewer than the number
executed in 2012.

1950

Source: Bureau of Justice Statistics, National Prisoner Statistics Program (NPS-8),
2012.

The Arkansas Supreme Court overturned a portion of the
state’s capital criminal procedure on June 22, 2012. The
decision in Hobbs v. Jones (2012 Ark. 293) found that the
Method of Execution Act of 2009 (Ark. Code Ann. § 5-4-617
(Supp. 2011)) violated the separation of powers doctrine in
Article 4 of the Arkansas Constitution because the legislature
granted the executive branch sole discretion in selecting the
method of administering the drugs for lethal injections.

Executions in 2013

1940

In states that authorized multiple methods of execution, the
condemned prisoner generally selects the method. Five of
the 15 states (Arizona, Arkansas, Kentucky, Tennessee, and
Utah) stipulated which method must be used depending
on either the date of the offense or sentencing. One state

Figure 5
Advance count of executions, January 1, 2013–
December 31, 2013
Virginia
Georgia
Alabama
Arizona
Missouri
Ohio
Oklahoma
Florida
Texas
Total

1
1
1

2
2

3

0

6

5

7

16
10

15
20
25
Number of executions

30

35

39
40

Source: Bureau of Justice Statistics, National Prisoner Statistics Program
(NPS-8), 2012.

Capital Punishment, 2012 - Statistical Tables | May 2014

3

(New Hampshire) authorized hanging only if lethal injection
could not be given. Four states authorized alternative
methods if lethal injection is ruled to be unconstitutional:
Delaware authorized hanging, Oklahoma authorized
electrocution or firing squad, Utah authorized firing squad,
and Wyoming authorized lethal gas.

The method of execution of federal prisoners is lethal
injection, pursuant to 28 CFR, Part 26. For offenses
prosecuted under the federal Violent Crime Control and Law
Enforcement Act of 1994, the method used is that of the state
in which the conviction took place (18 U.S.C. 3596).

Methodology
Capital punishment information is collected annually as
part of the National Prisoner Statistics program (NPS-8).
This data series is collected in two parts: data on persons
under sentence of death are obtained from the department
of corrections in each jurisdiction currently authorizing
capital punishment, and the status of death penalty statutes
is obtained from the Office of the Attorney General in each
of the 50 states, the District of Columbia, and the federal
government. Data collection forms are available on the BJS
website at www.bjs.gov.
NPS-8 covers all persons under sentence of death at any
time during the year who were held in a state or federal
nonmilitary correctional facility. This includes capital
offenders transferred from prison to mental hospitals and
those who may have escaped from custody. It excludes
persons whose death sentences have been overturned by the
court, regardless of their current incarceration status.

The statistics included in this report may differ from
data collected by other organizations for various reasons:
(1) NPS-8 adds inmates to the population under sentence of
death not at sentencing, but at the time they are admitted to
a state or federal correctional facility; (2) if inmates entered
prison under a death sentence or were reported as being
relieved of a death sentence in one year but the court had
acted in the previous year, the counts are adjusted to reflect
the dates of court decisions (see note on table 4 for the
affected jurisdictions); and (3) NPS counts are always for the
last day of the calendar year and will differ from counts for
more recent periods.
All data in this report have been reviewed for accuracy by
the data providers in each jurisdiction prior to publication.

List of tables
Table 1.   Capital offenses, by state, 2012
Table 2.   Method of execution, by state, 2012
Table 3.   Federal capital offenses, 2012
Table 4.   Prisoners under sentence of death, by
region, jurisdiction, and race, 2011 and 2012
Table 5.   Demographic characteristics of prisoners
under sentence of death, 2012
Table 6.   Women under sentence of death, by region,
jurisdiction, and race, 2011 and 2012
Table 7.   Hispanics under sentence of death, by
region and jurisdiction, 2011 and 2012
Table 8.   Criminal history profile of prisoners under
sentence of death, by race and Hispanic origin, 2012
Table 9.   Inmates removed from under sentence of
death, by method of removal, 2012
Table 10.   Average time between sentencing and
execution, 1977–2012
Table 11.   Number of inmates executed, by race and
Hispanic origin, 1977–2012

Table 12.   Executions and other dispositions of
inmates sentenced to death, by race and Hispanic
origin, 1977–2012
Table 13.   Executions, by jurisdiction and method,
1977–2011
Table 14.   Number of persons executed, by
jurisdiction, 1930–2012
Table 15.   Prisoners under sentence of death on
December 31, 2012, by jurisdiction and year of
sentencing
Table 16.   Prisoners sentenced to death and the
outcome of the sentence, by year of sentencing,
1973–2012
Table 17.   Number sentenced to death and number
of removals, by jurisdiction and reason for removal,
1973–2012
Appendix Table 1.   Number of inmates under
sentence of death, by demographic characteristics,
2012

Table 1
Capital offenses, by state, 2012
State
Alabama
Arizona
Arkansas

California

Colorado
Connecticuta
Delaware
Florida
Georgia
Idaho
Indiana
Kansas
Kentucky
Louisiana
Maryland
Mississippi
Missouri
Montana

Offense
Intentional murder with 18 aggravating factors (Ala. Stat. Ann.
13A-5-40(a)(1)-(18)).
First-degree murder, including premeditated murder and
felony murder, accompanied by at least 1 of 14 aggravating
factors (A.R.S. § 13-703(F)).
Capital murder (Ark. Code Ann. § 5-10-101) with a finding of
at least 1 of 10 aggravating circumstances; treason (Ark. Code
Ann. § 5-51-201).
First-degree murder with special circumstances; sabotage;
train wrecking causing death; treason; perjury in a capital case
causing execution of an innocent person; fatal assault by a
prisoner serving a life sentence.
First-degree murder with at least 1 of 17 aggravating factors;
first-degree kidnapping resulting in death; treason.
Capital felony with 8 forms of aggravated homicide (C.G.S. §
53a-54b).
First-degree murder (11 Del. C. § 636) with at least 1 statutory
aggravating circumstance (11 Del. C. § 4209).
First-degree murder; felony murder; capital drug trafficking;
capital sexual battery.
Murder with aggravating circumstances; kidnapping with
bodily injury or ransom when the victim dies; aircraft hijacking;
treason.
First-degree murder with aggravating factors; first-degree
kidnapping; perjury resulting in the execution of an innocent
person.
Murder with 16 aggravating circumstances (IC 35-50-2-9).
Capital murder (KSA 21-5401) with 8 aggravating circumstances
(KSA 21-6617, KSA 21-6624).
Capital murder with the presence of at least one statutory
aggravating circumstance; capital kidnapping (KRS 532.025).
First-degree murder; treason (La. R.S. 14:30 and 14:113).
First-degree murder, either premeditated or during the
commission of a felony, provided that certain death eligibility
requirements are satisfied.
Capital murder (Miss. Code Ann. § 97-3-19(2)); aircraft piracy
(Miss. Code Ann. § 97-25-55(1)).
First-degree murder (565.020 RSMO 2000).
Capital murder with 1 of 9 aggravating circumstances (Mont.
Code Ann. § 46-18-303); aggravated kidnapping; felony
murder; capital sexual intercourse without consent (Mont.
Code Ann. § 45-5-503).

State
Nebraska
Nevada

Offense
First-degree murder with a finding of one or more statutory
aggravating circumstance.
First-degree murder with at least 1 of 15 aggravating
circumstances (NRS 200.030, 200.033, 200.035).

New Hampshire Murder committed in the course of rape, kidnapping, drug
crimes, or burglary; killing of a police officer, judge, or
prosecutor; murder for hire; murder by an inmate while serving
a sentence of life without parole (RSA 630:1, RSA 630:5).
New Mexicob First-degree murder with at least 1 of 7 aggravating factors
(NMSA 1978 § 31-20A-5).
New Yorkc

First-degree murder with 1 of 13 aggravating factors (NY Penal
Law §125.27).
North Carolina First-degree murder (NCGS §14-17) with the finding of at least
1 of 11 statutory aggravating circumstances (NCGS § 15A-2000)
Ohio
Aggravated murder with at least 1 of 10 aggravating
circumstances (O.R.C. secs. 2903.01, 2929.02, and 2929.04).
Oklahoma
First-degree murder in conjunction with a finding of at least
1 of 8 statutorily-defined aggravating circumstances.
Oregon
Aggravated murder (ORS 163.095).
Pennsylvania

First-degree murder with 18 aggravating circumstances.

South Carolina Murder with at least 1 of 12 aggravating circumstances (§ 163-20(C)(a)).
South Dakota First-degree murder with 1 of 10 aggravating circumstances.
Tennessee
Texas
Utah
Virginia
Washington
Wyoming

First-degree murder (Tenn. Code Ann. § 39-13-202) with 1 of 16
aggravating circumstances (Tenn. Code Ann. § 39-13-204).
Criminal homicide with 1 of 9 aggravating circumstances (Tex.
Penal Code § 19.03).
Aggravated murder (76-5-202, Utah Code Annotated).
First-degree murder with 1 of 15 aggravating circumstances
(VA Code § 18.2-31).
Aggravated first-degree murder.
First-degree murder; murder during the commission of sexual
assault, sexual abuse of a minor, arson, robbery, burglary,
escape, resisting arrest, kidnapping, or abuse of a minor under
16 (W.S.A. § 6-2-101(a)).

aConnecticut enacted a prospective repeal of its capital statute as of April 25, 2012. Offenders who committed capital offenses prior to that date are eligible for the death
penalty.
bNew Mexico enacted a prospective repeal of its capital statute as of July 1, 2009. Offenders who committed capital offenses prior to that date are eligible for the death
penalty.
cThe New York Court of Appeals has held that a portion of New York’s death penalty sentencing statute (CPL 400.27) was unconstitutional (People v. Taylor, 9 N.Y.3d 129
(2007)). No legislative action has been taken to amend the statute. As a result, capital cases are no longer pursued in New York.
Source: Bureau of Justice Statistics, National Prisoner Statistics Program (NPS-8), 2012.

Capital Punishment, 2012 - Statistical Tables | May 2014

5

Table 2
Method of execution, by state, 2012
Jurisdiction
Total
Alabama
Arizonaa
Arkansasb
California
Colorado
Connecticutc
Delawared
Florida
Georgia
Idaho
Indiana
Kansas
Kentuckye
Louisiana
Maryland
Mississippi
Missouri
Montana
Nebraska
Nevada
New Hampshiref
New Mexicog
New York
North Carolina
Ohio
Oklahomah
Oregon
Pennsylvania
South Carolina
South Dakota
Tennesseei
Texas
Utahj
Virginia
Washington
Wyomingk

Lethal injection
36
■
■
■
■
■
■
■
■
■
■
■
■
■
■
■
■
■
■
■
■
■
■
■
■
■
■
■
■
■
■
■
■
■
■
■
■

Electrocution
8
■
■

Lethal gas
3

Hanging
3

Firing squad
2

■

■

■

■

■

■

■

■

■
■
■

■
■

■

Note: The method of execution of federal prisoners is lethal injection, pursuant to 28 CFR, Part 26. For offenses prosecuted under the Violent Crime Control and Law
Enforcement Act of 1994, the execution method is that of the state in which the conviction took place (18 U.S.C. 3596).
aAuthorizes lethal injection for persons sentenced after November 15, 1992; inmates sentenced before that date may select lethal injection or gas.
bAuthorizes lethal injection for those whose offense occurred on or after July 4, 1983; inmates whose offense occurred before that date may select lethal injection or
electrocution.
cAuthorizes lethal injection for inmates whose capital offense occurred prior to April 25, 2012.
dAuthorizes hanging if lethal injection is held to be unconstitutional by a court of competent jurisdiction.
eAuthorizes lethal injection for persons sentenced on or after March 31, 1998; inmates sentenced before that date may select lethal injection or electrocution.
fAuthorizes hanging only if lethal injection cannot be given.
gAuthorizes lethal injection for those whose capital offense occurred prior to July 1, 2009.
hAuthorizes electrocution if lethal injection is held to be unconstitutional, and firing squad if both lethal injection and electrocution are held to be unconstitutional.
iAuthorizes lethal injection for those whose capital offense occurred after December 31, 1998; inmates whose offense occurred before that date may select electrocution
by written waiver.
jAuthorizes firing squad if lethal injection is held unconstitutional. Inmates who selected execution by firing squad prior to May 3, 2004, may still be entitled to execution
by that method.
kAuthorizes lethal gas if lethal injection is held to be unconstitutional.
Source: Bureau of Justice Statistics, National Prisoner Statistics Program (NPS-8), 2012.

Capital Punishment, 2012 - Statistical Tables | May 2014

6

Table 3
Federal capital offenses, 2012
Statute
8 U.S.C. 1342
18 U.S.C. 32-34
18 U.S.C. 36
18 U.S.C. 37
18 U.S.C. 115(b)(3) [by crossreference to 18 U.S.C. 1111]
18 U.S.C. 241, 242, 245, 247
18 U.S.C. 351 [by cross-reference
to 18 U.S.C. 1111]
18 U.S.C. 794
18 U.S.C. 844(d), (f), (i)
18 U.S.C. 924(i)
18 U.S.C. 930
18 U.S.C. 1091
18 U.S.C. 1111
18 U.S.C. 1114
18 U.S.C. 1116
18 U.S.C. 1118
18 U.S.C. 1119
18 U.S.C. 1120
18 U.S.C. 1121
18 U.S.C. 1201
18 U.S.C. 1203
18 U.S.C. 1503
18 U.S.C. 1512
18 U.S.C. 1513
18 U.S.C. 1716
18 U.S.C. 1751 [by cross-reference
to 18 U.S.C. 1111]
18 U.S.C. 1958
18 U.S.C. 1959
18 U.S.C. 1992
18 U.S.C. 2113
18 U.S.C. 2119
18 U.S.C. 2245
18 U.S.C. 2251
18 U.S.C. 2280
18 U.S.C. 2281
18 U.S.C. 2332
18 U.S.C. 2332a
18 U.S.C. 2340
18 U.S.C. 2381
21 U.S.C. 848(e)
49 U.S.C. 1472-1473

Description
Murder related to the smuggling of aliens.
Destruction of aircraft, motor vehicles, or related facilities resulting in death.
Murder committed during a drug-related drive-by shooting.
Murder committed at an airport serving international civil aviation.
Retaliatory murder of a member of the immediate family of law enforcement officials.
Civil rights offenses resulting in death.
Murder of a member of Congress, an important executive official, or a Supreme Court Justice.
Espionage.
Death resulting from offenses involving transportation of explosives, destruction of government property, or destruction
of property related to foreign or interstate commerce.
Murder committed by the use of a firearm during a crime of violence or a drug-trafficking crime.
Murder committed in a federal government facility.
Genocide.
First-degree murder.
Murder of a federal judge or law enforcement official.
Murder of a foreign official.
Murder by a federal prisoner.
Murder of a U.S. national in a foreign country.
Murder by an escaped federal prisoner already sentenced to life imprisonment.
Murder of a state or local law enforcement official or other person aiding in a federal investigation; murder of a state
correctional officer.
Murder during a kidnapping.
Murder during a hostage taking.
Murder of a court officer or juror.
Murder with the intent of preventing testimony by a witness, victim, or informant.
Retaliatory murder of a witness, victim, or informant.
Mailing of injurious articles with intent to kill or resulting in death.
Assassination or kidnapping resulting in the death of the President or Vice President.
Murder for hire.
Murder involved in a racketeering offense.
Willful wrecking of a train resulting in death.
Bank robbery-related murder or kidnapping.
Murder related to a carjacking.
Murder related to rape or child molestation.
Murder related to sexual exploitation of children.
Murder committed during an offense against maritime navigation.
Murder committed during an offense against a maritime fixed platform.
Terrorist murder of a U.S. national in another country.
Murder by the use of a weapon of mass destruction.
Murder involving torture.
Treason.
Murder related to a continuing criminal enterprise or related murder of a federal, state, or local law enforcement officer.
Death resulting from aircraft hijacking.

Source: Bureau of Justice Statistics, National Prisoner Statistics Program (NPS-8), 2012.

Capital Punishment, 2012 - Statistical Tables | May 2014

7

Table 4
Prisoners under sentence of death, by region, jurisdiction, and race, 2011 and 2012
Prisoners under sentence
of death, 12/31/11
Region and jurisdiction Totalb Whitec,d Blackc
U.S. total
3,065 1,721 1,274
56
28
27
Federale
State
3,009 1,693 1,247
Northeast
209
86
120
Connecticut
10
4
6
New Hampshire
1
0
1
New York
0
0
0
Pennsylvaniad
198
82
113
Midwest
225
122
99
Indiana
12
9
3
Kansas
9
6
3
Missouri
46
26
20
Nebraska
11
7
2
Ohio
143
70
71
South Dakota
4
4
0
South
1,587
854
711
Alabama
195
99
95
Arkansas
38
14
24
Delaware
18
7
11
393
248
144
Floridad
Georgia
95
49
46
Kentucky
34
29
5
Louisiana
87
30
56
Maryland
5
1
4
Mississippi
56
24
31
North Carolina
158
67
83
Oklahoma
63
33
26
South Carolina
52
22
30
Tennessee
86
49
35
Texas
298
177
117
Virginia
9
5
4
West
988
631
317
Arizonad
130
108
17
Californiad,f
706
418
257
Colorado
3
0
3
Idaho
13
13
0
Montana
2
2
0
Nevada
80
47
32
New Mexico
2
2
0
Oregon
35
29
4
Utah
8
6
1
Washington
8
5
3
Wyoming
1
1
0

Received under
Removed from death row
sentence of death, 2012 (excluding executions), 2012a
Totalb Whitec Blackc
Totalb Whitec Blackc
79
38
40
68
34
32
1
0
1
1
1
0
78
38
39
67
33
32
7
4
3
5
3
2
1
1
0
1
1
0
0
0
0
0
0
0
0
0
0
0
0
0
6
3
3
4
2
2
7
3
4
6
3
3
0
0
0
0
0
0
0
0
0
0
0
0
1
1
0
0
0
0
0
0
0
0
0
0
5
1
4
6
3
3
1
1
0
0
0
0
45
22
23
45
19
24
5
2
3
9
3
6
1
1
0
1
0
1
2
0
2
2
0
2
20
13
7
7
5
2
2
1
1
2
0
2
0
0
0
0
0
0
2
0
2
4
2
2
0
0
0
0
0
0
2
2
0
3
2
1
0
0
0
6
1
4
1
1
0
3
1
1
0
0
0
2
1
1
1
0
1
4
3
1
9
2
7
2
1
1
0
0
0
0
0
0
19
9
9
11
8
3
4
4
0
3
3
0
13
5
7
7
4
3
0
0
0
0
0
0
0
0
0
0
0
0
0
0
0
0
0
0
1
0
1
0
0
0
0
0
0
0
0
0
0
0
0
0
0
0
0
0
0
0
0
0
1
0
1
1
1
0
0
0
0
0
0
0

Executed, 2012
Totalb Whitec Blackc
43
32
11
0
0
0
43
32
11
0
0
0
0
0
0
0
0
0
0
0
0
0
0
0
5
5
0
0
0
0
0
0
0
0
0
0
0
0
0
3
3
0
2
2
0
31
20
11
0
0
0
0
0
0
1
0
1
3
3
0
0
0
0
0
0
0
0
0
0
0
0
0
6
4
2
0
0
0
6
5
1
0
0
0
0
0
0
15
8
7
0
0
0
7
7
0
6
6
0
0
0
0
0
0
0
1
1
0
0
0
0
0
0
0
0
0
0
0
0
0
0
0
0
0
0
0
0
0
0

Prisoners under sentence
of death, 12/31/12
Totalb Whitec Blackc
3,033 1,693 1,271
56
27
28
2,977 1,666 1,243
211
87
121
10
4
6
1
0
1
0
0
0
200
83
114
221
117
100
12
9
3
9
6
3
47
27
20
11
7
2
139
65
72
3
3
0
1,556
837
699
191
98
92
38
15
23
17
7
10
403
253
149
95
50
45
34
29
5
85
28
56
5
1
4
49
20
28
152
66
79
55
28
24
50
21
29
83
46
35
290
170
116
9
5
4
989
625
323
125
103
17
712
419
261
3
0
3
12
12
0
2
2
0
81
47
33
2
2
0
35
29
4
8
6
1
8
4
4
1
1
0

Note: Some figures shown for yearend 2011 are revised from those reported in Capital Punishment, 2011 - Statistical Tables, BJS web, NCJ 242185. The revised figures include
3 inmates who were either reported late to the National Prisoner Statistics program or were not in custody of state correctional authorities on December 31, 2011 (1 each in
Pennsylvania, Ohio, and Nevada) and exclude 21 inmates who were relieved of a death sentence before December 31, 2011, 10 in Pennsylvania; 3 in Texas; 2 in Nevada; and
1 each in Alabama, Arkansas, Georgia, Mississippi, Tennessee, and Nevada).
aIncludes 15 deaths from natural causes (2 each in Ohio, Florida, Oklahoma, Texas, and California; and 1 each in Pennsylvania, Georgia, North Carolina, Tennessee, and
Arizona) and 2 deaths from suicide (in California).
bIncludes American Indians and Alaska Natives, Asians, Native Hawaiians, and other Pacific Islanders, and Hispanic inmates for whom no other race was identified.
cCounts of white and black inmates include persons of Hispanic or Latino origin, which may differ from other tables in this report.
dThe race reported for 18 inmates has been revised from Hispanic to white (7 in Arizona; 5 each in Pennsylvania and California; and 1 in Florida). The Hispanic or Latino
origin reported for these inmates remains unchanged.
eExcludes persons held under Armed Forces jurisdiction with a military death sentence for murder.
fOne inmate whose death sentence in Oregon was vacated in 2011 is now being reported in California where he is under a separate sentence of death.
Source: Bureau of Justice Statistics, National Prisoner Statistics Program (NPS-8), 2012.

Capital Punishment, 2012 - Statistical Tables | May 2014

8

Table 5
Demographic characteristics of prisoners under sentence of
death, 2012
Characteristic
Total inmates
Sex
Male
Female
Racea
White
Black
All other racesb
Hispanic originc
Hispanic
Non-Hispanic
Age
18–19
20–24
25–29
30–34
35–39
40–44
45–49
50–54
55–59
60–64
65 or older
Average age
Mean
Median
Educationd
8th grade or less
9th–11th grade
High school graduate/GED
Any college
Median education level
Marital statuse
Married
Divorced/separated
Widowed
Never married

Total
yearend
3,033

Admissions
79

Removals
111

98.0%
2.0

96.2%
3.8

98.2%
1.8

55.8%
41.9
2.3

48.1%
50.6
1.3

59.5%
38.7
1.8

14.0%
86.0

9.0%
91.0

11.8%
88.2

0.0%
0.9
3.9
9.3
14.5
18.1
16.4
15.7
10.1
6.5
4.6

0.0%
12.7
15.2
15.2
19.0
19.0
8.9
3.8
5.1
1.3
0.0

0.0%
0.0
4.5
8.1
15.3
10.8
14.4
20.7
6.3
11.7
8.1

46
45

36
37

48
48

13.3%
34.9
42.5
9.3
12th

13.6%
32.2
52.5
1.7
12th

13.8%
43.6
36.2
6.4
11th

21.8%
20.2
3.5
54.5

12.3%
16.9
6.2
64.6

15.6%
21.9
7.3
55.2

Note: Detail may not sum to total due to rounding.
aPercentages for white and black inmates include persons of Hispanic or Latino
origin, which may differ from other tables in this report.
bAt yearend 2012, inmates in “all other races” consisted of 22 American Indians,
42 Asians, and 5 self-identified Hispanics. During 2012, 1 Asian inmate was
admitted and 2 American Indians were removed.
cCalculations exclude count of inmates with unknown Hispanic origin: 291 total
yearend, 1 admission, and 18 removals.
dCalculations exclude count of inmates with unknown education level: 531 total
yearend, 20 admissions, and 17 removals.
eCalculations exclude count of inmates with unknown marital status: 338 total
yearend, 14 admissions, and 15 removals.
Source: Bureau of Justice Statistics, National Prisoner Statistics Program (NPS-8),
2012.

Capital Punishment, 2012 - Statistical Tables | May 2014

9

Table 6
Women under sentence of death, by region, jurisdiction, and race, 2011 and 2012
Region and jurisdiction
U.S. total
Federal
State
Northeast
Pennsylvania
Midwest
Indiana
Ohio
South
Alabama
Florida
Georgia
Kentucky
Louisiana
Mississippi
North Carolina
Oklahoma
Tennessee
Texas
West
Arizona
California
Idaho
Oregon

Under sentence of
death, 12/31/11a
Totalb Whitec Blackc
60
42
14
2
2
0
58
40
14
3
1
2
3
1
2
2
1
1
1
0
1
1
1
0
29
19
9
4
3
1
4
2
2
1
1
0
1
1
0
2
1
1
2
2
0
4
2
1
1
1
0
1
1
0
9
5
4
24
19
2
3
3
0
19
14
2
1
1
0
1
1
0

Received under
sentence of death, 2012
Totalb Whitec Blackc
3
1
1
0
0
0
3
1
1
0
0
0
0
0
0
0
0
0
0
0
0
0
0
0
2
1
1
0
0
0
1
0
1
0
0
0
0
0
0
0
0
0
0
0
0
0
0
0
0
0
0
0
0
0
1
1
0
1
0
0
0
0
0
1
0
0
0
0
0
0
0
0

Removed from
death row, 2012
Totalb Whitec Blackc
2
1
0
1
1
0
1
0
0
0
0
0
0
0
0
0
0
0
0
0
0
0
0
0
1
0
0
0
0
0
0
0
0
0
0
0
0
0
0
0
0
0
0
0
0
1
0
0
0
0
0
0
0
0
0
0
0
0
0
0
0
0
0
0
0
0
0
0
0
0
0
0

Under sentence
of death, 12/31/12
Totalb Whitec Blackc
61
42
15
1
1
0
60
41
15
3
1
2
3
1
2
2
1
1
1
0
1
1
1
0
30
20
10
4
3
1
5
2
3
1
1
0
1
1
0
2
1
1
2
2
0
3
2
1
1
1
0
1
1
0
10
6
4
25
19
2
3
3
0
20
14
2
1
1
0
1
1
0

Note: No women were executed during 2012.
aCounts of women under sentence of death at yearend 2011 has been revised from those reported in Capital Punishment, 2011 - Statistical Tables, BJS web, NCJ 242185.
The revised figures exclude 1 male inmate in North Carolina who was erroneously reported as a female during the 2011 data collection and 1 female inmate in
Pennsylvania whose removal from under sentence of death occurred prior to 2011 but was not reported until the 2012 data collection.
bIncludes American Indians and Alaska Natives, Asians, Native Hawaiians, and other Pacific Islanders, and Hispanic inmates for whom no other race was identified.
cCounts of white and black inmates include persons of Hispanic or Latino origin, which may differ from other tables in this report.
Source: Bureau of Justice Statistics, National Prisoner Statistics Program (NPS-8), 2012.

Capital Punishment, 2012 - Statistical Tables | May 2014

10

Table 7
Hispanics under sentence of death, by region and jurisdiction, 2011 and 2012
Region and jurisdiction
U.S. total
Federal
State
Northeast
Connecticut
Pennsylvania
Midwest
Nebraska
Ohio
South
Alabama
Delaware
Florida
Georgia
Louisiana
North Carolina
Oklahoma
South Carolina
Tennessee
Texas
West
Arizona
California
Idaho
Nevada
New Mexico
Oregon
Utah

Under sentence
of death, 12/31/11
388
8
380
20
1
19
9
5
4
140
2
3
33
2
2
4
2
1
1
90
211
27
168
1
8
1
3
3

Received under
sentence of death, 2012
7
0
7
0
0
0
0
0
0
3
0
0
1
1
0
0
0
0
0
1
4
0
4
0
0
0
0
0

Removed from death row
(excluding executions), 2012
4
0
4
1
1
0
0
0
0
1
0
0
0
0
0
0
0
0
0
1
2
1
1
0
0
0
0
0

Executed, 2012
7
0
7
0
0
0
0
0
0
6
0
0
1
0
0
0
1
0
0
4
1
1
0
0
0
0
0
0

Under sentence of
death, 12/31/12
384
8
376
19
0
19
9
5
4
136
2
3
33
3
2
4
1
1
1
86
212
25
171
1
8
1
3
3

Note: The counts of Hispanics under sentence of death at yearend 2011 has been revised from those reported in Capital Punishment, 2011 - Statistical Tables, BJS web,
NCJ 242185.
Source: Bureau of Justice Statistics, National Prisoner Statistics Program (NPS-8), 2012.

Capital Punishment, 2012 - Statistical Tables | May 2014

11

Table 8
Criminal history profile of prisoners under sentence of death, by race and Hispanic origin, 2012
Criminal history
U.S. total
Prior felony convictionsc
Yes
No
Prior homicide convictionsd
Yes
No
Legal status at time of capital offensee
Charges pending
Probation
Parole
On escape
Incarcerated
Other status
None

Alla
100%

Whiteb
100%

Blackb
100%

Hispanic
100%

67.1%
32.9

63.4%
36.6

72.9%
27.1

63.8%
36.2

8.6%
91.4

8.7%
91.3

9.4%
90.6

6.0%
94.0

8.4%
11.2
16.4
1.3
2.5
0.2
60.0

9.1%
9.6
14.3
1.8
3.1
0.2
61.8

8.5%
12.1
18.0
0.8
2.2
0.2
58.1

6.0%
13.1
18.9
1.1
1.4
0.3
59.1

Note: Percentages are based on offenders for whom data were reported. Detail may not sum to total because of rounding.
aIncludes American Indians and Alaska Natives, Asians, Native Hawaiians, and other Pacific Islanders.
bExcludes persons of Hispanic or Latino origin.
cData were not reported for 234 inmates.
dData were not reported for 38 inmates.
eData were not reported for 319 inmates.
Source: Bureau of Justice Statistics, National Prisoner Statistics Program (NPS-8), 2012.

Capital Punishment, 2012 - Statistical Tables | May 2014

12

Table 9
Inmates removed from under sentence of death, by method of removal, 2012
Region and jurisdiction
U.S. total
Federal
State
Northeast
Connecticut
Pennsylvania
Midwest
Ohio
South Dakota
South
Alabama
Arkansas
Delaware
Florida
Georgia
Louisiana
Mississippi
North Carolina
Oklahoma
South Carolina
Tennessee
Texas
West
Arizona
California
Idaho
Washington

Total
111
1
110
5
1
4
11
9
2
76
9
1
3
10
2
4
9
6
9
2
4
17
18
9
7
1
1

Execution
43
0
43
0
0
0
5
3
2
31
0
0
1
3
0
0
6
0
6
0
0
15
7
6
0
1
0

Other death
17
0
17
1
0
1
2
2
0
9
0
0
0
2
1
0
0
1
2
0
1
2
5
1
4
0
0

Appeals or higher courts overturned
Conviction
Sentence
11
36
0
1
11
35
0
4
0
1
0
3
1
1
1
1
0
0
9
25
4
5
1
0
1
0
0
5
0
0
2
2
0
3
0
5
0
1
0
2
1
2
0
0
1
5
0
2
0
3
0
0
1
0

Sentence
commuted
4
0
4
0
0
0
2
2
0
2
0
0
1
0
1
0
0
0
0
0
0
0
0
0
0
0
0

Source: Bureau of Justice Statistics, National Prisoner Statistics Program (NPS-8), 2012.

Capital Punishment, 2012 - Statistical Tables | May 2014

13

Table 10
Average time between sentencing and execution, 1977–2012
Year
Total
1977
1979
1981
1982
1983
1984
1985
1986
1987
1988
1989
1990
1991
1992
1993
1994
1995
1996
1997
1998
1999
2000
2001
2002
2003
2004
2005
2006
2007
2008
2009
2010
2011
2012

Number of inmates
executed
1,320
1
2
1
2
5
21
18
18
25
11
16
23
14
31
38
31
56
45
74
68
98
85
66
71
65
59
60
53
42
37
52
46
43
43

Average elapsed time from sentence
to execution for all inmates
136 mo.
:
:
:
:
:
74
71
87
86
80
95
95
116
114
113
122
134
125
133
130
143
137
142
127
131
132
147
145
153
139
169
178
198
190

Note: In 1972, the U.S. Supreme Court invalidated capital punishment statutes
in several states (Furman v. Georgia, 408 U.S. 238 (1972)), effecting a moratorium
on executions. Executions resumed in 1977 when the Supreme Court found that
revisions to several state statutes had effectively addressed the issues previously
held unconstitutional (Gregg v. Georgia, 428 U.S. 153 (1976) and its companion
cases). Average time was calculated from the most recent sentencing date.
: Not calculated. A reliable average could not be generated from fewer than
10 cases.
Source: Bureau of Justice Statistics, National Prison Statistics Program (NPS-8),
2012.

Capital Punishment, 2012 - Statistical Tables | May 2014

Table 11
Number of inmates executed, by race and Hispanic origin,
1977–2012
Year
Total
1977
1979
1981
1982
1983
1984
1985
1986
1987
1988
1989
1990
1991
1992
1993
1994
1995
1996
1997
1998
1999
2000
2001
2002
2003
2004
2005
2006
2007
2008
2009
2010
2011
2012

All
executions
1,320
1
2
1
2
5
21
18
18
25
11
16
23
14
31
38
31
56
45
74
68
98
85
66
71
65
59
60
53
42
37
52
46
43
43

Whitea
747
1
2
1
1
4
13
9
9
11
6
6
16
6
17
19
19
31
29
41
40
53
43
45
47
41
36
38
25
22
17
24
28
22
25

Blacka
451
0
0
0
1
1
8
7
7
11
5
8
7
7
11
14
11
22
14
26
18
33
35
17
18
20
19
19
20
14
17
21
13
16
11

Hispanic
108
0
0
0
0
0
0
2
2
3
0
2
0
1
2
4
1
2
2
5
8
9
6
3
6
3
3
3
8
6
3
7
5
5
7

All other
racesa,b
14
0
0
0
0
0
0
0
0
0
0
0
0
0
1
1
0
1
0
2
2
3
1
1
0
1
1
0
0
0
0
0
0
0
0

Note: In 1972, the U.S. Supreme Court invalidated capital punishment statutes
in several states (Furman v. Georgia, 408 U.S. 238 (1972)), effecting a moratorium
on executions. Executions resumed in 1977 when the Supreme Court found that
revisions to several state statutes had effectively addressed the issues previously
held unconstitutional (Gregg v. Georgia, 428 U.S. 153 (1976) and its companion
cases).
aExcludes persons of Hispanic or Latino origin.
bIncludes American Indians and Alaska Natives, Asians, Native Hawaiians, and
other Pacific Islanders.
Source: Bureau of Justice Statistics, National Prisoner Statistics Program (NPS-8),
2012.

14

Table 12
Executions and other dispositions of inmates sentenced to death, by race and Hispanic origin, 1977–2012
Race/Hispanic origin
Total
Whitec
Blackc
Hispanic
All other racesc,d

Total under sentence
of death, 1977–2012b
8,032
3,870
3,300
735
127

Number
1,320
747
451
108
14

Prisoners executed
Percent of total
16.4%
19.3
13.7
14.7
11.0

Prisoners who received other dispositionsa
Number
Percent of total
3,679
45.8%
1,794
46.4
1,591
48.2
243
33.1
51
40.2

Note: In 1972, the U.S. Supreme Court invalidated capital punishment statutes in several states (Furman v. Georgia, 408 U.S. 238 (1972)), effecting a moratorium on
executions. Executions resumed in 1977 when the Supreme Court found that revisions to several state statutes had effectively addressed the issues previously held
unconstitutional (Gregg v. Georgia, 428 U.S. 153 (1976) and its companion cases).
aIncludes persons removed from a sentence of death because of statutes struck down on appeal, sentences or convictions vacated, commutations, or death by other
than execution.
bIncludes 5 persons sentenced to death prior to 1977 who were still under sentence of death on December 31, 2012; 374 persons sentenced to death prior to 1977
whose death sentence was removed between 1977 and December 31, 2012; and 7,653 persons sentenced to death between 1977 and 2012.
cExcludes persons of Hispanic or Latino origin.
dIncludes American Indians and Alaska Natives, Asians, Native Hawaiians, and other Pacific Islanders.
Source: Bureau of Justice Statistics, National Prisoner Statistics Program, (NPS-8), 2012.

Capital Punishment, 2012 - Statistical Tables | May 2014

15

Table 13
Executions, by jurisdiction and method, 1977–2012
Jurisdiction
U.S. total
Federal
Alabama
Arizona
Arkansas
California
Colorado
Connecticut
Delaware
Florida
Georgia
Idaho
Illinois
Indiana
Kentucky
Louisiana
Maryland
Mississippi
Missouri
Montana
Nebraska
Nevada
New Mexico
North Carolina
Ohio
Oklahoma
Oregon
Pennsylvania
South Carolina
South Dakota
Tennessee
Texas
Utah
Virginia
Washington
Wyoming

Number executed
1,320
3
55
34
27
13
1
1
16
74
52
3
12
20
3
28
5
21
68
3
3
12
1
43
49
102
2
3
43
3
6
492
7
109
5
1

Lethal injection
1,146
3
31
32
26
11
1
1
15
30
29
3
12
17
2
8
5
17
68
3
0
11
1
41
49
102
2
3
36
3
5
492
4
79
3
1

Electrocution
157
0
24
0
1
0
0
0
0
44
23
0
0
3
1
20
0
0
0
0
3
0
0
0
0
0
0
0
7
0
1
0
0
30
0
0

Lethal gas
11
0
0
2
0
2
0
0
0
0
0
0
0
0
0
0
0
4
0
0
0
1
0
2
0
0
0
0
0
0
0
0
0
0
0
0

Hanging
3
0
0
0
0
0
0
0
1
0
0
0
0
0
0
0
0
0
0
0
0
0
0
0
0
0
0
0
0
0
0
0
0
0
2
0

Firing squad
3
0
0
0
0
0
0
0
0
0
0
0
0
0
0
0
0
0
0
0
0
0
0
0
0
0
0
0
0
0
0
0
3
0
0
0

Note: In 1972, the U.S. Supreme Court invalidated capital punishment statutes in several states (Furman v. Georgia, 408 U.S. 238 (1972)), effecting a moratorium on
executions. Executions resumed in 1977 when the Supreme Court found that revisions to several state statutes had effectively addressed the issues previously held
unconstitutional (Gregg v. Georgia, 428 U.S. 153 (1976) and its companion cases).
Source: Bureau of Justice Statistics, National Prisoner Statistics Program (NPS-8), 2012.

Capital Punishment, 2012 - Statistical Tables | May 2014

16

Revised August 29, 2014
Table 14
Number of persons executed, by jurisdiction, 1930–2012
Jurisdiction
U.S. total
Texas
Georgia
New York
North Carolina
California
Florida
Ohio
South Carolina
Virginia
Alabama
Mississippi
Louisiana
Oklahoma
Pennsylvania
Arkansas
Missouri
Kentucky
Illinois
Tennessee
New Jersey
Maryland
Arizona
Indiana
Washington
Colorado
Nevada
District of Columbia
West Virginia
Federal system
Delaware
Massachusetts
Connecticut
Utah
Oregon
Iowa
Kansas
Montana
New Mexico
Wyoming
Nebraska
Idaho
Vermont
South Dakota
New Hampshire

Since 1930
5,179
789
418
329
306
305
244
221
205
201
190
175
162
161
155
145
130
106
102
99
74
73
72
61
52
48
41
40
40
36
28
27
22
21
20
18
15
9
9
8
7
6
4
4
1

Since 1977
1,320
492
52
0
43
13
74
49
43
109
55
21
102
28
3
27
68
3
12
6
0
5
34
20
5
1
12
0
0
3
16
0
1
2
7
0
0
3
1
1
3
3
3
0
0

Note: Statistics on executions under civil authority have been collected by the
federal government annually since 1930. These data exclude 160 executions
carried out by military authorities between 1930 and 1961.
Source: Bureau of Justice Statistics, National Prisoner Statistics Program (NPS-8),
2012.

Capital Punishment, 2012 - Statistical Tables | May 2014

17

Table 15
Prisoners under sentence of death on December 31, 2012, by jurisdiction and year of sentencing

Jurisdiction
Total
Florida
California
Texas
Georgia
Nevada
Tennessee
Arizona
Arkansas
Pennsylvania
Mississippi
Kentucky
Alabama
Missouri
Idaho
Ohio
Maryland
Louisiana
Oklahoma
South Carolina
Utah
North Carolina
Montana
Indiana
Nebraska
Connecticut
Washington
Oregon
Federal
South Dakota
Delaware
New Mexico
Colorado
Virginia
Kansas
Wyoming
New Hampshire

1974–
1979
33
16
7
4
2
1
1
1
1
0
0
0
0
0
0
0
0
0
0
0
0
0
0
0
0
0
0
0
0
0
0
0
0
0
0
0
0

1980–
1982
60
12
28
3
2
3
2
2
0
2
2
1
1
1
1
0
0
0
0
0
0
0
0
0
0
0
0
0
0
0
0
0
0
0
0
0
0

1983–
1985
121
19
38
5
0
10
10
5
0
6
0
3
2
2
0
9
3
2
2
2
1
1
1
0
0
0
0
0
0
0
0
0
0
0
0
0
0

1986–
1988
192
30
58
12
9
7
8
6
0
23
0
5
8
2
1
14
0
5
1
0
1
0
0
1
1
0
0
0
0
0
0
0
0
0
0
0
0

Year of sentence for prisoners under sentence of death, 12/31/2012
1989– 1992– 1995– 1998– 2001– 2003– 2005– 2007–
1991
1994
1997
2000
2002
2004
2006
2008
234
330
423
430
202
207
220
203
42
51
34
50
17
16
24
29
72
88
107
101
38
30
38
29
12
25
29
49
32
39
22
24
7
10
17
19
3
5
5
10
9
4
20
9
0
3
3
4
10
3
13
10
8
6
2
2
13
14
9
5
1
12
11
11
1
8
9
6
3
1
2
4
20
30
26
25
15
8
12
13
6
6
4
7
7
2
4
2
2
5
2
7
2
1
3
0
7
20
26
32
12
13
24
17
3
2
9
5
4
4
5
7
2
1
2
0
0
2
1
0
13
11
22
19
10
10
7
8
0
0
1
1
0
0
0
0
2
6
19
20
7
5
5
2
0
2
3
12
5
10
8
9
3
1
6
6
6
8
7
7
2
0
2
1
0
0
0
1
4
33
45
29
10
8
9
4
0
1
0
0
0
0
0
0
0
1
1
3
2
1
2
0
0
0
2
0
0
2
3
1
3
0
1
0
0
0
1
3
1
0
2
1
2
0
0
0
2
0
5
5
7
3
4
3
0
2
4
5
7
10
12
8
0
1
0
0
0
0
0
0
0
0
1
0
5
3
3
0
0
0
1
0
1
0
0
0
0
0
1
0
0
0
0
1
0
0
0
1
0
1
3
2
0
0
0
0
2
2
1
2
0
0
0
0
0
1
0
0
0
0
0
0
0
0
0
1

Note: For persons sentenced to death more than once, the numbers are based on the most recent death sentence.
: Not calculated. A reliable average could not be generated from fewer than 10 cases.
Source: Bureau of Justice Statistics, National Prisoner Statistics Program (NPS–8), 2012.

2009–
2010
219
29
55
17
3
6
4
24
2
9
6
2
15
2
2
8
0
5
2
4
0
6
0
1
2
1
1
3
7
0
1
0
1
0
1
0
0

2011
81
14
10
8
1
1
3
8
0
5
1
1
9
0
0
3
0
5
0
0
0
3
0
0
0
0
0
3
0
1
2
0
0
2
1
0
0

2012
78
20
13
9
2
1
1
3
1
6
2
0
5
1
0
5
0
2
1
0
0
0
0
0
0
1
1
0
1
1
2
0
0
0
0
0
0

Under sentence of
death, 12/31/12
3,033
403
712
290
95
81
83
125
38
200
49
34
191
47
12
139
5
85
55
50
8
152
2
12
11
10
8
35
56
3
17
2
3
9
9
1
1

Average number of years
under sentence of death
as of 12/31/12
14.2
15.3
16.0
12.5
14.9
17.3
16.9
12.0
13.7
15.2
12.6
16.9
11.8
12.9
15.2
14.8
:
13.0
10.5
11.1
:
14.3
:
12.3
10.3
10.9
:
11.2
8.5
:
7.3
:
:
:
:
:
:

Table 16
Prisoners sentenced to death and the outcome of the sentence, by year of sentencing, 1973–2012

Year of sentence
Total, 1973–2012
1973
1974
1975
1976
1977
1978
1979
1980
1981
1982
1983
1984
1985
1986
1987
1988
1989
1990
1991
1992
1993
1994
1995
1996
1997
1998
1999
2000
2001
2002
2003
2004
2005
2006
2007
2008
2009
2010
2011
2012

Number
sentenced
to death
8,374
42
149
298
232
137
185
151
173
223
267
252
285
258
301
287
288
255
251
268
286
287
315
311
316
263
293
277
224
154
165
152
138
139
123
119
121
118
109
83
79

Execution
1,320
2
11
6
14
19
37
28
47
57
67
69
72
52
75
59
63
48
50
45
49
66
71
65
45
34
46
31
26
15
21
17
7
1
1
2
1
0
0
1
0

Number of prisoners removed from under sentence of death
Appeal or higher courts overturned
Other
Death penalty
Sentence
death
statute
Conviction Sentence commuted
478
522
874
1,722
392
0
14
9
8
9
4
65
15
30
22
5
171
24
67
21
6
136
17
42
15
5
40
26
33
7
7
21
36
66
8
16
2
28
59
6
16
4
30
55
12
16
0
42
82
12
24
0
41
85
12
27
1
30
72
15
21
2
46
78
13
14
1
43
89
15
26
1
51
70
14
28
7
45
79
10
18
1
35
76
14
20
0
33
71
13
20
2
37
57
18
13
2
37
61
11
20
0
29
57
23
21
3
24
47
15
13
10
37
58
15
20
6
21
48
14
21
64
15
20
4
14
3
21
41
11
13
4
22
49
9
14
8
21
37
10
14
4
12
35
9
10
3
6
23
2
6
3
3
20
5
8
1
6
15
1
3
1
4
15
5
5
0
2
13
1
4
0
7
5
3
3
2
7
3
2
2
0
4
8
3
0
0
0
4
1
0
0
2
0
1
1
0
0
0
0
1
0
0
0
0

Other or
unknown
reasons
33
0
1
2
0
0
0
1
0
1
0
2
8
4
5
7
0
1
1
0
0
0
0
0
0
0
0
0
0
0
0
0
0
0
0
0
0
0
0
0
0

Number under
sentence of death,
12/31/2012
3,033
0
1
2
2
7
10
11
9
13
38
36
45
40
59
52
81
69
66
99
108
111
111
137
147
139
150
156
124
95
107
104
103
117
103
100
103
113
106
81
78

Note: In 1972, the U.S. Supreme Court invalidated capital punishment statutes in several states (Furman v. Georgia, 408 U.S. 238 (1972)), effecting a moratorium on
executions. Executions resumed in 1977 when the Supreme Court found that revisions to several state statutes had effectively addressed the issues previously held
unconstitutional (Gregg v. Georgia, 428 U.S. 153 (1976) and its companion cases). Some inmates executed since 1977 or currently under sentence of death were
sentenced prior to 1977. For persons sentenced to death more than once, the numbers are based on the most recent death sentence.
Source: Bureau of Justice Statistics, National Prisoner Statistics Program (NPS-8), 2012.

Capital Punishment, 2012 - Statistical Tables | May 2014

19

Table 17
Number sentenced to death and number of removals, by jurisdiction and reason for removal, 1973–2012
Jurisdiction
U.S. total
Federal
Alabama
Arizona
Arkansas
California
Colorado
Connecticut
Delaware
Florida
Georgia
Idaho
Illinois
Indiana
Kansas
Kentucky
Louisiana
Maryland
Massachusetts
Mississippi
Missouri
Montana
Nebraska
Nevada
New Hampshire
New Jersey
New Mexico
New York
North Carolina
Ohio
Oklahoma
Oregon
Pennsylvania
Rhode Island
South Carolina
South Dakota
Tennessee
Texas
Utah
Virginia
Washington
Wyoming
Percent of inmates
sentenced to death,
1973–2012

Total sentenced to
death, 1973–2012
8,374
70
434
304
114
976
22
15
60
1,025
325
42
307
100
13
83
245
53
4
195
183
15
33
154
1
52
28
10
535
415
351
62
412
2
205
7
226
1,066
27
152
39
12
100%

Executed
1,320
3
55
34
27
13
1
1
16
74
52
3
12
20
0
3
28
5
0
21
68
3
3
12
0
0
1
0
43
49
102
2
3
0
43
3
6
492
7
109
5
1
15.8%

Died
478
0
34
18
3
85
2
0
0
65
19
3
15
4
0
6
6
3
0
6
10
2
5
15
0
3
1
0
24
24
17
2
29
0
6
1
17
44
1
6
1
1

Number of removals, 1973–2012
Sentence or conviction Sentence
overturned
commuted
3,118
392
10
1
152
2
119
7
44
2
151
15
15
1
4
0
26
1
463
18
148
10
21
3
97
171
56
6
4
0
38
2
118
7
36
4
2
2
116
0
55
3
6
2
12
2
42
4
0
0
33
8
19
5
10
0
308
8
181
22
173
4
0
23
174
6
2
0
103
3
0
0
112
6
185
55
10
1
16
11
25
0
9
0

5.7%

37.2%

4.7%

Other
removals
33
0
0
1
0
0
0
0
0
2
1
0
12
2
0
0
1
0
0
3
0
0
0
0
0
8
0
0
0
0
0
0
0
0
0
0
2
0
0
1
0
0
0.4%

Under sentence of
death, 12/31/12
3,033
56
191
125
38
712
3
10
17
403
95
12
0
12
9
34
85
5
0
49
47
2
11
81
1
0
2
0
152
139
55
35
200
0
50
3
83
290
8
9
8
1
36.2%

Note: In 1972, the U.S. Supreme Court invalidated capital punishment statutes in several states (Furman v. Georgia, 408 U.S. 238 (1972)), effecting a moratorium on
executions. Executions resumed in 1977 when the Supreme Court found that revisions to several state statutes had effectively addressed the issues previously held
unconstitutional (Gregg v. Georgia, 428 U.S. 153 (1976) and its companion cases). Some inmates executed since 1977 or currently under sentence of death were
sentenced prior to 1977. For persons sentenced to death more than once, the numbers are based on the most recent death sentence.
Source: Bureau of Justice Statistics, National Prisoner Statistics Program (NPS-8), 2012.

Capital Punishment, 2012 - Statistical Tables | May 2014

20

Appendix table 1
Number of inmates under sentence of death, by
demographic characteristics, 2012
Characteristic
Total inmates
Sex
Male
Female
Racea
White
Black
All other racesb
Hispanic origin
Hispanic
Non-Hispanic
Number unknown
Age
18–19
20–24
25–29
30–34
35–39
40–44
45–49
50–54
55–59
60–64
65 or older
Education
8th grade or less
9th–11th grade
High school graduate/GED
Any college
Unknown
Marital status
Married
Divorced/separated
Widowed
Never married
Unknown

Total
yearend
3,033

Admissions
79

Removals
111

2,972
61

76
3

109
2

1,693
1,271
69

38
40
1

66
43
2

384
2,358
291

7
71
1

11
82
18

0
26
118
283
440
548
498
477
306
198
139

0
10
12
12
15
15
7
3
4
1
0

0
0
5
9
17
12
16
23
7
13
9

333
874
1,063
232
531

8
19
31
1
20

13
41
34
6
17

587
545
94
1,469
338

8
11
4
42
14

15
21
7
53
15

aCounts for white and black inmates include persons of Hispanic or Latino origin,
which may differ from other tables in this report.
bAt yearend 2012, inmates in “all other races” consisted of 22 American Indians,
42 Asians, and 5 self–identified Hispanics. During 2012, 1 Asian inmate was
admitted and 2 American Indians were removed.
Source: Bureau of Justice Statistics, National Prisoner Statistics Program (NPS–8),
2012.

Capital Punishment, 2012 - Statistical Tables | May 2014

21

The Bureau of Justice Statistics is the statistical agency of the U.S. Department of Justice.
William J. Sabol is the acting director.
This report was written by Tracy L. Snell. Todd D. Minton verified the report.
Beth Davis carried out the data collection and processing under the supervision of
Crecilla C. Scott, Criminal Justice Statistics Branch, Governments Division, Census
Bureau, U.S. Department of Commerce. Rekha Kudlur provided statistical and
technical assistance.
Lockheed Martin and Jill Thomas edited the report. Barbara Quinn produced the report.
May 2014, NCJ 245789

Office of Justice Programs
Innovation • Partnerships • Safer Neighborhoods
www.ojp.usdoj.gov


