

Civic Responses to Police Violence - Harvard University 2020
Download original document:
Document text
Document text
This text is machine-read, and may contain errors. Check the original document to verify accuracy.
Civic Responses to Police Violence∗
Desmond Ang†
Harvard University
Jonathan Tebes‡
Harvard University
October 29, 2020
Abstract
Roughly a thousand people are killed by American law enforcement officers each
year, accounting for more than 5% of all homicides. We estimate the causal impact
of these events on civic engagement. Exploiting hyper-local variation in how close
residents live to a killing, we find that exposure to police violence leads to significant
increases in registrations and votes. These effects are driven entirely by Blacks and
Hispanics and are largest for killings of unarmed individuals. We find corresponding
increases in support for criminal justice reforms, suggesting that police violence may
cause voters to politically mobilize against perceived injustice.
∗
We are very grateful for helpful comments from Edward Glaeser, Lawrence Katz, Amy Lerman, Andrei
Shleifer, seminar participants at the Citrin Center’s Race and Public Opinion Seminar of UC Berkeley as
well as seminar participants at the 2020 APSA conference. Tebes benefited from generous financial support
from the Stone Scholar Fellowship for Social Policy and Inequality Research. All errors are our own.
†
Kennedy School of Government, Harvard University, 79 John F. Kennedy St., Rubenstein 410, Cambridge, MA 02138, desmond ang@hks.harvard.edu
‡
Department of Economics, Harvard University, Cambridge, MA 02138. jtebes@g.harvard.edu.
I
Introduction
In recent years, acts of police violence have garnered significant public attention. The
high-profile killings of George Floyd and Breonna Taylor compelled an estimated 15 to 26
million Americans to protest against police brutality and systemic racism (Buchanan et al.,
2020). This movement was just part of a larger national reckoning, which saw violent counterprotests in Portland, player walk-outs across professional sports leagues, and widespread calls
to defund the police. These events are not without historical precedent. Dating back to the
1965 Watts riots, the four largest episodes of urban unrest in America were all triggered by
police use of force (DiPasquale and Glaeser, 1998).
However, little is known about the political impacts of police violence. On the one hand,
recent events suggest that communities may be mobilized to redress perceived injustices. In
line with this, research in developing country contexts finds that violent conflict may increase
voter turnout (Bellows and Miguel, 2006; Blattman, 2009). On the other hand, acts of police
violence may traumatize civilians or undermine their faith in government leading them to
disengage from social and civic institutions (Desmond et al., 2016; Ang, 2020). Consistent
with this, robust evidence suggests that contact with the criminal justice system can have
drastic demobilizing effects (Weaver and Lerman, 2010; Lerman and Weaver, 2014b).
The empirical literature provides little clarity and focuses primarily on the political fallout
of high-profile acts of police violence, such as the death of Freddie Gray in Baltimore (White
et al., 2018) or the Rodney King riots in Los Angeles (Enos et al., 2019). While over a
thousand officer-involved killings occur each year in the United States (Finch et al., 2019),
only a small number ever garner local – much less national – attention. Thus, case studies
of landmark events may provide limited insight into the vast majority of incidents that go
unnoticed by the wider public. They are also unable to disentangle the political consequences
of widespread rioting and protests from the impact of the underlying use of force incident.1
This paper provides the first causal evidence of the impact of police violence on civic
engagement. We combine highly detailed voter registration data from Los Angeles County
with novel incident-level data on the timing, location and context of 294 police killings
spanning nearly a decade. To identify the effects of police killings, we leverage a flexible
difference-in-differences design exploiting hyper-local variation in exposure to these events.
This allows us to compare voting patterns in the exact Census block a police killing occurred
to adjacent blocks in the same neighborhood.
We find that police killings mobilize local residents to engage with the electoral process.
1
In fact, existing literature in political science (Gilens and Page, 2014; Mazumder, 2018; Wasow, 2020)
and economics (Collins and Margo, 2007; Madestam et al., 2013) focuses specifically on the effects of protests
rather than their antecedent events.
2
Registrations and votes in exposed blocks increase by roughly 5% in the elections following a
police killing. While gains in voter turnout persist for one to two election cycles, registration
effects continue more than a decade later. Consistent with the fact that over 80% of sample
killings were unmentioned in local newspapers, these effects are highly localized. We find
little evidence of spillovers even among neighboring blocks.
The aggregate effects mask significant heterogeneity. Increased civic engagement is driven
entirely by Blacks and Hispanics, who are 8% and 5% more likely to register as a result of
exposure to local police killings, respectively. We find no statistical or practical impact on
the political behavior of nearby whites and Asians. We also document striking differences
along other dimensions. The largest effects come from younger voters, new registrants and
Democrats. We find no significant impact among Republicans or individuals over age 35.
These findings accord with a host of survey evidence documenting deep racial and partisan
divisions in views of law enforcement, with minorities and liberals far more concerned about
police use of force than whites and conservatives.
To unpack mechanisms, we examine voting patterns in criminal justice referenda. We
find that police killings lead to significant increases in local support for propositions seeking
to reduce criminal penalties for non-serious offenses. These results suggest that residents
may seek to reform the criminal justice system through civic engagement. As corroboration,
we provide evidence that civic spillovers are largest following killings of unarmed individuals
— those events in which police actions may have seemed the least justifiable.
This paper makes several contributions. First, it adds to a burgeoning literature examining the social spillovers of police violence (Bor et al., 2018; Legewie, 2019). In contrast to
research by Ang (2020) showing that police killings cause nearby Black and Hispanic students
to drop out of school, our results indicate that these events may also lead underrepresented
minorities to further engage with – and affect change through – existing institutions. As
fatal shootings account for less than one-tenth of one percent of all use of force encounters
(Davis et al., 2018), our findings hint at the potentially outsize role that far more common
forms of police violence may have on civic engagement.2
More broadly, our findings tie into a large literature exploring how interactions with the
criminal justice system affect political participation. While research suggests that even brief
contact with the carceral state can significantly reduce voter turnout among incarcerated
individuals (White et al., 2019) and their family members (White, 2019), we find that indirect
exposure to extreme acts of police aggression – such as witnessing or learning about an
2
Estimating the effects of these events is complicated by the fact that “data on lower level uses of force”
are “virtually non-existent” (Fryer Jr, 2016). Furthermore, the prevalence of less extreme use of force is
often directly determined by law enforcement strategy, rendering causal inference more difficult.
3
officer-involved killing in the neighborhood – can have the opposite effect. This divergence
is consistent with work by Lerman and Weaver (2014a), who find that the impact of law
enforcement on civic engagement can vary – even directionally – according to the intensity
and nature of police-civilian interactions.
Lastly, this paper provides important context for recent social unrest roiling the nation.
Theoretical work suggests that emotional reactions to unfair government treatment may
cause individuals to protest (Passarelli and Tabellini, 2017). We find that controversial
police killings may drive citizens to the polls for similar reasons. While these results carry
important implications for upcoming elections, they also highlight the pivotal role that police
may play in shaping institutional trust (Weitzer and Tuch, 2006; Kirk and Papachristos,
2011; Tyler et al., 2014). Given the intensity of policing in many communities of color and
the increasing media attention received by officer use of force, greater interrogation of this
relationship may be critical to addressing longstanding racial disparities in civic engagement
and political representation.
II
Data
A
Police Killings
Incident-level data on police killings come from the Los Angeles Times Homicide Database
and includes 294 police killings that occurred between the 2002 and 2010 general elections.
For each incident, the data records name, age and race of the deceased as well as the exact
address and date of the event. We supplement this with information on media coverage in
local newspapers.3 For 253 of the 294 incidents, we were also able to determine whether a
weapon was recovered from the deceased and if so, what type. This information was handcoded from Los Angeles County District Attorney reports as well as police reports and other
sources.
Note that these contextual measures may provide an incomplete picture of the surrounding events. Often officers acted under faulty information. For example, in one incident,
police killed a man who was reported to have a gun but who was actually holding a water
hose nozzle. In other cases, killings were precipitated by seemingly innocuous encounters
that quickly escalated – such as, when a man lunged for an officer’s gun after he was stopped
for riding a bicycle on the sidewalk. Nonetheless, weapon information has the benefit of
3
We searched for each incident by the name of the deceased in the print versions of six local newspapers:
the Los Angeles Times, the Los Angeles Daily News, Pasadena Star News, San Gabriel Valley Tribune,
Torrance Daily Breeze and Whittier Daily News. The combined daily circulation of the papers is roughly 1
million copies.
4
being objectively verifiable and can be found in all available incident reports.
[Table I about here.]
Panel A of Table I provides a summary of the police killings data. 53% of deceased
individuals were Hispanic, 29% were Black, 15% were white and 3% were Asian.4 Relative
to their county population shares, Black (Hispanic) individuals are roughly six (two) times
more likely to be killed by police than whites. The vast majority of individuals (96%) were
male and the average age was 30 years old.
Consistent with national statistics, 56% of those killed were armed with a firearm (including BB guns and replicas), while 27% possessed some other type of weapon. This includes
items like knives and pipes as well as individuals who attempted to hit someone with a
vehicle. The remaining 17% of individuals were completely unarmed.
Notably, the vast majority of incidents received little or no media coverage. Only 18% of
sample killings were ever mentioned in any of six local newspapers. Conditional on coverage,
the median number of articles is two. The most mentions of any incident was 28, nowhere
near the level of media attention garnered by recent nationally-reported police killings.
Examining contextual factors separately by race, Black and Hispanic individuals killed
by police were younger on average than white and Asian individuals (29 vs. 36 years old,
respectively) and more likely to possess a firearm (61% vs. 33%). However, rates of media
coverage are similar between groups (19% vs. 17%).
Regardless of circumstance, involved officers were never prosecuted. The District Attorney did not pursue criminal charges against police following any of the 294 sample killings.
This is consistent with national statistics, which find that criminal charges were filed against
police in fewer than half a percent of all officer-involved shootings.
B
Voter Registration and Turnout
Police killings are geocoded to Census blocks and merged to voting information from
the California Statewide Database. The database contains information on the number of
individuals registered to vote and the number of ballots cast at the 2010 Census blocklevel for each general election from 2002 to 2010.5 The advantage of these data relative to
standard voter registration files is that they capture registration and voting at the date of
each election allowing for precise measurement of impacts.6 In addition to total registration
4
Race categories are mutually exclusive.
Vote counts are only available through 2010, while registration counts are available through 2018. In
the Appendix, we extend the registration sample to assess the persistence of effects.
6
Due to irregular registration purges and resident mobility, voter files obtained months after an election
can have registration counts that differ substantially from known election-day aggregates.
5
5
and vote counts, disaggregated counts by ethnicity (i.e., Hispanic, Asian), party affiliation
(i.e., Democrat, Republican or Independent/other), age and duration of registration are also
available. We combine these data with block-level demographic information on the voting
age population from the 2000 and 2010 Censuses.
In order to examine the impact of police killings on voter preferences, we merge data on
block-level voting patterns in two referenda that proposed changes to the severity of criminal
sentencing laws. The first – Proposition 66 in 2004 – would have limited California’s “three
strikes” law to apply only to violent and serious felonies. The second – Proposition 5 in 2008
– would have enacted numerous measures to reduce the criminal penalties for drug offenses,
including the reduction of marijuana misdemeanors to infractions, and the expansion of drug
treatment and rehabilitation programs.
C
Analysis Sample
Since vote counts are only available until 2010, our main analysis focuses on the 20022010 general elections. To improve precision of our estimates, we restrict the sample to
blocks with five or more residents aged 18 or older as of the 2000 Census. In the Appendix,
we show similar results under alternative sample restrictions.
Panel B of Table I provides a summary of the voter registration data. Blocks that
experienced a police killing had, on average, 189 adult residents in 2000, compared to roughly
97 residents in other blocks. Notably, treated blocks are quite similar to untreated blocks in
the same block group (i.e. the effective control group) in terms of the racial, political and
age characteristics of residents and registered voters. These areas also experienced similar
rates of turnout (37 vs. 38%) and registration (42% vs. 48%) in 2002.
III
A
Empirical Strategy
Exposure to Police Killings
A primary concern for identification is that police shootings are likely not random. Thus,
a naive comparison of areas where police killings are relatively prevalent and areas where they
are not could be confounded by correlated neighborhood factors. Furthermore, if changes in
local conditions predict police killings, biases could remain even when including area fixed
effects in panel analysis.
To address this, we adopt a similar empirical strategy as Ang (2020) and exploit withinneighborhood variation in the location of police killings. Identification comes from comparing
changes in voting over time in blocks where police killings occurred to neighboring blocks in
6
the same neighborhood. Thus, except for the police killing itself, local conditions are likely
to be similar in level and trend across both areas.
The validity of this strategy is aided by two factors. First, police killings are quite rare
and difficult to predict. Over 300,000 arrests and nearly 60,000 violent crimes occur in
Los Angeles each year, compared to fewer than 50 officer-involved killings. Furthermore,
many police killings are entirely unaccompanied by violent crime, as only a quarter of events
involved armed suspects who fired at others. Thus, while crime rates and policing intensity
may differ across neighborhoods, the exact timing and location of officer-involved shootings
within those neighborhoods is likely exogenous.
Second, in contrast to the handful of high-profile events in recent years, the vast majority
of police killings receive little or no media coverage. Consistent with Ang (2020), who finds
that educational spillovers of police violence are limited to less than 0.50 miles, living in one
block versus the other is likely highly correlated with even learning about the existence of a
police killing. This provides meaningful treatment heterogeneity within neighborhoods.
Graphical Evidence
As evidence, we first examine how effects differ by geographical proximity to a killing. To
do so, we construct the following distance metric to capture a given Census block’s proximity
to a police killing: for each police killing, we estimate the minimum radius needed for a circle
centered on the police killing to cover at least 75% of a block’s area.7 Using this metric,
we run the following least-squares regression to explore how impacts on registration count
dissipate with distance from a killing:
yb,t = δb + δn,t +
X
αd Distanced + δP OPb xELECt + b,t
(1)
d
yb,t is the number of registered voters in block b at election t. δb and δn,t are Census
block fixed effects and neighborhood-by-election fixed effects. Because block-level population
counts are only available from the decennial Census, we include interactions between election
fixed effects and deciles of voting age population in 2000 (δP OPb xELECt ) to account for the
P
possibility of differential population growth between blocks.
d Distanced are a set of
mutually-exclusive treatment indicators that track a block’s distance to the nearest police
killing that occurred prior to election t.8
7
We estimate minimum radius in 0.05-mile increments up to 2 miles. Reassuringly, over 95% of blocks
containing a police killing are within 0.35 miles of the killing based on this measure. We found other metrics,
such as the distance to a block’s centroid, to be substantially noisier.
8
For example, if a block’s nearest killing before 2007 was 1.5 miles away then experienced another killing
0.5 miles away in 2007, distance is 1.5 miles for elections before 2008 and 0.5 miles for 2008 forward.
7
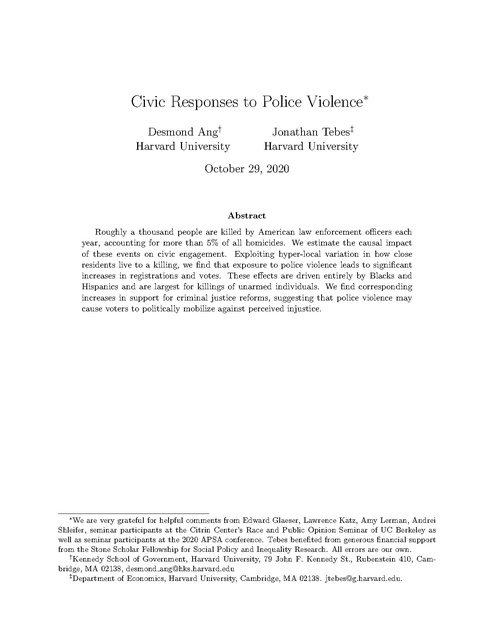
[Figure I about here.]
We partition shootings first by whether or not the block was directly exposed to a killing,
and then into 0.1-mile bins up to 2 miles from the shooting. Figure I plots αd coefficients
under two different specifications: controlling for election fixed effects across the entire sample
and at the Census block group level. Impact is normalized to 0 for blocks 0.7 to 0.8 miles
from the killing (since these blocks are within the “zero-impact” region).9
The graphical evidence suggests that impacts are indeed hyper-local. Across specification,
treated Census blocks experience a significant increase in registrations of between 3.5 and 5
counts (4-6% of the pre-killing mean). Consistent with the under-publicized nature of police
killings, effects fall off dramatically with spatial distance, with zero or near zero estimates
for neighboring blocks even slightly further away.
B
Estimating Equation
To estimate effects on civic engagement, we employ an event study model. Drawing on
the distance analysis, treatment is defined as Census blocks that experienced a police killing
and neighborhood is defined at the Census block group-level. We estimate the following base
equation on the block-panel data:
yb,t = δb + δn,t +
X
βτ Shoott,τ + δP OPb xELECt + b,t .
(2)
τ 6=−1
This is essentially analogous to Equation 1 except we replace the set of treatment distance
P
P
indicators ( αd Distanced ) with a set of time to treatment indicators ( βτ Shoott,τ ), fixing
treatment to the first killing that occurred in a Census block between the 2002 and 2010
general elections.10 Neighborhood-time fixed effects (δn,t ) are defined by Census block groups,
which average less than one square mile in area. The coefficients of interest (βτ ) then
represent the differential change between relative time τ and the last period prior to the
police killing among blocks exposed to a killing relative to that same change over time among
unexposed blocks in the same neighborhood. Drawing on Bertrand et al. (2004), standard
errors are clustered by Census block groups, allowing for correlation of errors within each of
the sample’s 6,400 Census block groups.
9
In the block group specification, distance indicators are set to 0 within treated block groups so that
neighboring blocks are not mechanically biased downwards through the neighborhood-election fixed effects.
10
Only one block experienced multiple killings over the sample period. Results are robust to excluding
that block.
8
Crime and Migration
One potential threat to identification is that trends in violent crime may affect the prevalence of both civic engagement (Bateson, 2012; Sønderskov et al., 2020) and police killings.
However, given that we control for block group-election fixed effects, any biases would have to
be hyper-local, affecting individuals on one street but not the next within the same neighborhood. To test this, Figure A.I of the Appendix estimates Equation 2 on criminal homicides
in a block-year. As shown, we find little evidence of differential trends in violent crime before
or after police killings, reinforcing the plausible exogeneity of these events.11
Another potential threat is selective migration in response to police violence. However,
2006-2010 ACS data suggests that this is unlikely to be a serious concern, as the share of
individuals who reported residing at the same house one year prior is virtually identical
between Census blocks that did and did not experience a police killing (86.6% and 86.8%,
respectively).
IV
A
Effects on Registration and Turnout
Main Results
Panel A of Figure II examines the impact of police killings on local registration counts.
The omitted period is the last election prior to a killing and the sample spans the 2002 to
2010 general elections.
[Figure II about here.]
In the elections prior to a killing, we find strong evidence of parallel trends between
treatment and control areas. Treatment coefficients for τ < 0 are near zero and statistically
insignificant, both individually and jointly (F = 0.40, p = 0.671). These findings reinforce
the plausible exogeneity of police killings and provide support for parallel trends in the
counterfactual.
Following police killings, registration increases significantly among nearby citizens. Treated
blocks gain, on average, about 2 additional registrants in the election immediately following
the killing and about 4 registrants within four years. Given that treated blocks contain an
average of 80 registrants prior to treatment, these effects represent a meaningful increase
of 2.5 to 5%. The stability of point estimates four to eight years after exposure suggests
that effects on registration are persistent over time. As corroboration, Appendix Figure
11
Ang (2020) finds similar null results when examining effects on all crimes and arrests from 2010-2016.
9
A.II expands the sample to include elections through 2016 and reports significant effects on
registration more than a decade after a killing.12
Panel B presents analogous results for vote counts. We again find little evidence of differential trends in ballots cast in the lead-up to police killings. The pre-treatment coefficients
are individually and jointly insignificant (F = 0.35, p = 0.702). After killings, we find a
significant, if short-lived, increase of approximately 2.0 votes (5% of the pre-killing mean).
Appendix Table A.I presents a series of robustness checks under alternative specifications. Column 1 shows our base model with a simple post-treatment indicator. We find
that, on average, police killings lead to 3.8 more voter registrations and 1.8 more votes per
election in treated blocks. To account for potential confounds due to local crime, Column
2 controls for the number of homicides in a block in the two years preceding each election.
Column 3 includes quintiles of minority population share by election fixed effects to allow
for differential voting patterns among minority neighborhoods, which may be more likely to
experience police killings. Given that younger individuals may have aged into voting eligibility during the sample period, Column 4 includes interactions between election fixed effects
and population of 10-17 year-olds in a block in 2000. Column 5 replaces our 2000 voting
population measures with 2010 measures. Column 6 drops Census blocks that experienced
multiple killings over the sample period. To demonstrate robustness to sample selection,
Column 7 expands the sample to include all Census blocks, even those with less than five
adults in 2000. Alternatively, Column 8 restricts the sample to Census blocks with at least
10 registered voters in 2002.
We find similar results across all specifications, with significant treatment effects on voter
registration and turnout. These findings provide evidence of the robust causal relationship
between police killings and local political participation. In particular, we find that individuals
are mobilized to register and vote by extreme acts of police violence.
B
Heterogeneity
Voter Race
Given large demographic and partisan differences in views of law enforcement, we examine heterogeneous responses to police violence. To explore how effects differ across race, we
make use of vote and registration counts by ethnicity provided by the California Statewide
Database, which predicts Hispanic ethnicity from voter surname using the Census Bureau’s
Passel-Word list and Asian ethnicity using Lauderdale and Kestenbaum’s (2000) surname
12
As block-level vote counts are not available for elections after 2010, we are unable to replicate this
analysis with voting.
10
dictionary.13 From these measures, we generate estimates of Black (white) vote and registration counts using the following formula:
V oteBlkb,t = (V oteT otb,t − V oteHispb,t − V oteAsnb,t )×
%Blkb,2010 × %V oteBlkt
(%Blkb,2010 × %V oteBlkt ) + (%W htb,2010 × %V oteW htt ) + (%Othb,2010 × %V oteOtht )
(3)
where V oteT otb,t , V oteHispb,t and V oteAsnb,t are the number of total votes, Hispanic votes
and Asian votes in block b at election t and %Blkb,2010 , %W htb,2010 , and %Othb,2010 are the
share of residents over age 18 who are Black, white, and other race from the 2010 Census. To
account for racial differences in voter turnout rates, we weight by each racial group’s turnout
rate in California during election t as estimated by the CPS Voting and Registration Supplement (%V oteBlkt , %V oteW htt , and %V oteOtht ).14 Essentially, we weight non-Hispanic,
non-Asian votes (registrations) in a given block-election by each racial group’s predicted vote
(registration) share relative to the other remaining racial groups.15
[Figure III about here.]
We then estimate our simplified version of Equation 2 on predicted counts by race. As
shown in Panel A of Figure III, a striking pattern emerges. Police killings lead to large
increases in Black and Hispanic participation. On average, each police killing increases
Black registrations by 1.7 and Black votes by 1.0. These estimates are highly significant
and represent an 8-11% increase over the pre-killing mean (20.6 registrations and 9.0 votes).
We find similar, if proportionally smaller, responses among Hispanics with increases of 1.5
registrations (5% of mean) and 1.0 votes (7% of mean). In contrast, we find no significant
impact on White and Asian participation, with point estimates representing less than 2% of
the mean.16
The pattern of effects is consistent with a host of evidence documenting large racial
differences in perceptions of law enforcement. Researchers have found that race is the single
13
The Passel-Word list has been shown to be more predictive of Hispanic ethnicity than directly-collected
Medicare measures (Morgan et al., 2004; Wei et al., 2006).
14
Due to the small sample size of the “other” racial group, we collapse CPS turnout rates for “other” into
presidential and mid-term election averages.
15
To address concerns with ecological inference (King, 2013), Appendix Figure A.III compares our race
estimates for 2010 against estimates obtained by predicting individual race from surname and address in the
full voter registration file and aggregating to the block-level (Bureau, 2014). Estimates are highly similar
with mean differences near zero in both treatment and control areas.
16
Appendix Figure A.IV explores heterogeneity across race of the deceased. We find suggestive evidence
that racial concordance matters with larger point estimates for same race killings. Figure A.IV also compares
effects between presidential and midterm elections and between killings that occurred less/more than a year
from the next election. We find little evidence of differential effects in either case.
11
strongest predictor of trust in police (Taylor et al., 2001) and Blacks and Hispanics are far
more likely than others to believe that use of force is excessive, unjustified or a serious social
issue (Weitzer and Tuch, 2002; AP-NORC, 2015; Davis et al., 2018).
Voter Age, Years Registered and Political Affiliation
In Panel B, we find that gains in voter participation are driven by younger individuals.
Following police killings, registrations among nearby 18- to 34-year-olds increase by about
7% (pre-killing mean = 25.7), while votes increase by roughly 11% (pre-killing mean = 9.0).
In contrast, treatment estimates for individuals over 35 years old are statistically insignificant
and small in magnitude (less than 5% of the pre-killing mean). Consistent with this, Panel C
demonstrates that increases in turnout come entirely from individuals who registered within
3 years of a given election.17
In Panel D, we show that effects are also concentrated among registered Democrats. We
find no significant impact on registration or vote counts among Republicans or independents.
These results are reflective of longstanding partisan gaps in views of law enforcement. Survey
evidence from 1970 found that Democrats were more likely to oppose police use of force than
Republicans (Gamson and McEvoy, 1970) and Democrats today remain much more skeptical
of police accountability and discretion (Morin et al., 2017).18
Media Coverage and Incident Location
The left pane of Panel E compares effects for killings that were and were not mentioned
in local newspapers. We find suggestive evidence that registration effects may be larger
for killings that were covered in the media than for those that were not. This may help
to explain the discrepancy between recent responses to high-profile police killings and the
highly-localized effects we observe here. However, this is only suggestive as estimates are
not statistically different from each other and there is limited variation in media intensity
across sample killings.19
The right pane of Panel E compares killings that occurred near the home of the deceased
against those that occurred in other areas.20 We find similar estimates across incident
17
That point estimates for registration are near zero for longer-registered voters provides evidence that
the registration effects are not driven by differential migration (i.e. previously registered voters moving into
treatment areas).
18
For example, 27% of Democrats versus 74% of Republicans believe police do a good job “using the right
amount of force.”
19
It is also important to note that media coverage may itself be endogeneous and a function of community
reactions to an event.
20
We infer whether a killing occurred in or near the person’s home based on incident descriptions provided
in DA reports.
12
location. This suggests that gains in participation are unlikely to be driven solely by friends,
family or loved ones of the deceased.21 Rather, they may instead be the result of increased
engagement among nearby residents who are concerned about procedural fairness (Sunshine
and Tyler, 2003) or “feel at risk” of meeting a similar fate (Zimring, 2017).
V
Mechanisms
While our results indicate that police violence may increase local civic participation,
interpretation of these effects is theoretically ambiguous. For example, if officer-involved
killings cause citizens to perceive higher rates of local crime, changes in turnout could reflect
support for more intensive policing (Cummins, 2009). On the other hand, these events may
raise concerns about institutional discrimination or police accountability such that citizens
are spurred to reform the system.
To disentangle mechanisms, we examine differential effects based on the type of weapon
possessed by the deceased. If voters are motivated by heightened concerns about crime,
we would expect larger effects following police killings of armed suspects, which may have
resulted in the the most gunfire or involved individuals who posed the greatest danger to the
community. If instead voters are mobilized by perceptions of government misconduct, then
we would expect the largest effects to stem from killings of unarmed individuals.
Results are shown in Panel F of Figure III.22 Notably, estimates are small or insignificant
for police killings of individuals armed with a knife or a gun and for incidents where we do
not have weapon information. However, police killings of unarmed individuals lead to large
increases in participation of 11.5 registrations (14% of the pre-killing mean, p = 0.025) and
4.7 votes (12% of the pre-killing mean, p = 0.041). Though coefficients are only different
from each other at the 10% level due to limited power (p = 0.087 comparing βreg for unarmed
killings versus all other killings combined), the stark pattern of effects suggest that voters
are responding to the perceived “reasonableness” of officer-involved actions as much as to
the violence itself (Braga et al., 2014).
As corroboration, we test whether police killings affected support for criminal justice
reforms using referenda data. Specifically, we examine block-level vote shares for California
Proposition 66 in 2004 and California Proposition 5 in 2008, both of which sought to reduce
criminal penalties for lower-level offenses. While these propositions were narrowly defeated,
they provide a local measure of policy preferences and potential insight into beliefs about
21
22
As further evidence, work by Hobbs et al. (2014) suggests that family deaths decrease voter turnout.
Full event studies providing evidence of parallel pre-trends are included in Appendix Figure A.V.
13
law enforcement.23
We estimate the following difference-in-differences model:
yb,t = δb + δt + βT reatb × P ostt + b,t ,
(4)
where yb,t is the share of Yes ballots cast for Proposition 66 in 2004 and the share of Yes ballots
cast for Proposition 5 in 2008. T reatb is an indicator for Census blocks that experienced
a police killing between the 2004 and 2008 elections, while P ostt is a 2008 indicator. To
improve internal validity, the sample is restricted only to blocks in treated block groups.
Standard errors are clustered by block group.
[Table II about here.]
As shown in Column 1 of Table II, we find that support for criminal justice reform
increased significantly in blocks that experienced a police killing relative to other blocks in
the same neighborhoods. Column 2 disaggregates the treatment effect across armed and
unarmed killings and finds marginally significant increases in support for criminal justice
reform across both types of events. However, point estimates for unarmed killings are three
times as large as those for armed killings (0.133 versus 0.044). This is consistent with the
differential effects on turnout and registration and suggests that acts of police violence that
appear less “reasonable” provoke more skepticism of the criminal justice system.
Given that only two relevant referenda exist during our sample period, we are unable to
examine pre-trends. To address lingering validity concerns, we instead conduct a placebo
test examining how support for criminal justice reform changed in future treatment areas.
That is, we estimate Equation 4 on referenda voting in 2004 and 2008 on the sample of
neighborhoods that experienced a police killing between 2008 and 2010. The placebo treatment group is comprised of blocks treated after 2008, while the control group is limited to
untreated blocks in those same block groups.
These results are shown in Columns 3 and 4. Notably, placebo treatment estimates are
insignificant and very near zero in all cases. This is analogous to support for parallel pretrends among future treaters and suggests that our actual treatment estimates reflect the
impact of police killings as opposed to other confounds.
Taken together, these results indicate that the effects of police violence on civic engagement are driven by individuals opposed to law enforcement actions. Our findings suggest
that these individuals may be mobilized by killings that appear the least justified and may
seek to reform the criminal justice system, at least partially, through the electoral process.
23
Proposition 66 failed by a 52.7% to 47.3% margin and Proposition 5 by a 59.5% to 40.5% margin.
14
VI
Conclusion
This paper documents the causal impact of police killings on local political participation.
We find that acts of extreme police violence significantly increase voter registration and
turnout among nearby residents. These effects are driven by new registrations among historically under-enfranchised groups – young blacks and Hispanics. Strikingly, gains in civic
engagement are largest following police killings of unarmed individuals and are accompanied by increased support for criminal justice reforms. Together, our results add to growing
evidence of the social sequelae of police use of force (Bor et al., 2018; Legewie, 2019; Ang,
2020).
In doing so, this paper provides empirical complement to a long history of concerns
around race and policing. In 1968, the Kerner Commission reported on the deep-rooted
belief among many minorities of a “double-standard of justice and protection.” Our findings
suggest that such beliefs continue to permeate communities of color today and that acts
of police violence may exacerbate those concerns. While the existing literature has focused
primarily on the relationship between law enforcement and crime (Evans and Owens, 2007;
Chalfin and McCrary, 2018; Mello, 2019), this paper highlights the need for further research
exploring the multi-faceted impact of police on other aspects of community well-being. Such
an accounting is critical both to the design of law enforcement policy and to the welfare of
underserved neighborhoods.
15
References
Ang, D. (2020). The effects of police violence on inner-city students. Quarterly Journal of
Economics.
AP-NORC (2015). Law enforcement and violence: the divide between black and white
americans. Technical report.
Bateson, R. (2012). Crime victimization and political participation. American Political
Science Review , 570–587.
Bellows, J. and E. Miguel (2006). War and institutions: New evidence from sierra leone.
American Economic Review 96 (2), 394–399.
Bertrand, M., E. Duflo, and S. Mullainathan (2004). How much should we trust differencesin-differences estimates? The Quarterly journal of economics 119 (1), 249–275.
Blattman, C. (2009). From violence to voting: War and political participation in uganda.
American political Science review , 231–247.
Bor, J., A. S. Venkataramani, D. R. Williams, and A. C. Tsai (2018). Police killings and
their spillover effects on the mental health of black americans: a population-based, quasiexperimental study. The Lancet 392 (10144), 302–310.
Braga, A. A., C. Winship, T. R. Tyler, J. Fagan, and T. L. Meares (2014). The salience of
social contextual factors in appraisals of police interactions with citizens: a randomized
factorial experiment. Journal of quantitative criminology 30 (4), 599–627.
Buchanan, L., Q. Bui, and J. Patel (2020, July). Black lives matter may be the largest
movement in u.s. history. The New York Times.
Bureau, C. F. P. (2014). Using publicly available information to proxy for unidentified race
and ethnicity: A methodology and assessment. Washington, DC: CFPB, Summer .
Chalfin, A. and J. McCrary (2018). Are us cities underpoliced? theory and evidence. Review
of Economics and Statistics 100 (1), 167–186.
Collins, W. J. and R. A. Margo (2007). The economic aftermath of the 1960s riots in american
cities: Evidence from property values. The Journal of Economic History, 849–883.
Cummins, J. (2009). Issue voting and crime in gubernatorial elections. Social Science
Quarterly 90 (3), 632–651.
Davis, E., A. Whyde, and L. Langton (2018). Contacts between police and the public, 2015.
Bureau of Justice Statistics. US Department of Justice.
Desmond, M., A. V. Papachristos, and D. S. Kirk (2016). Police violence and citizen crime
reporting in the black community. American Sociological Review 81 (5), 857–876.
16
DiPasquale, D. and E. L. Glaeser (1998). The los angeles riot and the economics of urban
unrest. Journal of Urban Economics 43 (1), 52–78.
Enos, R. D., A. R. Kaufman, and M. L. Sands (2019). Can violent protest change local
policy support? evidence from the aftermath of the 1992 los angeles riot. American
Political Science Review 113 (4), 1012–1028.
Evans, W. N. and E. G. Owens (2007). Cops and crime. Journal of Public Economics 91 (12), 181–201.
Finch, B. K., A. Beck, D. B. Burghart, R. Johnson, D. Klinger, and K. Thomas (2019). Using
crowd-sourced data to explore police-related-deaths in the united states (2000–2017): The
case of fatal encounters. Open Health Data 6 (1).
Fryer Jr, R. G. (2016). An empirical analysis of racial differences in police use of force.
Technical report, National Bureau of Economic Research.
Gamson, W. A. and J. McEvoy (1970). Police violence and its public support. The Annals
of the American Academy of Political and Social Science 391 (1), 97–110.
Gilens, M. and B. I. Page (2014). Testing theories of american politics: Elites, interest
groups, and average citizens. Perspectives on politics 12 (3), 564–581.
Hobbs, W. R., N. A. Christakis, and J. H. Fowler (2014). Widowhood effects in voter
participation. American Journal of Political Science 58 (1), 1–16.
King, G. (2013). A solution to the ecological inference problem: Reconstructing individual
behavior from aggregate data. Princeton University Press.
Kirk, D. S. and A. V. Papachristos (2011). Cultural mechanisms and the persistence of
neighborhood violence. American journal of sociology 116 (4), 1190–1233.
Lauderdale, D. S. and B. Kestenbaum (2000). Asian american ethnic identification by surname. Population Research and Policy Review 19 (3), 283–300.
Legewie, J. (2019). Police violence and the health of black infants. Science advances 5 (12),
eaax7894.
Lerman, A. E. and V. Weaver (2014a). Staying out of sight? concentrated policing and
local political action. The ANNALS of the American Academy of Political and Social
Science 651 (1), 202–219.
Lerman, A. E. and V. M. Weaver (2014b). Arresting citizenship: The democratic consequences of American crime control. University of Chicago Press.
Madestam, A., D. Shoag, S. Veuger, and D. Yanagizawa-Drott (2013). Do political protests
matter? evidence from the tea party movement. The Quarterly Journal of Economics,
qjt021.
17
Mazumder, S. (2018). The persistent effect of us civil rights protests on political attitudes.
American Journal of Political Science 62 (4), 922–935.
Mello, S. (2019). More cops, less crime. Journal of public economics 172, 174–200.
Morgan, R. O., I. I. Wei, and B. A. Virnig (2004). Improving identification of hispanic males
in medicare: use of surname matching. Medical Care, 810–816.
Morin, R., K. Parker, R. Stepler, and A. Mercer (2017). Behind the badge. Pew Research
Center 11.
Passarelli, F. and G. Tabellini (2017). Emotions and political unrest. Journal of Political
Economy 125 (3), 903–946.
Sønderskov, K. M., P. T. Dinesen, S. E. Finkel, and K. M. Hansen (2020). Crime victimization increases turnout: Evidence from individual-level administrative panel data. British
Journal of Political Science.
Sunshine, J. and T. R. Tyler (2003). The role of procedural justice and legitimacy in shaping
public support for policing. Law & society review 37 (3), 513–548.
Taylor, T. J., K. B. Turner, F.-A. Esbensen, and L. T. Winfree (2001). Coppin’an attitude:
Attitudinal differences among juveniles toward police. Journal of Criminal Justice 29 (4),
295–305.
Tyler, T. R., J. Fagan, and A. Geller (2014). Street stops and police legitimacy: Teachable
moments in young urban men’s legal socialization. Journal of empirical legal studies 11 (4),
751–785.
Wasow, O. (2020). Agenda seeding: How 1960s black protests moved elites, public opinion
and voting. American Political Science Review , 1–22.
Weaver, V. M. and A. E. Lerman (2010). Political consequences of the carceral state. American Political Science Review , 817–833.
Wei, I. I., B. A. Virnig, D. A. John, and R. O. Morgan (2006). Using a spanish surname
match to improve identification of hispanic women in medicare administrative data. Health
Services Research 41 (4p1), 1469–1481.
Weitzer, R. and S. A. Tuch (2002). Perceptions of racial profiling: Race, class, and personal
experience. Criminology 40 (2), 435–456.
Weitzer, R. and S. A. Tuch (2006). Race and policing in America: Conflict and reform.
Cambridge University Press.
White, A. (2019). Family matters? voting behavior in households with criminal justice
contact. American Political Science Review 113 (2), 607–613.
White, A. et al. (2019). Misdemeanor disenfranchisement? the demobilizing effects of brief
jail spells on potential voters. American Political Science Review 113 (2), 311–324.
18
White, C., D. Weisburd, and S. Wire (2018). Examining the impact of the freddie gray
unrest on perceptions of the police. Criminology & Public Policy 17 (4), 829–858.
Zimring, F. E. (2017). When police kill. Harvard University Press.
19
Figure I: Effects by Distance From Police Killing
0
~
0
~~
o
§~
=
ao
a::
(I)
I
T l
T.L
Ta
T
(0• .1)
(.1. .2)
(.2. .3)
(.3. . 4)
(.4.. 5)
Tl
..
OI
• 1
Tl
U
•e
k i
• ·
•• •• ••
(.7...8)
(.8..9)
(.9. 1)
(1. 1.1) ( 1.1. 1.2) ( 1.2. 1.3) ( 1.3. 1.4) ( 1.4. 1.5) ( 1.5. 1.6) ( 1.6. 1.7) ( 1.7. 1.8) ( 1.8. 1.9) (1.9. 2)
' •
Tl
20
• •
T. a i
'I?
In CS
(.5. .6)
(.6. 7)
(2.~)
Distance from police killing (miles)
[ • Election FEs
• Block Group-Election FEs
Notes: Figure reports coefficients from regressions of registration count on mutually-exclusive indicators describing the distance of a given Census
block to a police killing. The sample spans 2002 to 2010 general elections. Indicators track a census block’s (cumulative) minimum distance to
shootings that occurred prior to a given election. The first indicator – “In CB” – describes whether or not the killing occurred inside the given census
block. The rest partition Census blocks not directly exposed to a killing into 0.1-mile bins. We set the reference group to blocks between 0.7 and 0.8.
We include Census block and population-decile-by-election fixed effects in all specifications. For red dots, we additionally include Census block group
(CBG) by election fixed effects. In the CBG specification, distance indicators are set to 0 within CBG so that neighboring blocks are not mechanically
biased downwards through the neighborhood-election fixed effects. All standard errors are clustered at the CBG-level.
Figure II: Effects on Civic Engagement
Panel A: Registrations
Panel B: Votes
<D
<D
•
j
I
N
I
"'1"
"'1"
•
•
"?
"?
-4
-3
-2
-1
0
-4
Elections to Killing
-3
-2
-1
0
Elections to Killing
Notes: Figure shows treatment estimates and 95 percent confidence intervals from estimation of Equation 2
on registrations (pre-treatment mean = 79.6) and votes (pre-treatment mean = 39.1). Unit of observation
is registrations/votes in a Census block-election. Standard errors are clustered by Census block group. The
sample spans the 2002 to 2010 general elections and treatment is defined by blocks where police killings
occurred during the sample period. Red vertical line represents time of treatment.
21
Figure III: Heterogeneous Effects
Panel A: Voter Race
Panel B: Age
I!)
LO
-.;:t-
"""
(")
Cl)
§N
0
()
0
C")
I f If
(J)
c::lN
0
()
0
0
◄►
"";"
If
0
0
◄►
'7
Black
Hispan ic
I•
Registration s
♦
18-34 years
Wh ite/Asian
35-54 years
I·
Votes
Panel C: Years Registered
Registrations
♦
55+ years
Votes
I
Panel D: Party Affiliation
LO
LO
"""
C")
(J)
c::lN
0
()
0
(J)
I
c::lN
0
()
-+-- - - - - - - - t - - - + - - - - - - + - - - - + - - - - - - + - ---'!'--
0-3 years
4-7 years
8-11 years
I•
♦
Registrations
Votes
0
12-15 years
Democrat
I
Media Coverage
Independent
I•
Panel E: Media Coverage and Location
0
N
I
-+-- - - - - - - - - - - + - - - - + - - - - - - - - + - - - - + - - -
Registrations
♦
Republican
Votes
I
Panel F: Deceased Weapon
Near Deceased Home
0
N
mo
c..::i
0
()
LO
0
I
-+-- - ~ ~ - - - - + - - - + - - - - - - - --
------+----+--
LC?
Yes
Yes
No
I • Regi strations
♦
Votes
Unarmed
No
I
Knife
I•
Registrations
Gun
♦
Votes
Unknown
I
Notes: Panels A-D report coefficients from separate regressions of registrations/votes for a given voter group (i.e. by race in
Panel A, age in Panel B, years registered in Panel C and party affiliation in Panel D) on a single post-treatment indicator.
Panels E and F report coefficients from a single regression of total registrations/votes on separate post-treatment indicators for
each incident type (i.e., with/without media coverage in left pane of Panel E, near/far from the deceased’s home in right pane
of Panel E, and across deceased weapon in Panel F). Standard errors are clustered by Census block group. Unit of observation
is the Census block-election. The sample spans the 2002 to 2010 general elections and treatment is defined by blocks where
police killings occurred during the sample period.
22
Table I: Summary Statistics
Panel A: Police Killings
Panel B: Registration and Voting Sample
No Killing
All
Black/ White/
Hispanic Asian
Deceased Demographics
Black 0.29
0.35
0.00
Hispanic 0.53
0.65
0.00
White 0.15
0.00
0.85
Asian 0.03
0.00
0.15
Male 0.96
0.97
0.92
Age 30.34 28.98
36.47
Newspaper Mentions
Any 0.18
0.19
Total 0.70
0.77
Median (if any) 2.00
2.00
Weapon Type
Unarmed 0.17
0.15
Knife 0.27
0.24
Gun 0.56
0.61
Incidents
294
240
0.17
0.40
1.00
0.28
0.38
0.33
All
Killing
Treat
Ctrl
Blk Grp Blk Grp
Demographics (2000
18+ Count 97.38 189.03
White 0.39
0.16
Black 0.09
0.16
Hispanic 0.38
0.57
Asian 0.12
0.09
Other 0.02
0.02
Census)
97.30
96.99
0.21
0.40
0.16
0.08
0.51
0.37
0.10
0.12
0.02
0.03
Voter Registration (2002)
Reg. Count 54.96 79.24
46.78
White/Asian 0.59
0.34
0.38
Black 0.13
0.28
0.26
Hispanic 0.28
0.39
0.36
Ages 18-34 0.26
0.31
0.30
Ages 35-54 0.40
0.39
0.39
Democrat 0.53
0.62
0.61
Republican 0.28
0.17
0.20
Reg. < 4 yrs 0.36
0.42
0.39
Vote Count 24.04 29.21
17.97
53
Blocks 70,215
288
2,808
55.19
0.60
0.13
0.28
0.25
0.41
0.52
0.28
0.35
24.27
67,119
Panel A provides summary statistics for the police killings data, separately for killings of Blacks and
Hispanics and killings of individuals of whites and Asians. Unless otherwise noted, mean values reported.
Newspaper mentions come from a search of each incident by suspect name in six local newspapers including
the Los Angeles Times. Any is an indicator for whether the incident was mentioned in any article, Total
is the number of articles mentioning the incident. Median is the median number of articles, conditional
on being mentioned. Unarmed refers to suspects that did not have a weapon, gun refers to suspects with
firearms (including BB guns and replicas), knife refers to suspects with any other type of weapon (values
are the share of each weapon type among incidents with contextual details). We were unable to obtain contextual information about weapon type from District Attorney reports and other sources for 16% of incidents.
Panel B provides summary statistics for the Census blocks included in the main analysis. The remaining columns are mutually-exclusive sub-samples. “Killing” refers to blocks where a killing occurred
during the sample period. “Treat Blk Grp” refers to untreated blocks in the same block group as a block
with a killing. “Ctrl Blk Grp” refer to all other blocks (i.e., blocks in block groups without police killings).
Pop. 18+ refers to population 18 or older in the 2000 Census. Race categories are mutually exclusive
categories from the 2000 Census as defined the main text. Registration data are restricted to 2002 general
election.
23
Table II: Effects on Support for Criminal Justice Reform
DV = Support for Criminal Justice Reform (%)
Actual Treatment
(1)
(2)
0.057**
(0.029)
0.043∧
(0.031)
0.133*
(0.078)
Placebo Treatment
(3)
(4)
0.000
(0.030)
0.024
(0.046)
-0.018
(0.102)
2004 Mean
0.403
0.419
Shootings
Obs.
Blocks
2004-2008
2,736
1,368
2008-2010
1,322
661
Treat x Post
x Armed
x Unarmed
Table reports results from estimation of Equation 4 on the fraction of ballots cast in favor of referenda that
would have lessened criminal justice penalties for lower-level offenses (i.e. California Proposition 66 in 2004
and California Proposition 5 in 2008). Data are restricted to Census block groups that experienced a killing
between 2004-2008 in the “Actual Treatment” sample or that experienced a killing between 2008-2010 in
the ‘Placebo Treatment” sample. Treatment is defined by blocks where a police killing occurred. Columns
1 and 3 report changes in pro-reform support between 2004-2008 for blocks with actual (placebo) police
killings, while Columns 2 and 4 interact the treatment (placebo) indicator with armed (i.e., knife, gun or
unknown) and unarmed indicators. All standard errors are clustered at the block group level. *** p < 0.01,
** p < 0.05, * p < 0.10, and ∧ p < 0.20.
24
Civic Responses to Police Violence
Desmond Ang and John Tebes
Online Appendix
Figure A.I: Effects on Homicides
l!)
.,-
-
.,-
-
Cl) l!)
Q)
~
0
-0
·c::5
0
E
0
IO
0
,.
0
I
I~
--
•
4J
4J
0
0
.,-
.,
,.
0
l!)
0
0
-
I
I
I
I
I
I
I
I
I
I
I
I
I
I
I
I
I
-8
-7
-6
-5
-4
-3
-2
-1
0
1
2
3
4
5
6
7
8
Years to Killing
Notes: Figure shows treatment estimates and 95 percent confidence intervals from estimation of Equation
2 on homicides. Unit of observation is number of homicides in a Census block-year. Standard errors are
clustered by Census block group. The sample spans the 2002 to 2010 elections and treatment is defined by
blocks where police killings occurred during the sample period. Red vertical line represents time of treatment.
1
Figure A.II: Effects on Voter Registration (2002-2016)
0
N
I.()
......
(/)
Co
.Q ..-
--....
!
!
!
C1l
- ~ I.()
0)
Q)
0:::
0
I.()
I
0
......
I
-7
-6
-5
-4
-3
-2
-1
0
1
2
3
4
5
6
Elections to Killing
Notes: Figure shows treatment estimates and 95 percent confidence intervals from estimation of Equation 2
on registrations (pre-treatment mean = 85.7) on the extended sample. Unit of observation is registrations in
a Census block-election. Standard errors are clustered by Census block group. The sample spans the 2002
to 2016 general elections and treatment is defined by blocks where police killings occurred during the sample
period. Red vertical line represents time of treatment.
2
Figure A.III: Validation of Predicted Race Counts
Panel B: White (Treatment Blocks)
Panel A: White (Control Blocks)
c
c
"iii
"iii
C
C
Q)
Q)
0
0
mean= -.176
-50
-25
o
25
mean= .968
-50
50
-25
Error
o
25
50
Error
Panel C: Black (Control Blocks)
Panel D: Black (Treatment Blocks)
c
c
"iii
"iii
C
C
Q)
Q)
0
0
mean= -.006
-50
-25
o
25
mean= -.070
-50
50
Error
-25
o
25
50
Error
Notes: Figure shows histograms validating estimated vote counts by race obtained from Equation 3 against
estimates predicted from individual-level voter registration file extracted on February 4, 2011. Each voter’s
race is predicted from the registration file using surname and address based on the Consumer Financial
Protection Bureau’s Bayesian Improved Surname Geocoding method (Bureau, 2014). A voter is classified as
Black (white) if his/her predicted probability of being Black (white) exceeds that of any other race group.
Vote counts are then aggregated to Census block. Histograms show the algebraic difference between 2010
estimates from Equation 3 and corresponding voter file estimates, separately for whites/Blacks and Census
blocks that did/not experience a police killing during the sample period.
3
Figure A.IV: Additional Heterogeneity
Panel B: Election Type
Panel A: Deceased Race
Black/H ispanic Voters
White/Asian Voters
<D
<D
....
(/)
c::lN
'
t
-------------r----+-t ---+--+---
0
0
◄►
◄
0
0
~
~ ~--~-----~-----~-----~--Black/Hisp
Killings
White/Asian
Killings
I•
♦
Reg istrations
Votes
Presidential
Elections
White/Asian
Killings
Black/Hisp
Killings
I
I•
Reg istrations
♦
Votes
I
Midterm
Elections
Panel C: Incident Timing
~
co
<D
2...C
::,
0
ON
0
I
f
◄►
~
..,.
<1 Year from Election
I•
>1 Year from Election
Reg istrations
♦
Votes
I
Notes: Panel A reports coefficients from regression of registration/votes on separate post-treatment dummies for Black/Hispanic killings and white/Asian killings. Left pane examines effects on Black/Hispanic participation, right pane on white/Asian participation. Panel B reports coefficients for separate post-treatment
dummies for presidential and midterm elections. Panel C reports coefficients for separate post-treatment
dummies for killings that occurred less than 1 year from the next general election and for killings that occurred between 1 and 2 years from the next general election. Standard errors are clustered by Census block
group. Unit of observation is the Census block-election. The sample spans the 2002 to 2010 general elections
and treatment is defined by blocks where police killings occurred during the sample period.
4
Panel A: Unarmed
Panel B: Armed
Figure A.V: Effects by Deceased Weapon (Event Study)
0£
0£
01:
0~
0~
0 ~0
SlUno:::i
01:-
•
0
0 ~SlUno:::i
01:-
5
0£-
OJ
C
(/)
Q)
~
oS:::
.8
♦
(f)
C
0
"7U
~
OJ
OS:'.
.8
(f)
C
~
<7
:.:;
(/)
0
C
•
Q)
"o,
uJ
Cl:'.
U)
~
Q)
<7
""!"
0£-
N
-~ g
2
(/)
♦
(/)
0
"";TI ~
U)
0
C
Q)
"o,
uJ
Cl:'.
Q)
•
Notes: Figure shows treatment estimates and 95 percent confidence intervals from estimation of Equation 2 on registrations (pre-treatment mean =
79.6) and votes (pre-treatment mean = 39.1). Unit of observation is registrations/votes in a Census block-election. Panel A restricts treatment group
to killings of individuals who were unarmed. Panel B restricts treatment group to killings of individuals armed with a knife or gun or whose weapon
was unknown. Standard errors are clustered by Census block group. The sample spans the 2002 to 2010 general elections and treatment is defined
by blocks where police killings occurred during the sample period. Red vertical line represents time of treatment.
N
6
(2)
Main
351,075
Model
Obs.
39.05
1.787**
(0.867)
79.59
39.05
1.792**
(0.869)
Panel B: Votes
79.59
3.764***
(1.292)
Panel A: Registration
(4)
39.05
1.498*
(0.846)
79.59
3.311***
(1.275)
(5)
38.67
1.820**
(0.872)
78.84
3.682***
(1.289)
(6)
351,075
351,075
351,075
351,075
351,070
Homicide % Minority Pop. Aged 10-17
Use 2010
Drop MultiControls x Elect. FE Quin. x Elect. FE Census Pop.
Treaters
39.05
1.817**
(0.869)
79.59
3.814***
(1.291)
(3)
547,910
Full
Sample
33.60
1.394*
(0.744)
68.57
3.202***
(1.079)
(7)
315,020
Reg. in 2002
≥ 10
40.61
1.638*
(0.877)
82.79
3.396***
(1.313)
(8)
Table shows results from estimation of Equation 2 on registrations and votes, replacing time to treatment indicators with a single post-treatment
dummy. Column 1 examines our preferred specification. Column 2 controls for the number of homicides in a block in the two years preceding each
election. Column 3 includes minority share quintile by election fixed effects. Column 4 adds quintiles of population aged 10-17 in 2000 by election
fixed effects. Column 5 replaces 2000 voting population estimates with 2010 voting population measures. Column 6 drops the single Census block that
experienced more than one police killing during the sample period. Column 7 includes all Census blocks, even those with less than 5 people aged 18
or older in 2000. Column 8 restricts the sample to Census blocks with 10 or more registered voters in 2002. Unit of observation is the block-election.
The sample period spans the 2002 to 2010 general elections. Standard errors clustered by Census block group. *** p < 0.01, ** p < 0.05, * p < 0.10,
and ∧ p < 0.15.
39.05
1.815**
(0.869)
Treat x Post
Pre-Treat Mean
79.59
Pre-Treat Mean
Treat x Post 3.820*** 3.823***
(1.291)
(1.291)
(1)
Table A.I: Effects on Civic Engagement: Alternative Specifications


