

Community Alliance on Prisons How Hawaii Can Have Fewer Inmates and Safer Communities 2010
Download original document:
Document text
Document text
This text is machine-read, and may contain errors. Check the original document to verify accuracy.
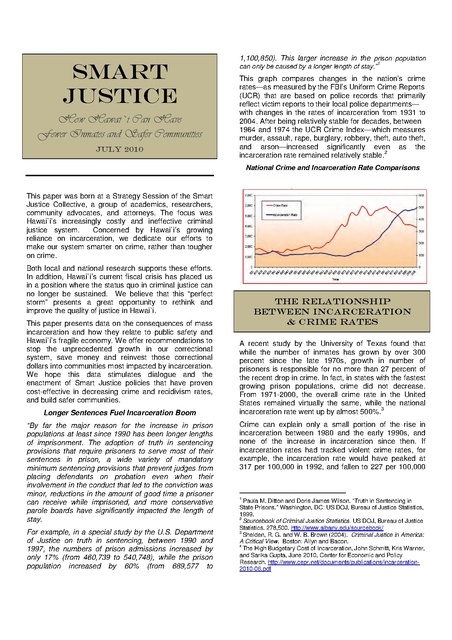
SMART JUSTICE How Hawai`i Can Have Fewer Inmates and Safer Communities July 2010 1,100,850). This larger increase in the prison population can only be caused by a longer length of stay.” 1 This graph compares changes in the nation’s crime rates—as measured by the FBI’s Uniform Crime Reports (UCR) that are based on police records that primarily reflect victim reports to their local police departments— with changes in the rates of incarceration from 1931 to 2004. After being relatively stable for decades, between 1964 and 1974 the UCR Crime Index—which measures murder, assault, rape, burglary, robbery, theft, auto theft, and arson—increased significantly even as the 2 incarceration rate remained relatively stable. National Crime and Incarceration Rate Comparisons This paper was born at a Strategy Session of the Smart Justice Collective, a group of academics, researchers, community advocates, and attorneys. The focus was Hawai`i’s increasingly costly and ineffective criminal justice system. Concerned by Hawai`i’s growing reliance on incarceration, we dedicate our efforts to make our system smarter on crime, rather than tougher on crime. Both local and national research supports these efforts. In addition, Hawai`i’s current fiscal crisis has placed us in a position where the status quo in criminal justice can no longer be sustained. We believe that this “perfect storm” presents a great opportunity to rethink and improve the quality of justice in Hawai`i. This paper presents data on the consequences of mass incarceration and how they relate to public safety and Hawai`i’s fragile economy. We offer recommendations to stop the unprecedented growth in our correctional system, save money and reinvest those correctional dollars into communities most impacted by incarceration. We hope this data stimulates dialogue and the enactment of Smart Justice policies that have proven cost-effective in decreasing crime and recidivism rates, and build safer communities. Longer Sentences Fuel Incarceration Boom “By far the major reason for the increase in prison populations at least since 1990 has been longer lengths of imprisonment. The adoption of truth in sentencing provisions that require prisoners to serve most of their sentences in prison, a wide variety of mandatory minimum sentencing provisions that prevent judges from placing defendants on probation even when their involvement in the conduct that led to the conviction was minor, reductions in the amount of good time a prisoner can receive while imprisoned, and more conservative parole boards have significantly impacted the length of stay. For example, in a special study by the U.S. Department of Justice on truth in sentencing, between 1990 and 1997, the numbers of prison admissions increased by only 17% (from 460,739 to 540,748), while the prison population increased by 60% (from 689,577 to The Relationship Between Incarceration & Crime Rates A recent study by the University of Texas found that while the number of inmates has grown by over 300 percent since the late 1970s, growth in number of prisoners is responsible for no more than 27 percent of the recent drop in crime. In fact, in states with the fastest growing prison populations, crime did not decrease. From 1971-2000, the overall crime rate in the United States remained virtually the same, while the national 3 incarceration rate went up by almost 500%. Crime can explain only a small portion of the rise in incarceration between 1980 and the early 1990s, and none of the increase in incarceration since then. If incarceration rates had tracked violent crime rates, for example, the incarceration rate would have peaked at 317 per 100,000 in 1992, and fallen to 227 per 100,000 1 Paula M. Ditton and Doris James Wilson. “Truth in Sentencing in State Prisons.” Washington, DC: US DOJ, Bureau of Justice Statistics, 1999. 2 Sourcebook of Criminal Justice Statistics. US DOJ, Bureau of Justice Statistics. 278,500. http://www.albany.edu/sourcebook/ 3 Shelden, R. G. and W. B. Brown (2004). Criminal Justice in America: A Critical View. Boston: Allyn and Bacon. 4 The High Budgetary Cost of Incarceration, John Schmitt, Kris Warner, and Sarika Gupta, June 2010, Center for Economic and Policy Research. http://www.cepr.net/documents/publications/incarceration2010-06.pdf by 2008 – less than one third of the actual 2008 level and about the same level as in 1980.4 Proponents of prison expansion have heralded this 5 growth as a smashing success. But a large number of studies contradict that claim. Most scientific evidence suggests that there is little if any relationship between fluctuations in crime rates and incarceration rates. In many cases, crime rates have risen or declined independent of imprisonment rates. New York City, for example, has produced one of the nation’s largest declines in crime in the nation while significantly 6 reducing its jail and prison populations. Studies find “no consistent relationship between incarceration rates and crime rates”7 and “no support for the ‘more prisoners, 8 less crime’ thesis. One study discovered an initial decrease in crime related to increases in rates of incarceration, but no decrease from further increases in 9 incarceration. in and out of prison, which serves to disrupt the community and family structure that would otherwise 12 produce low crime rates. If Hawai`i wishes to reduce its crime rate, it will need to look at factors other than imprisonment. The data shows that increasing incarceration is the lease effective way of reducing crime. It is well-known that if properly assessed and assigned to well-structured programs, individuals who complete 13 those programs have lower recidivism rates. Hawai`I’s corrections budget The Costs of Incarceration v. Parole and Probation 140 120 100 80 60 40 20 0 Stricter sentencing policies, particularly for drug-related offenses, rather than rising crime, are the main culprit behind skyrocketing incarceration rates. The last three decades have seen the implementation of new “tough on crime” policies such as three-strikes laws, truth in 10 sentencing laws, and mandatory minimums. Thus, the available evidence suggests that the higher rates of incarceration have made some contribution to lowering the crime rate, either by acting as a deterrent or by warehousing offenders during the ages in their lives when they are most likely to commit crimes. But, the impact of incarceration on crime rates is surprisingly small, and must be weighed against both its high monetary costs to government budgets and its high social costs to prisoners, their families, and their 11 communities.” Increasing imprisonment can also result in the “churning” of large segments of the largely young male population Growing the prison industrial complex by sending our tax dollars outside of Hawai`i Since 2000, appropriations for the Department of Public Safety have increased from $128M to $243.7M in 2009, an increase of 90% during that timeframe. Meanwhile, money spent to send prisoners to contract prisons has increased from $20M to a requested $66.2M in 2011, a 221% increase. As it stands now, 31.5% of PSD’s general fund operating appropriations goes toward incarcerating prisoners outside of Hawai`i; this is up from 15.6% in 2000. 5 John DiIulio. “Prisons Are a Bargain, by Any Measure.” New York Times 26 Jan. 1996: A19. 6 Downsizing Prisons: How to Reduce Crime and End Mass Incarceration. New York: NYUP, 2005. 37, 113, 125-27. 7 Michael Lynch. “Beating a Dead Horse: Is There Any Basic Empirical Evidence of the Deterrent Effect of Imprisonment.” Crime, Law and Social Change 31.4 (1999): 361. 8 Tomislav V. Kovandzic and Lynne M. Vieratis. “The Effect of CountryLevel Prison Population Growth on Crime Rates.” Criminology & Public Policy 5.2 (2006): 234. 9 Raymond Liedka, Anne Morrison Piehl, and Bert Useem. “The CrimeControl Effect of Incarceration: Does Scale Matter?” Criminology & Public Policy 5.2 (2006): 245-76. 10 Public Safety Performance Project (2007, 2008a), Abramsky (2007), Western (2006), Stemen, Rengifo, and Wilson (2006), and Benson (2009). 11 The High Budgetary Cost of Incarceration, John Schmitt, Kris Warner, and Sarika Gupta, June 2010, Center for Economic and Policy Research. http://www.cepr.net/documents/publications/incarceration2010-06.pdf $300,000,000 $250,000,000 Dept. of Public Safety Budget Contracts for Prison Beds Outside HI $200,000,000 $150,000,000 $100,000,000 $50,000,000 $0 2000 2009 2010 2011 Hawai`i budgeted more than $60 million for non-state facilities (private and federal prison beds) in 2010 and more than $66 million for fiscal year 2011. 12 REDUCING AMERICA’S CORRECTIONAL POPULATION: A STRATEGIC PLAN. James Austin, JFA Institute, Justice Research and Policy, Vol. 12, No. 1, 13 California Expert Panel on Adult Offender and Recidivism Programming, 2007. The costs for the Arizona (CCA – Corrections Corporation of America) and the Federal Detention Center (FDC) contracts represent only the housing costs. The CCA – Arizona rate does not include: Mass inmate transport, small transport, inter-island transport, medical costs, site inspection; other inmate service costs, on-site monitoring, and a buffer of 5%, projected to be more than $13 million for fiscal years 2010 and 2011. The non-state facility rate also does not include the costs of settlements and judgments for violations borne by the taxpayers. There are no programs at FDC; therefore, any programs offered Hawai`i’s incarcerated individuals are an additional cost. Contract monitoring costs for PSD’s Mainland branch administration are projected to be almost $450,000 for 2010 and 2011. The Department of Business, Economic Development &Tourism reports that for every dollar shipped outside of Hawai`i, we lose $3 in economic activity. Hence, shipping millions of dollars out of Hawai`i each year means revenue and jobs lost locally. Using the multiplier effect, that would be close to $200 million circulating in our economy. Corrections Budget Far Outpaces Higher Education The Pew Center reports that while Hawai`i’s corrections budget was virtually doubling, higher education funding increased by a far more modest amount: only 21%. How are we paying for all of this? We are taking funds from higher education. The corrections system ultimately takes money from higher education and uses it for incarceration by building cells instead of classrooms. This is the easiest place from which to take money. For example, the University of Hawai`i at Manoa witnessed the nation’s highest tuition increase. Dr. Meda ChesneyLind, a leading feminist criminologist, asserts that when students at the University of Hawai`i pay higher tuition 14 rates they are really funding cells with their tuition. The Questions That Must Be Asked What are the social costs of shipping individuals, many of whom are parents, thousands of miles away from `ohana? Research reveals that children who have an incarcerated parent are six to seven times more likely to end up incarcerated themselves. Studies have illustrated the connection between visitation and recidivism. This classic study, conducted by Holt and Miller (1972), showed that California prisoners who have regular, continuing visits with (at least three) family members had significantly lower recidivism rates compared with those who do not have such visits throughout their prison term. Prisoners with no visitors 14 Ann and Me, Chesney-Lind, Meda, Unlocking Justice Conference Proceedings, October 17, 2009, p.14. were six times more likely to re-enter prison during the first year of parole as those with three or more visitors. We’re all willing to spend some money to promote public safety, but at what cost? This economic crisis has added additional stressors that challenge Hawai`i’s budget for delivery of vital social services. Are our tax dollars enhancing public safety or are we actually increasing criminal behavior? Inmates sentenced under Hawaii’s misguided drug laws serve an average of 39 months in prison. This means that average drug sentences for Hawai`i surpass those of New York State, with its notoriously harsh Rockefeller drug laws, where drug sentences average 29 months. What are we getting for keeping these individuals an additional 10 months in a cell? Does shipping incarcerated individuals outside of Hawai`i promote success when they are released? The majority of Hawai`i’s incarcerated individuals are classified as Community or Minimum custody, the least restrictive levels of incarceration. Sending the majority of Hawai`i’s prison population abroad to medium security prisons with questionable programming does not promote successful reentry. Chapter 353H, HRS, requires that an individual with a year left on his sentence should come back to Hawai`i to prepare for reentry. “Hawai`i can’t support the criminal justice policies it has chosen – that’s why you send so many inmates to be housed on the mainland. When you can’t afford to keep your inmates in-state, it’s a pretty good indication that there’s over-reaching going on, and that it’s time to re-examine those policies.”15 HAWAI`I’s justice crisis 16 The 2009 World Incarceration Rates reports the U.S. leads the world as the largest incarcerator at 756 incarcerated individuals per 100,000 national population. If Hawai`i was recognized as its own country, it would rank as the 5th largest incarcerator in the world with 332 incarcerated individuals per 100,000 population, just behind South Africa, who incarcerates 334 individuals per 100,000 citizens. “Social concern about substance abuse has put policymakers in a bind. On the one hand, many taxpayers prefer to see substance abusers arrested, prosecuted, and jailed for violating drug laws. On the other hand, these policies have resulted in substantial jail and prison expenses, overloaded court dockets, a need for more jail and prison space, and a growing 15 Michele Deitch, law professor aat LBJ School of Public Affairs at UT Austin, Keynote address, Unlocking Justice, October 2009. 16 World Prison Brief, produced by the International Centre for Prison Studies, Kings College, University of London, available online at: www.prisonstudies.org, retrieved January 26, 2009. recognition that incarceration per se does not address an offender’s underlying drug problem.”17 Rising incarceration, rising costs, lack of accountability, and abandonment of correctional agencies by the executive branch have led to Hawai`i’s justice crisis. The enactment of mandatory minimum sentences for ice (crystal methamphetamine) and the increasing overcriminalization of behaviors has resulted in a 60% rise in Hawai`i’s incarcerated population from 1995-2008. served by New York State drug offenders released in 2005 (29.8 months).”20 HAWAI`I’s incarcerated population Hawai`i’s prison population has grown at a faster rate 21 (2.4%) than the national average of 2.0% since 2000. “The population of the State of Hawaii increased 8.7% during the period of 1999-2008, while the number of reported Index Offenses declined 13.7% during the 18 period of 1999-2008. The total Index Crime rate in 2008 was the lowest on record since the start of statewide data collection in 1975. Hawaii’s Index Crime rate decreased in 2008, down 12.7% from the rate reported for 2007. A total of 49,454 Index Crimes were reported statewide in 2008, yielding a rate of 3,839 offenses per 100,000 resident population. The violent Index Crime rate in Hawaii decreased 1.4% in 2008, and 19 the property Index Crime rate decreased 13.4%.” Hawai`i’s budget for fiscal year 2010-2011 is $5,144,178,085 and $5,267,648,691 for fiscal year 20112012. The Department of Public Safety’s (PSD) budget for fiscal years 2010-2011 and 2011-2012 is $250,527,729, making PSD’s allocation almost 5% of the entire state budget. These figures exclude the Judiciary and other criminal justice agency costs. 7000 Everyone Pays: A Social Cost Analysis of Incarcerating Parents for Drug Offenses in Hawai’i, p.64, Lengyel, Thomas E.; Brown, Marilyn; June 2009. 18 Index Crimes - Murder, forcible rape, robbery, aggravated assault, burglary, larceny-theft, motor vehicle theft, and arson. However, due to a different method of counting, arson is not included in the totals of reported Index Crimes and Index & Part II Offenses. 19 Crime in Hawaii 2008: A Review of Uniform Crime Reports, Research & Statistics Branch, Crime Prevention & Justice Assistance Division of the Attorney General. http://hawaii.gov/ag/cpja/main/rs/Folder.2005-1205.2910/copy_of_cih2007/Crime%20in%20Hawaii%202007.pdf Prison Pop 5000 Contracted 4000 3000 2000 1000 0 Below is a chart from the Department of Public Safety’s 2008 Annual Report showing the yearly inmate population numbers. The chart on the left is the total population incarcerated by Hawai`i and includes the individuals in contracted facilities during the same year. Inmate Population* from 1970-2008 1970 300 1980 926 1985 2,045 1990 2,625 1995 3,583 2000 5,127 2001 5,412 2002 5,569 2003 5,657 2004 5,958 2005 6,092 2006 6,251 2007 6,045 2008 6,014 “Hawai’i, perhaps without fully realizing it, sponsored 197 of these extravagant semi-public dramas when it incarcerated the cohort of drug offenders who left prison in 2006. This public theater gouged a spillway draining the reservoir of the state’s tax dollars to the tune of $28,000 per day for every day of the average drug offender’s time served, or $840,000 per month. In one year’s time the state’s share of costs for this cohort summed to about $10 million, or almost the amount of additional funding recommended by the 2004 Task Force to fund the gap in substance abuse treatment for drug offenders in the state. Reframed, this means that Hawai’i would have been able to fund this need had it shortened the average sentence for drug offenders by 10 months, bringing it close to the average sentence 17 6000 Contracted Out of State Facilities 1996 300 1997 300 1998 600 1999 1,178 2000 1,079 2001 1,194 2002 1,232 2003 1,295 2004 1,579 2005 1,730 2006 1,844 2007 2,009 2008 2,014 In the 1970’s the prison population in Hawai`i numbered roughly 300. However, 39 years later, there are more than 6,000 incarcerated individuals in Hawai`i – many of these individuals are housed in the U.S. away from their family and friends. This is because there is no space to 20 Everyone Pays: A Social Cost Analysis of Incarcerating Parents for Drug Offenses in Hawai’i, p.64, Lengyel, Thomas E.; Brown, Marilyn; June 2009. http://www.alliance1.org/Research/materials/EveryonePays_Full.pdf 21 Sabol, West and Cooper 2010:18 house them in Hawai`i. She stated that this is an iissue 22 of chronic overcrowding. Female Incarcerated Population 2.00% Who is incarcerated? Community Minimum Medium 60% of the incarcerated population is comprised of people of color. Native Hawaiians are greatly overrepresented in the prison system. Hawai`i’s prison population increased by 20% - at a time of the nation’s lowest crime rate. Even with a decrease in the crime rate, though, the state’s focus was on incarceration. Part of this can be explained by who we incarcerate. In Hawai`i we mainly incarcerate low-level level drug offenders, especially female offenders. Ultimately, overcrowding 23 leads to stories of prison abuse. INMATE CLASSIFICATION Classification is a scientific assessment of who needs to 24 be confined and who does not. Research shows that over-classification classification increases the likelihood of rearrest after release. A study commissioned by the Department of Public Safety in 2007 revealed that Hawai`i has been over overclassifying our incarcerated population and failing to use tools that allow for community supervision, rather than 25 imprisonment. The majority of Hawai`i’s incarcerated population are nonviolent offenders (63% male, 84% female) and, as the following charts show, 66% of females and 54% of males are classified as Minimum or Community, the least restrictive custody levels. Male Incarcerated Population 10.00% Community Minimum 23.00% Medium Maximum 36.00% 31.00% 32.00% 48.00% Maximum 18.00% The Department of Public Safety describes custody levels as: Community: Individuals who are eligible to participate in community release programs such as work furlough, extended furlough or residential transitional living facilities; Minimum: Individuals who have demonstrated that they can function with minimum supervision in a correctional setting or in the community under direct supervision; Medium: Individuals whose institutional conduct and adjustment require frequent supervision OR intervention; Maximum: Individuals who are a threat to the safe operation of a facility. More than 95% of Hawai`i’s incarcerated population will eventually return to the community. The Classification system shall guide placement decisions, including transition into the community with adequate supervision (i.e. work furlough, electronic monitoring monito furlough, extended furlough, etc.) In so doing, prison beds will be reserved for those who need to be incarcerated. And those who can be safety placed and better served in the community, will be released. This approach will reduce the prisoner population ation and result in cost-savings cost to taxpayers since incarceration is far more costly than community supervision. ADMISSIONS TO PRISON via Revocation Revocation means the approved term of probation or parole is voided and the individual may be incarcerated if the conditions of probation or parole were violated, an individual violated the law, or associated with criminal companions. In Hawai`i many revocations are for positive drug tests. 22 Ann and Me, Chesney-Lind, Meda, 2009. Ann and Me, Chesney-Lind, Meda, 2009. 24 DOES PRISON HARDEN INMATES? A DISCONTINUITY-BASED DISCONTINUITY APPROACH, M. Keith Chen and Jesse M. Shapiro; Cowles Foundation for Research in Economics at Yale University, Cowles Foundation Discussion Paper No. 1450, January 2004. 25 Validation and Re-Design Design of the Hawaii Department of Public Safety Jail and Prison Classifications System Report, Patricia L. Hard Hardyman, PhD, September 5, 2007. 23 The Sentencing Simulati Simulation Model showed that since 2000, the annual percentage of parolee and probationer revocations admitted to prison ranged between 42.2% and 50.0% of all new prison admissions. It is expected that this percentage will continue to climb. Hawai`i does a poor jjob of preparing individuals for reentry and supporting them wh while under community supervision and over-penalizes penalizes individuals via revocation through technical violations instead of through new felony convictions. More and more of those being sent to/back to prison are already under community 100.0% supervision and end up re-incarcerated because of poor education, lack of marketable job skills, and broken family connections. Recidivism Rate Prison admissions via revocation have been a major feeder to the growing prison population (a population that has grown despite the decrease in crime). 26 In a memo to Senator Espero , the Hawai`i Paroling Authority reported, by island, the technical violations and length of time given each parolee between January 1 and December 31, 2008. In 2008, HPA revoked the parole of 244 individuals for technical violations. The combined length of time that these 244 individuals were given for what HPA calls ‘technical violations’ was 467 years. That means that HPA committed the taxpayers to more than $21 million in parole revocations in just 1 year. It is not unlikely that in the near future the majority of new prison admissions will be comprised of individuals already under community supervision. Based on a 36-month follow-up period that begins from start of probation, release to parole, or “maxed out” prison release date. Felony probationers with DAG (Deferred Acceptance of Guilt) and DANC (Deferred Acceptance of No Contest) pleas not included and felony probationers in jail/prison are excluded.) There has been a gradual decline in Hawai`i’s statewide recidivism rate over the past decade. The 2009 recidivism rate (51.3%) is 19.0% (12.2 percentage points) lower than the 2002 baseline recidivism rate (63.3%). 26 January 2009 Memo from Richard Yes, HPA to Sen. Espero detailing the 2008 parole revocations by island, technical violations, and length of time given each parolee. 27 All recidivism data from State of Hawai’i FY 2006, Recidivism Update, April 2010, Interagency Council on Intermediate Sanctions http://hawaii.gov/icis/documents/copy_of_copy_of_SARADVSI%20Exploratory%20Study%20%28Oct%202008%29.pdf 20.0% Probation *Parole **PSD 51.3% 51.2% 61.5% This decline is especially apparent for parolees, whose 51.2% recidivism rate in 2009 represents a 29.8% decline in recidivism since 2002. However, felony probationers have a 4.5% decline in recidivism, which amounts to only a marginal change in recidivism since 2002. 100.0% 90.0% 80.0% 70.0% 60.0% 50.0% 40.0% 30.0% 20.0% 10.0% 0.0% Local and national research shows that we can do something about reducing the recidivism rate. The evaluation of the MEO BEST Reintegration program highlights the efficacy of programs that are culturally appropriate. The Interagency Council on Intermediate Sanctions’ October 2009 Fiscal Year 2006 Recidivism Update defines recidivism as: 40.0% Agency Hawai`i’s 2009 Recidivism Rate = 51.3%27 Any re-arrests or revocations after the start of probation service date, released to parole date, or “maxed out” prison release date. 60.0% 0.0% Hawai`I’s recidivism rate Recidivism Rates by Agency 80.0% Recidivism Rates for Felony Probationers & Parolees 63.3% FY 1999 55.1% 52.5% 51.3% FY 2003 FY 2005 FY 2006 The Baseline recidivism study (of probationers and parolees) included 1,869 Felon Probationers and Offenders Released to Parole for the FY 2006 Cohort. The Recidivism rate for the FY 2006 cohort group was estimated at 51.6%. This is an 11.7 percentage point decline from the FY 1999 cohort group. The percentage rate decline in recidivism was 18.48% WHAT WE KNOW ABOUT RECIDIVISM The U.S. Department of Justice’s National Institute of 28 Corrections reports. Appropriate treatment reduces recidivism by 30% Inappropriate treatment increases recidivism by 6% Traditional punishment increases recidivism by 7% 28 US Department of Justice, National Institute of Corrections, reports (based on review of 154 “controlled studies). SMART JUSTICE Strategies Reform sentencing laws Repeal Mandatory Minimums “MMS are blunt instruments that fail to distinguish between low and high-level, as well as hardcore versus 29 transient drug dealers.” Current mandatory minimum sentencing laws eliminate judicial discretion. These laws are problematic because they tie the courts’ hands and mandate longer prison sentences, regardless of whether the Court believes the punishment is appropriate, based on the facts of the case. Repealing mandatory minimum sentences would restore judicial discretion and further the cause of justice. Prosecutorial discretion is essentially conducted behind closed doors, whereas that of a sentencing judge is conducted in an open courtroom. Thus, by shifting the locus of the use of discretion, mandatory sentencing not only fails to eliminate the use of discretion, but also subjects it to less public scrutiny. “There is a better solution. Repealing mandatory minimum sentencing laws not only saves taxpayers the burden of subsidizing a bloated prison system, but it gives states (and courts) the freedom to 30 choose more effective alternatives to reduce crime." Expand IN-community SERVICES Expand Community Drug Treatment Services For every $1 spent on drug treatment in the community, you save approximately $18. Substance abuse treatment provided in the community is more costeffective than imprisonment. Individuals with substance abuse histories compose a large portion of the prison 29 Mandatory Minimum Penalties: Their Effects on Crime, Sentencing Disparities, and Justice System Expenditures, 5. THE IMPACT OF MANDATORY MINIMUM SENTENCES,5.4 Mandatory Sentences for Drug Offences http://www.justice.gc.ca/eng/pi/rs/rep-rap/2002/rr02_1/p5_3.html 30 Mandatory minimum sentencing busts budgets and bloats nonviolent prison rolls, The Jurist – Legal News and Research, University of Pittsburgh School of Law, March 12, 2010. http://jurist.law.pitt.edu/hotline/2010/03/mandatory-minimumsentencing-busts.php population. Substance use/abuse plays a role in the commission of certain crimes. Treatment delivered in the community is one of the most cost-effective ways to 31 prevent such crimes. Expand Community Mental Health Services Mental health litigation has established the legal right to treatment in custodial facilities—for pretrial detainees as well as sentenced inmates. Among its benefits, good mental health treatment can reduce security risks by minimizing the symptoms of mental illness, thereby decreasing potential disruptions to jail routines and injuries to staff and detainees. The problems jails experience in connection with mentally ill detainees are associated with the absence of criminal justice policies, procedures, and standards specifically addressed to this group of offenders. Deficiencies in training, communication, and resources result from viewing the jail in isolation, rather than as an integral part of a criminal justice system (that includes the police, the courts, defense attorneys, and prosecutors) with linkages to mental health and other human services 32 based in the greater community . Increasing investment in community-based treatment, improving diversion from prison and jail, and ensuring that those leaving prison have adequate care, all will reduce the financial burden of imprisoning community members suffering with a mental illness. EARLY RELEASE Develop Residential Reentry Centers (RRCs) “Inmates who are released through RRCs are more likely to be gainfully employed and therefore less likely to recidivate as compared to inmates who are released from a prison directly to the community. We have recently begun to place inmates at low risk for recidivism (based on their age, criminal history and other criminogenic factors) and with few reentry needs (housing, employment, family ties) directly into home confinement wherever possible, allowing us to allocate the RRC beds to those with a need for the services and 33 structure provided in that environment.” 31 Aos, Steve, Polly Phipps, Robert Barnoski, and Roxanne Lieb. 2001. The comparative costs and benefits of programs to reduce crime. Olympia: Washington State Institute for Public Policy. 32 Statement of Harley G. Lappin, Director, Bureau of Prisons before U.S. Sentencing Commission, Regional Hearing on the State of Federal Sentencing, Austin Texas, November 20, 2009 http://www.ussc.gov/AGENDAS/20091119/Lappin.pdf 33 Providing Services for Jail Inmates with Mental Disorders, NIJ Research in Brief, Travis, Jeremy, and January, 1997. http://www.ncjrs.gov/txtfiles/162207.txt 34The High Budgetary Cost of Incarceration, John Schmitt, Kris Warner, and Sarika Gupta, June 2010, Center for Economic and Policy Research. http://www.cepr.net/documents/publications/incarceration-2010-06.pdf 34 The High Budgetary Cost of Incarceration, John Schmitt, Kris Warner, and Sarika Gupta, June 2010, Center for Economic and Policy One concrete proposal for cutting expenditures on incarceration would be to reduce the number of nonviolent offenders in prison and jail by half (with no 34 change in the incarceration rates for violent offenders). INCREASE AND FUND SUPPORTIVE SERVICES Probation Probationers accounted for more than half the total growth in the correctional population since 1990. Overall, the correctional population increased by nearly 2.5 million, or 57 percent, from 1990 to 2005. Failure rates on probation are high and have remained relatively 35 stable (at around 40 percent) . In Hawai`i, 1 in 32 adults is under some form of community supervision (1 in 45 on probation or parole; 1 in 108 in prison or jail).36 HOPE Probation Hawaii’s Opportunity Probation with Enforcement (HOPE) started in 2004 with three dozen offenders. The first evaluation was limited to drug-involved probationers assigned to HOPE who are not being supervised for domestic violence or sex offenses. With support from the Hawai`i legislature, the program was expanded. By early 2009, more than 1,500 probationers had been placed on HOPE. In a one-year, randomized controlled trial, HOPE probationers were 55 percent less likely to be arrested for a new crime, 72 percent less likely to use drugs, 61 percent less likely to skip appointments with their supervisory officer and 53 percent less likely to have their probation revoked. As a result, they also served or were sentenced to, on average, 48 percent fewer days of incarceration than the control group.37 Reform Parole Parole revocations account for a high number of admissions to prison, most for technical violations. In 2007, technical violations accounted for the reincarceration of 33% of the individuals on parole. To reduce prison admissions for technical violations, intermediate sanctions and community support services should be expanded. Parole reform should include increasing support and treatment programs for Research. http://www.cepr.net/documents/publications/incarceration2010-06.pdf 35 U.S. Department of Justice, 2006. 36 1 in 31: The Long Reach of American Corrections, Pew Center on the States, March 2009. http://www.pewcenteronthestates.org/uploadedFiles/wwwpewcenteront hestatesorg/Fact_Sheets/PSPP_1in31_factsheet_HI.pdf 37 Managing Drug Involved Probationers with Swift and Certain Sanctions: Evaluating Hawaii’s HOPE, Angela Hawken, Ph.D. and Mark Kleiman, Ph.D., December 2009. individuals on parole, and implementing alternatives to incarceration instead of revocation. Recidivism studies consistently show that inmates who are going to return to crime do so quickly (Langan et al. 2002, National Research Council 2007). If prisoners can remain completely arrest free for the first year after release, they have low probabilities of recidivism thereafter. Successful parole policies should build in motivational incentives. Current parole contacts should increase sufficient motivational incentives and positive rewards to encourage parolees to stay involved in treatment programs. Research shows that offenders should be involved in programs for a minimum of 3 to 6 months to achieve measurable positive outcomes (Aos et al. 2006, Hser et al. 2004, National Institute on Drug Abuse 2006, National Research Council 2007). Pilot HOPE Parole Program The 2010 Legislature passed Concurrent Resolutions requesting the Hawai`i Paroling Authority to establish a 2-year pilot project for at least 30 parolees who are high risk. Improving probation and parole services and supports could save states millions of dollars. By shifting the modality of supervision to one of support and service, states could send fewer people back to prison for technical violations. JUSTICE REINVESTMENT Justice Reinvestment is an initiative of The Council of State Government’s Justice Center to reduce spending on corrections, and increase public safety. The Justice Center uses a four step approach: 1) Analyze the prison population and spending in the communities to which people in prison often return; 2) Provide policymakers with options to generate savings and increase public safety; 3) Quantify savings and reinvest in select highstakes communities; and 4) Measure the impact and enhance accountability. A growing number of states have partnered with the Justice Center and developed data-driven policies that save taxpayer dollars and direct some of those savings to strategies that make communities safer and stronger. As part of a “Smart Justice” strategy, we envision bipartisan policy makers and stakeholders in Hawai`i working in partnership with the Justice Center to build safer communities. Learn more about the successful outcomes of Justice Reinvestment in other jurisdictions at http://www.justicereinvestment.org. For more information about this paper, contact Community Alliance on Prisons kat.caphi@gmail.com


