

Doj Bjs Report on Prosecutors in State Courts Dec 2011
Download original document:
Document text
Document text
This text is machine-read, and may contain errors. Check the original document to verify accuracy.
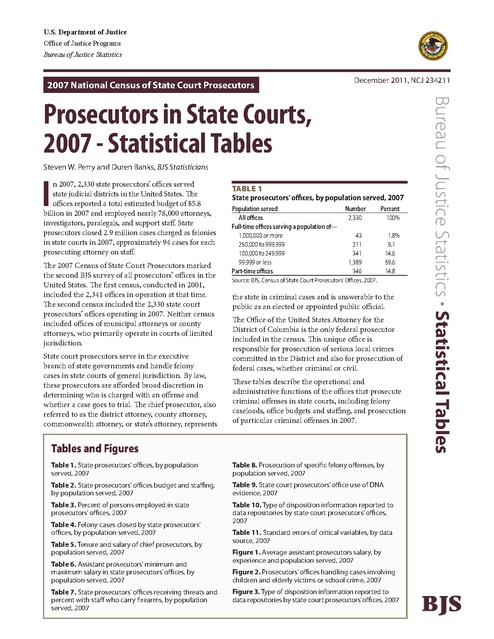
U.S. Department of Justice Office of Justice Programs Bureau of Justice Statistics 2007 National Census of State Court Prosecutors December 2011, NCJ 234211 Steven W. Perry and Duren Banks, BJS Statisticians I n 2007, 2,330 state prosecutors’ offices served state judicial districts in the United States. The offices reported a total estimated budget of $5.8 billion in 2007 and employed nearly 78,000 attorneys, investigators, paralegals, and support staff. State prosecutors closed 2.9 million cases charged as felonies in state courts in 2007, approximately 94 cases for each prosecuting attorney on staff. The 2007 Census of State Court Prosecutors marked the second BJS survey of all prosecutors’ offices in the United States. The first census, conducted in 2001, included the 2,341 offices in operation at that time. The second census included the 2,330 state court prosecutors’ offices operating in 2007. Neither census included offices of municipal attorneys or county attorneys, who primarily operate in courts of limited jurisdiction. State court prosecutors serve in the executive branch of state governments and handle felony cases in state courts of general jurisdiction. By law, these prosecutors are afforded broad discretion in determining who is charged with an offense and whether a case goes to trial. The chief prosecutor, also referred to as the district attorney, county attorney, commonwealth attorney, or state’s attorney, represents Table 1 State prosecutors’ offices, by population served, 2007 Population served All offices Full-time offices serving a population of— 1,000,000 or more 250,000 to 999,999 100,000 to 249,999 99,999 or less Part-time offices Number 2,330 Percent 100% 43 211 341 1,389 346 1.8% 9.1 14.6 59.6 14.8 Source: BJS, Census of State Court Prosecutors’ Offices, 2007. the state in criminal cases and is answerable to the public as an elected or appointed public official. The Office of the United States Attorney for the District of Columbia is the only federal prosecutor included in the census. This unique office is responsible for prosecution of serious local crimes committed in the District and also for prosecution of federal cases, whether criminal or civil. These tables describe the operational and administrative functions of the offices that prosecute criminal offenses in state courts, including felony caseloads, office budgets and staffing, and prosecution of particular criminal offenses in 2007. Tables and Figures Table 1. State prosecutors’ offices, by population served, 2007 Table 8. Prosecution of specific felony offenses, by population served, 2007 Table 2. State prosecutors’ offices budget and staffing, by population served, 2007 Table 9. State court prosecutors’ office use of DNA evidence, 2007 Table 3. Percent of persons employed in state prosecutors’ offices, 2007 Table 10. Type of disposition information reported to data repositories by state court prosecutors’ offices, 2007 Table 4. Felony cases closed by state prosecutors’ offices, by population served, 2007 Table 5. Tenure and salary of chief prosecutors, by population served, 2007 Table 6. Assistant prosecutors’ minimum and maximum salary in state prosecutors’ offices, by population served, 2007 Table 7. State prosecutors’ offices receiving threats and percent with staff who carry firearms, by population served, 2007 Bureau of Justice Statistics · Statistical Tables Prosecutors in State Courts, 2007 - Statistical Tables Table 11. Standard errors of critical variables, by data source, 2007 Figure 1. Average assistant prosecutors salary, by experience and population served, 2007 Figure 2. Prosecutors’ offices handling cases involving children and elderly victims or school crime, 2007 Figure 3. Type of disposition information reported to data repositories by state court prosecutors’ offices, 2007 BJS Summary findings Populations served In 2007, 2,330 prosecutors’ offices across the United States served districts with populations ranging in size from 500 to 9.9 million residents (not shown in table). Felony cases processing and dispositions Prosecutors’ offices reported closing 2.9 million cases charged as felonies in 2007 through convictions, acquittals, dismissals, or other dispositions (table 4). Most (74%) prosecutors’ offices served districts with a population of less than 100,000 residents. Fifteen percent of prosecutors’ offices were part-time offices with no fulltime chief prosecutor (table 1). Offices in districts with more than 1 million residents closed an average of 17,652 felony cases in 2007. Offices serving jurisdictions with 250,000 to 999,999 residents closed an average of 4,431 felony cases. State prosecutors’ districts (85%) generally correspond with county boundaries. Alaska, Delaware, Connecticut, and Rhode Island had a single prosecutors’ office for the entire state (not shown in table). In 2007, prosecuting attorneys in offices in districts with 100,000 to 249,999 residents closed an average of 121 felony cases each. The average caseload per prosecuting attorney across all full-time offices was 94 felony cases. Operating budgets and staffing levels The total operating budget ($5.8 billion) of state prosecutors’ offices in 2007 decreased by 5% from the $6.1 billion budget for 2001 (inflation-adjusted to 2007 dollars) (not shown in table). The average operating budget for full-time prosecutors’ offices in 2007 ranged from $526,000 for those serving fewer than 100,000 residents to $49.3 million in jurisdictions serving more than 1 million. The average part-time office’s budget was $157,000 (table 2). State prosecutors’ offices employed almost 78,000 full-time equivalent (FTE) staff in 2007.* The nearly 25,000 FTE assistant prosecutors employed in 2007 represented a 7% increase from the number reported in 2001 (not shown in table). Prosecutors’ offices serving populations of 1 million or more employed an average of 535 FTE staff, including 187 assistant prosecutors, 31 supervisory attorneys, 16 victim advocates, 51 investigators, and 183 support staff. In full-time offices serving fewer than 100,000 residents, on average, offices included one chief prosecutor, three assistant prosecutors, one victim advocate, one legal services staff, one investigator, and three support staff. Assistant prosecutors comprised 32% of the total staff in prosecutors’ offices in 2007. Support staff, including administrative and clerical staff, accounted for 33% of the total staff (table 3). *Full-time equivalent (FTE) is a computed statistic calculated by dividing the total number of hours worked by part-time employees by the standard number of hours for a full-time employee (40 hours per week) and then adding the resulting quotient to the number of full-time employees. 2 The budgeted cost per felony case closed, calculated as the total office budget in 2007 divided by the number of felony cases closed, was $2,792 in offices serving 1 million or more residents. Prosecutors’ offices reported 2.2 million convictions for cases charged as felonies in 2007. Prosecutors’ offices serving 1 million or more residents had an average of 11,952 felony case convictions, while fulltime offices serving populations of less than 100,000 had an average of 315 felony case convictions. Felony cases adjudicated through jury verdicts were rare across state prosecutors’ offices, accounting for an average of 3% of all felony case dispositions and 2% of dispositions litigated by offices serving 1 million or more residents. Tenure and salary The average annual salary of a chief prosecutor in 2007 was $98,000, with mean salaries ranging from $165,700 for chief prosecutors in the largest offices to less than $45,000 in part-time offices (table 5). In 2007, the average tenure of a chief prosecutor was 9 years. Sixty-four percent of chief prosecutors had been in office for more than 5 years, and 38% had been in office for more than 10 years. The longest serving prosecutor had been in the position for 42 years. The average annual salary for assistant prosecutors ranged from $33,460 for entry-level assistant prosecutors in parttime offices to $108,434 for assistant prosecutors with 6 or more years of experience in offices serving jurisdictions of 1 million or more residents (table 6). Prosecutors in State Courts, 2007 - Statistical Tables In offices serving 1 million or more residents, the average assistant prosecutor’s salary started at $51,354 for those with no experience and at $73,010 for those with 6 years or more experience, a difference of 42% (figure 1). More than 90% of offices in districts serving 1 million residents reported prosecuting felony offenses involving use of the internet for child exploitation, elder abuse, gangrelated violence, and school violence involving firearms. In offices serving between 250,000 and 999,999 residents, the average assistant prosecutor’s salary started at $47,580 for those with no experience and at $65,400 for those with 6 years or more experience, a difference of 37%. In 2007, part-time offices and those serving less than 100,000 residents were less likely than offices serving larger populations to handle cases involving children and elderly victims or school crime (figure 2). In full-time offices serving less than 100,000 residents, the average assistant prosecutor’s salary started at $42,380 for those with no experience and at $53,113 for those with 6 years or more experience, a difference of 25%. The percentage of offices prosecuting cases involving elder abuse (55%) or child exploitation using the internet (57%) was about 50% higher than the percentage prosecuting cases of school violence involving a firearm (27%). In part-time offices the average assistant prosecutor’s salary started at $33,460 for those with no experience and at $36,481 for those with 6 years or more experience, a difference of 9%. Threats against prosecutors’ offices In 2007, almost half (47%) of prosecutors’ offices had received a written threat, a threatening phone call, a faceto-face threat, or had staff who were victims of battery or assault (table 7). About 26% of offices reported receiving written threats, while 32% received threatening phone calls and 29% received face-to-face verbal threats. About 3% of offices reported that one of their staff had been a victim of battery or assault. Most offices (89%) serving populations of 1 million or more received a threat during 2007, as did most offices (69%) in jurisdictions with 250,000 to 999,999 residents. More than two-thirds of offices serving populations of 100,000 or more reported that the chief prosecutor, an assistant prosecutor, or a staff investigator carried a firearm. The percentage of offices reporting that a staff investigator carried a firearm (34%) was greater than the percentage reporting that the chief prosecutor (21%) or assistant prosecutors (18%) carried one. The percentage of prosecutors’ staff that reported carrying firearms has remained steady since 2001. The majority (58%) of offices that had received a threat reported that office staff carried a firearm, compared to 37% of offices that had not received a threat (not shown in table). About 6% of offices serving less than 250,000 residents (including part-time offices) prosecuted police officers for excessive force, while 55% of offices serving populations larger than 1 million prosecuted such cases. Use of DNA evidence in felony cases In 2007, most prosecutors’ offices (75%) used DNA evidence in plea negotiations or in felony trials (table 9). The majority (84%) of prosecutors’ offices reported that they had submitted DNA evidence to a laboratory for analysis. Most (80%) offices used forensic laboratories operated by the state government. More than half (60%) of state prosecutors’ offices that had submitted evidence to a laboratory in 2007 reported excessive delays in receiving the DNA results. Case disposition information reported to repositories A large majority of prosecutors’ offices reported case dispositions to either federal, state, or local repositories in 2007 (table 10). Most offices reported data on felony convictions (93%) and misdemeanor convictions (80%) to data repositories, while about 30% reported data on court determination of mental status (figure 3). Fewer than a third of the offices reported dispositions for commitment to mental institutions (31%). Among the offices that did not provide final case disposition information to federal, state, or local repositories, about 72% indicated another agency was responsible for submitting this information (not shown in table). Specific felony offenses In 2007, the majority of prosecutors’ offices reported prosecuting felony cases involving methamphetamine production (71%), child exploitation involving the internet (58%), or elder abuse (55%) (table 8). December 2011 3 Table 2 State prosecutors’ offices budget and staffing, by population served, 2007 All offices Resident population served (thousands) 299,567 Budget (thousands) $5,807,914 Budget per population served Full-time equivalent personnel* Chief prosecutor Assistant prosecutors Civil attorneys Supervisory attorneys Managing attorneys Victim advocates Legal services Investigators Support staff Other 77,927 2,157 24,937 1,666 3,824 1,704 4,841 4,278 7,311 25,759 1,451 1,000,000 or more Mean Median 2,025 1,470 $49,291 $35,981 $23 $21 535 1 187 12 31 13 16 35 51 183 6 Full-time offices serving a population of— 250,000 to 999,999 100,000 to 249,999 Mean Median Mean Median 496 445 158 150 $9,998 $7,000 $2,327 $1,809 $19 $15 $14 $11 445 1 133 3 22 6 9 28 45 139 0 131 1 43 3 7 3 8 7 15 41 3 113 1 36 0 7 2 6 3 8 36 0 39 1 12 1 2 1 3 2 3 13 1 33 1 11 0 1 1 3 1 2 10 0 99,999 or less Mean Median 36 29 $526 $336 $17 $13 10 1 3 0 0 0 1 1 1 3 0 8 1 2 0 0 0 1 0 0 3 0 Part-time offices Mean Median 13 7 $157 $98 $18 $14 3 1 1 0 0 0 0 0 0 1 0 2 1 0 0 0 0 0 0 0 1 0 Note: Table is based on operating budgets, not actual expenditures. Data were missing for 5.5% (128) of offices surveyed. Total budget, total staff, chief prosecutor, and assistant prosecutor values were imputed using data from 2001 and 2007 Census of State Court Prosecutors’ Offices, stratified by population served and state. See Methodology for details on imputation procedures. *Full-time equivalent (FTE) is a computed statistic calculated by dividing the total number of hours part-time employees worked by the standard number of hours for a full-time employee (40 hours per week) and then adding the resulting quotient to the number of full-time employees. Statistics for job categories were imputed using mean values for valid data from the 2007 Census of State Court Prosecutors’ Offices, stratified by population served. Source: BJS, Census of State Court Prosecutors’ Offices, 2001 and 2007. Table 3 Personnel employed in state prosecutors’ offices, 2007 Job categoriesa Total Support staff Assistant prosecutors Investigators Victim advocates Legal services Supervisory/managing Attorneys Chief prosecutor Civil attorneys Other Estimated total full-time equivalent staff Percent of total full-time equivalent personnel in prosecutors’ offices nationwideb 100% 33% 32 9 6 5 7 3 2 2 77,927 Note: Table is based on operating budgets, not actual expenditures. Data were missing for 5.5% (128) of offices surveyed. Total budget, total staff, chief prosecutor, and assistant prosecutor values were imputed using data from 2001 and 2007 Census of State Court Prosecutors’ Offices, stratified by population served and state. See Methodology for details on imputation procedures. aStatistics for job categories were imputed using mean values for valid data from 2007 Census of State Court Prosecutors Offices, stratified by population served. bFull-time equivalent (FTE) is a computed statistic calculated by dividing the total number of hours part-time employees worked by the standard number of hours for a full-time employee (40 hours per week) and then adding the resulting quotient to the number of full-time employees. Source: BJS, Census of State Court Prosecutors’ Offices, 2001 and 2007. 4 Prosecutors in State Courts, 2007 - Statistical Tables Table 4 Felony cases closed by state prosecutor’s offices, by population served, 2007 Felony cases Total closed— Per office Meana Median Per prosecuting attorneyb Meanc Median Budgeted cost per case closed Meand Median All offices 2,906,795 Total felony jury trial verdicts Meane Median Percent closed by jury verdict Meanf Median Total felony cases convicted Meang Median 1,000,000 or more 759,057 Full-time offices serving a population of— 250,000 to 999,999 100,000 to 249,999 934,884 622,073 99,999 or less 555,050 Part-time offices 35,731 1,248 300 17,652 14,304 4,431 3,347 1,824 1,427 400 226 103 32 94 75 81 82 87 77 121 102 106 73 99 42 $1,998 $1,764 $2,792 $2,376 $2,256 $2,140 $1,276 $1,307 $1,317 $1,667 $1,525 $2,968 73,274 31 7 14,077 327 230 25,721 122 69 16,974 50 30 15,450 11 5 1,051 3 1 3% 2 2,176,723 934 240 2% 2 513,918 11,952 8,730 3% 2 718,540 3,405 2,500 3% 2 476,337 1,397 1,089 3% 2 437,338 315 175 3% 1 30,591 88 25 Note: Based on imputed data from 2001 and 2007 Census of State Court Prosecutors’ Offices, stratified by population served and state. See Methodology for details on imputation procedures. aCalculated using the total number of felony cases divided by the total number of offices. bIncludes full-time equivalent positions of prosecutors who carry a caseload (chief and assistant prosecutors and supervisors). cCalculated using the total number of felony cases divided by the total number of litigating attorneys (chief and assistant prosecutors and supervisors). dCalculated using the total budget divided by the total number of felony cases. eCalculated using total number of jury trial verdicts divided by the total number of offices. fCalculated using total number of felony cases closed by jury verdict divided by the total number of felony cases closed in 2007. gCalculated using the total number of cases convicted divided by the total number of offices. Source: BJS, Census of State Court Prosecutors’ Offices, 2001 and 2007. December 2011 5 Table 5 Tenure and salary of chief prosecutors in state prosecutors' offices, by population served, 2007 Full-time offices serving a population of— Chief prosecutor All offices 1,000,000 or more 250,000 to 999,999 100,000 to 249,999 Salarya Mean $98,024 $165,732 $138,017 $121,771 Median $101,700 $158,000 $139,000 $119,800 Tenureb Mean 9.4 yr. 9.5 yr. 9.8 yr. 9.6 yr. Median 7.0 7.6 8.0 7.2 Percent of chief prosecutors with tenure of— Less than 1 year 3% 5% 5% 3% 1–2 19 15 12 23 3–4 14 10 14 15 5–10 26 30 27 16 11–20 25 35 28 30 More than 20 12 5 14 13 99,999 or less Part-time offices $96,956 $99,750 $44,981 $ 42,660 9.0 yr. 7.0 10.5 yr. 7.0 2% 18 15 29 24 11 5% 21 9 22 24 19 aValues for chief prosecutors’ salary were imputed using valid data from the 2001 and 2007 Census of State Court Prosecutors’ Offices, stratified by population served and state. See Methodology for further information on imputation procedures. bData on the tenure of the chief prosecutor were missing for 7.4% of offices surveyed. All percentages were calculated from reporting offices only. Source: BJS, Census of State Court Prosecutors’ Offices, 2001 and 2007. Table 6 Assistant prosecutors’ average minimum and maximum salary in state prosecutors’ offices, by population served, 2007 Salary Entry level assistant prosecutor Minimum Maximum Assistant prosecutor with 1 to 5 years experience Minimum Maximum Assistant prosecutor with 6 or more years experience Minimum Maximum 1,000,000 or more Mean Median Full-time offices serving a population of— 250,000 to 999,999 100,000 to 249,999 Mean Median Mean Median 99,999 or less Mean Median Part-time Mean Median $51,354 $64,517 $51,378 $58,013 $47,580 $57,759 $46,704 $51,707 $44,007 $55,263 $43,000 $48,000 $42,380 $50,050 $42,931 $46,000 $33,460 $36,712 $34,307 $39,000 $59,671 $82,227 $56,478 $79,296 $53,542 $68,993 $51,604 $65,000 $48,930 $62,074 $47,000 $57,585 $45,921 $55,248 $46,000 $53,134 $33,645 $36,391 $37,550 $40,691 $73,010 $68,609 $108,434 $111,987 $65,400 $94,257 $64,000 $90,796 $57,056 $83,139 $57,000 $79,566 $53,113 $64,932 $54,000 $65,000 $36,481 $42,473 $40,000 $44,990 Note: Based on data from prosecutors’ offices that responded. Salary data were missing for about 50% of offices. Source: BJS, Census of State Court Prosecutors’ Offices, 2007. 6 Prosecutors in State Courts, 2007 - Statistical Tables Figure 1 Assistant prosecutors’ average minimum salary, by experience and population served, 2007 Population served $51,354 1,000,000 or more $59,671 $73,010 $47,580 250,000 to 999,999 $53,542 $65,400 $44,007 100,000 to 249,999 $48,930 $57,056 $42,380 $45,921 99,999 or less Entry salary (no experience) 1 to 5 years minimum experience $53,113 $33,460 $33,645 $36,481 Part-time 0 10,000 20,000 30,000 6 years or more minimum experience 40,000 Mean salary 50,000 60,000 70,000 80,000 Note: Based on data from all prosecutors’ offices that responded. Salary data were missing for about 50% of offices. Source: BJS, Census of State Court Prosecutors’ Offices, 2007. Table 7 State prosecutors’ offices receiving threats and percent with staff who carry firearms, by population served, 2007 Type of threat/staff carrying firearm Any threat* Written threat Threatening phone call Face-to-face verbal threat Battery/assault Any staff carry firearm* Chief prosecutor carries a firearm Assistant prosecutor carries a firearm Staff investigator carries a firearm Full-time offices serving a population of— Part-time All offices 1,000,000 or more 250,000 to 999,999 100,000 to 249,999 99,999 or less offices Number Percent Number Percent Number Percent Number Percent Number Percent Number Percent 960 47% 34 89% 132 69% 154 54% 555 45% 85 28% 537 26 30 79 93 49 105 37 273 22 36 12 646 32 27 71 101 54 107 38 350 28 61 20 602 29 27 71 90 48 101 36 338 28 46 15 55 3 5 13 13 7 9 3 24 2 4 1 971 421 377 685 47% 21 18 34 36 6 13 35 90% 15 33 88 158 32 64 150 82% 17 33 78 189 59 81 162 66% 21 29 57 526 275 199 324 43% 22 16 27 62 49 20 14 20% 16 7 5 Note: Based on data from all prosecutors’ offices that responded. Data were missing for 12% of offices. *Detail adds to more than total due to multiple responses. Source: BJS, Census of State Court Prosecutors’ Offices, 2007. Table 8 Prosecution of specific felony offenses, by population served, 2007 Type of felony offense Methamphetamine production Use of internet for child exploitation Elder abuse Gang-related violence School violence involving firearms Police use of excessive force Terrorism/homeland security Human trafficking All offices 71.1% 57.5 55.2 33.6 27.2 9.2 3.9 3.8 1,000,000 or more 87.5% 97.5 95.0 95.0 92.5 55.0 17.5 40.0 Full-time offices serving a population of— 250,000 to 999,999 100,000 to 249,999 76.2% 78.8% 92.1 85.4 87.3 79.9 90.5 66.8 61.4 44.2 29.6 14.2 4.8 4.4 11.6 2.6 99,999 or less 71.8% 52.3 51.6 21.1 20.3 5.1 3.5 2.1 Part-time 56.0% 25.3 21.1 8.3 8.7 2.0 3.0 1.7 Note: Based on data from all prosecutors’ offices that responded. Data were missing for 15% of offices. Source: BJS, Census of State Court Prosecutors’ Offices, 2007. December 2011 7 Figure 2 Percent of prosecutors’ offices handling cases involving elder abuse, use of internet for child exploitation, and school violence involving firearms, by population served, 2007 All offices 55 58 27 95 98 93 1,000,000 or more 87 250,000 to 999,999 61 80 100,000 to 249,999 44 99,999 or less 21 Part-time offices 9 0 Use of internet for child exploitation School violence involving firearms 25 20 40 Percent 85 Elder abuse 52 52 20 92 60 80 Table 9 State court prosecutors' office use of DNA evidence, 2007 Type of DNA use DNA evidence submitted to any laboratory for analysisa FBI forensic laboratory State forensic laboratory Local government forensic laboratory Privately operated forensic laboratory Used DNA evidence in plea negotiations or in felony trials Problems associated with use of DNA evidenceb Improper evidence collection by police Inconclusive DNA results Excessive delay in getting DNA results from laboratory Difficulty in getting DNA results admitted in court as evidence Authorized to search and submit DNAb Convicted offender database Forensic database containing profiles from unsolved cases Percent 84.0% 10.3 80.0 9.9 26.7 74.5% 14.7% 38.8 60.0 2.5 47.8% 29.2 Note: Detail adds to more than total due to multiple responses to the survey. aBased on data from all prosecutors’ offices that responded. Data are missing for 15% of offices. bBased on offices that submitted evidence to any laboratory. Source: BJS, Census of State Court Prosecutors’ Offices, 2007. 100 Source: BJS, Census of State Court Prosecutors’ Offices, 2007. Table 10 Type of disposition information reported to data repositories, by state court prosecutors’ offices, 2007 Type of repository and case All offices Type of repository Anya 56% Federal 9 State 50 Local 26 Type of case disposition information reportedb Felony convictions 93% Guilty pleas 82 Misdemeanor convictions 80 Felony acquittals 79 Dismissal of charges by court 77 Misdemeanor acquittals 67 Sex offender registration requirements 61 Indictments 56 Probation and parole violations 54 Declination to prosecute 47 Protection orders 43 Commitment to mental institutions 31 Court determination of mental status 30 1,000,000 or more Full-time offices serving a population of— 250,000 to 999,999 100,000 to 249,999 99,999 or less Part-time 50% 18 45 33 62% 13 56 32 59% 12 52 28 56% 9 49 26 50% 5 47 21 95% 80 80 85 85 75 60 70 55 55 55 50 45 88% 83 75 77 77 63 61 61 48 58 44 42 40 92% 84 73 80 78 65 57 69 53 52 44 33 32 93% 82 80 79 77 67 62 55 55 47 44 29 30 96% 79 90 78 74 72 60 43 57 32 39 21 20 Note: Based on data from all prosecutors’ offices that responded. Data are missing for 15% of offices. aDetail adds to more than total due to multiple responses. bAnalysis restricted to offices that provided case disposition information to any repository. Source: BJS, Census of State Court Prosecutors’ Offices, 2007. 8 Prosecutors in State Courts, 2007 - Statistical Tables Figure 3 State court prosecutors’ offices that report data to repositories, by type of data reported, 2007 Court determination of mental status 30 Commitment to mental institutions 31 Protection orders 43 Declination to prosecute 47 Probation and parole violations 54 Indictments 56 Sex offender registration 61 Misdemeanor acquittals 67 Dismissal of charges by court 77 Felony acquittals 79 Misdemeanor convictions 80 Guilty pleas 82 Felony convictions 93 0 20 40 Percent 60 80 100 Note: Data on participation in record repositories were missing for 15% of prosecutors’ offices. Percentages based on valid data only. Source: BJS, Census of State Court Prosecutors’ Offices, 2007. December 2011 9 Methodology The 2007 National Census of State Court Prosecutors (NCSP07) included 2,330 chief prosecutors in the United States that handled felony cases in state courts of general jurisdiction. State court prosecutors serve districts determined by each state’s court structure. Data collection. The Urban Institute collected the data on behalf of the Bureau of Justice Statistics (BJS). The National District Attorneys Association helped review the data collection instrument, provided their national directory of district attorneys, and provided a medium for advertisement via their bi-monthly publication, The Prosecutor. The Urban Institute conducted the collection through a mailed questionnaire and a web automated instrument. The NCSP07 form is available on the BJS website at www.bjs.gov. Response rates. The NCSP-07 had an overall response rate of 95.6% from the 2,330 prosecutors’ offices across the nation. After the initial mailings, BJS followed up to obtain a returned survey from each prosecutors’ office. The follow-up process involved phone calls, email, fax communications, a second mailing of questionnaires, and follow-up letters. Completed surveys were received from 1,303 (56%) prosecutors’ offices. Follow-up telephone calls, emails, and faxes resulted in an additional 924 (40%) offices providing a sufficient partially completed form, to make a final total of 2,227 responses from the eligible 2,330. A total of 4.4% (103) of the offices either did not respond (47) or directly refused participation (56). Among the 103 court prosecutors’ offices that did not respond, 84% were in districts that served populations of less than 250,000. Calculated variables. Several variables were calculated using reported and imputed data collected from the survey instrument. Full-time equivalent (FTE) is a computed statistic calculated by dividing the total number of hours parttime employees worked by the standard number of hours for a full-time employee (40 hours per week), and then adding the resulting quotient to the number of fulltime employees. (See U.S. Census Bureau Government Employment, 1997, at http://quickfacts.census.gov/qfd/ meta/long_58632.htm.) Attorneys carrying a caseload (supervisory attorneys, assistant prosecutors, and chief prosecutors) were included as FTE prosecuting attorneys. Managing attorneys who did not prosecute cases were excluded. Cases closed per prosecuting attorney was calculated for each office by dividing the number of felony cases closed by the office in 2007 by the number of FTE prosecuting attorneys on staff in 2007. The budgeted cost per felony case closed was calculated for each office by dividing the total office budget in 2007 by the number of felony cases closed. The proportion of felony cases closed by jury verdict was calculated for each office by dividing the number of felony cases closed by jury verdict by the number of felony cases closed in 2007. Data Imputations BJS used a combination of hot and cold deck approaches to impute values for nine critical variables. These variables included the number of chief prosecutors, number of full-time assistant prosecutors, number of full-time staff, number of part-time staff, annual salary of chief prosecutor, total office operating budget, number of felony cases closed, number of felony cases resulting in a conviction, and the Table 11 Standard errors of critical variables, by data source, 2007 Imputed Critical variable Chief prosecutor Full-time assistant prosecutors Full-time staff Part-time staff Felony cases closed Felony cases resulting in a conviction Felony cases tried before a jury Annual salary of chief prosecutor Total office operating budget Number Mean 132 0.80 129 11.82 142 29.69 238 1.67 543 1,074.36 576 863.17 535 27.65 313 $101,273 378 $1,553,999 Reported data were*— Provided by respondent Standard Standard error of mean Number Mean error of mean 0.04 2,198 0.85 0.01 2.57 2,201 10.29 0.77 5.42 2,188 32.24 2.09 0.18 2,092 2.42 0.17 104.92 1,785 1301.63 89.36 71.25 1,752 958.64 67.46 2.70 1,794 32.60 2.76 $2,317 1,968 $97,507 $865 $223,372 1,952 $2,674,437 $248,044 All reported data Standard Number Mean error of mean 2,330 0.85 0.01 2,330 10.38 0.74 2,330 32.09 1.99 2,330 2.35 0.15 2,328 1248.62 72.77 2,328 935.02 53.75 2,329 31.46 2.21 2,281 $98,024 $811 2,330 $2,492,667 $211,098 Note: Excludes data for which no suitable donor for imputation was available. *A suitable donor for imputation purposes was not identified for all cases, and these data remained missing. 10 Prosecutors in State Courts, 2007 - Statistical Tables number of felony cases tried before a jury. Data were missing for approximately 6% of all offices for staffing critical variables, 16% of offices were missing budget information, and 23% of offices were missing caseload information (table 9). state and population size. Where there were no suitable donors in the same state, a donor of similar population size was used. The 2001 data were then adjusted using the imputed adjustment ratio to create the imputed 2007 value for the missing critical variable. The 2007 data file was merged with the 2001 Census of State Court Prosecutors data file to allow imputation from previously collected valid data from the same prosecutorial office. Adjusting for Inflation Financial data for fiscal years preceding 2007 were inflationadjusted using Gross Domestic Product (GDP) deflators prepared by the Bureau of Economic Analysis. The GDP deflator chain-type price index, as appropriate for state and local government salaries, was applied to 2001 prosecutors’ office salary data. The constant dollar salaries were then used to impute 2007 salary data for offices that did not provide salary data. (See table B-7, Chaintype price indexes for gross domestic product, 1962-2010, Department of Commerce, Bureau of Economic Analysis at http://www.gpoaccess.gov/ eop/tables11.html for further details.) For each jurisdiction with valid 2001 and 2007 data, an adjustment ratio was calculated as the ratio of the critical variable’s 2001 value to its 2007 value. All ratios greater than the 90th percentile were discarded for imputation purposes. Where only 2001 data were available, a hot deck imputation procedure was employed to impute the adjustment ratio value from the jurisdiction’s nearest neighbor in terms of December 2011 11 U.S. Department of Justice Office of Justice Programs Bureau of Justice Statistics Washington, DC 20531 ncj234211 PRESORTED STANDARD POSTAGE & FEES PAID DOJ/BJS Permit No. G-91 Official Business Penalty for Private Use $300 Office of Justice Programs • Innovation • Partnerships • Safer Neighborhoods • http://www.ojp.gov The Bureau of Justice Statistics is the statistical agency of the U.S. Department of Justice. James P. Lynch is the director. These Statistical Tables were prepared and supporting text written by Steven W. Perry and Duren Banks. Howard Snyder verified the report. Catherine Bird and Jill Thomas edited the report, Barbara Quinn produced the report, and Jayne Robinson prepared the report for final printing under the supervision of Doris J. James. December 2011, NCJ 234211 The full text of each report is available in PDF and ASCII formats on the BJS website at www.bjs.gov. Tables are also available in PDF and CSV formats. Related datasets are made available on the National Archive of Criminal Justice Data website at http://www. icpsr.umich.edu/icpsrweb/NACJD/index.jsp.


