

DOJ, Bureau of Justice Statistics - Multistate Criminal History Patterns of Prisoners Released in 30 States, 2015
Download original document:
Document text
Document text
This text is machine-read, and may contain errors. Check the original document to verify accuracy.
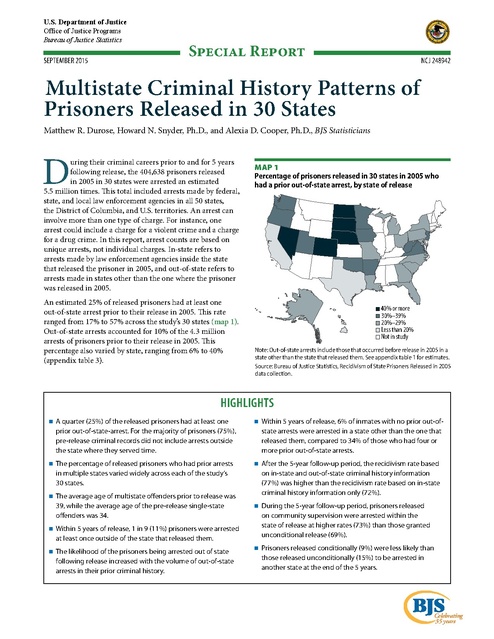
U.S. Department of Justice Office of Justice Programs Bureau of Justice Statistics SEPTEMBER 2015 Special Report NCJ 248942 Multistate Criminal History Patterns of Prisoners Released in 30 States Matthew R. Durose, Howard N. Snyder, Ph.D., and Alexia D. Cooper, Ph.D., BJS Statisticians D uring their criminal careers prior to and for 5 years following release, the 404,638 prisoners released in 2005 in 30 states were arrested an estimated 5.5 million times. This total included arrests made by federal, state, and local law enforcement agencies in all 50 states, the District of Columbia, and U.S. territories. An arrest can involve more than one type of charge. For instance, one arrest could include a charge for a violent crime and a charge for a drug crime. In this report, arrest counts are based on unique arrests, not individual charges. In-state refers to arrests made by law enforcement agencies inside the state that released the prisoner in 2005, and out-of-state refers to arrests made in states other than the one where the prisoner was released in 2005. An estimated 25% of released prisoners had at least one out-of-state arrest prior to their release in 2005. This rate ranged from 17% to 57% across the study’s 30 states (map 1). Out-of-state arrests accounted for 10% of the 4.3 million arrests of prisoners prior to their release in 2005. This percentage also varied by state, ranging from 6% to 40% (appendix table 3). Map 1 Percentage of prisoners released in 30 states in 2005 who had a prior out-of-state arrest, by state of release 40% or more 30%–39% 20%–29% Less than 20% Not in study Note: Out-of-state arrests include those that occurred before release in 2005 in a state other than the state that released them. See appendix table 1 for estimates. Source: Bureau of Justice Statistics, Recidivism of State Prisoners Released in 2005 data collection. HIGHLIGHTS A quarter (25%) of the released prisoners had at least one prior out-of-state-arrest. For the majority of prisoners (75%), pre-release criminal records did not include arrests outside the state where they served time. Within 5 years of release, 6% of inmates with no prior out-ofstate arrests were arrested in a state other than the one that released them, compared to 34% of those who had four or more prior out-of-state arrests. The percentage of released prisoners who had prior arrests in multiple states varied widely across each of the study’s 30 states. The average age of multistate offenders prior to release was 39, while the average age of the pre-release single-state offenders was 34. After the 5-year follow-up period, the recidivism rate based on in-state and out-of-state criminal history information (77%) was higher than the recidivism rate based on in-state criminal history information only (72%). During the 5-year follow-up period, prisoners released on community supervision were arrested within the state of release at higher rates (73%) than those granted unconditional release (69%). Prisoners released conditionally (9%) were less likely than those released unconditionally (15%) to be arrested in another state at the end of the 5 years. Within 5 years of release, 1 in 9 (11%) prisoners were arrested at least once outside of the state that released them. The likelihood of the prisoners being arrested out of state following release increased with the volume of out-of-state arrests in their prior criminal history. Celebrating 35 years During the 5-year period following release, 11% of released prisoners had at least one out-of-state arrest, including 8% with 1 to 2 out-of-state arrests, 2% with 3 to 4 out-of-state arrests, and 1% with 5 or more out-of-state arrests (not shown). The estimated rate of prisoners who were arrested in another state within 1, 3, and 5 years of release varied across each of the study’s 30 states. The state-specific out-ofstate arrest rate at the end of the 5-year follow-up period ranged from a minimum of 6% to a maximum of 26%, with a median of 14% (figure 1). Nine percent of the 1.2 million arrests of prisoners in the 5 years following their release occurred outside the state of release. This proportion varied by state, ranging from 3% to 27% (appendix table 7). Data in this report came from the criminal history records maintained by the FBI and state repositories on persons released from state prisons in 30 states in 2005 to track their arrest patterns across state boundaries both prior to and for 5 years following release. A representative sample of inmates released in 2005 was developed for each of the 30 states using data reported by state departments of corrections to the Bureau of Justice Statistics’ (BJS) National Corrections Reporting Program (NCRP), resulting in a total sample of 68,597 inmates. This sample was used to produce estimates on the 404,638 persons released in 2005 in the 30 states. In 2005, these 30 states were responsible for about Figure 1 Distribution of the state-level percent of prisoners who were arrested in another state following release, among prisoners released in 30 states in 2005 Percent arrested 30 25 Maximum 20 3rd quartile 15 10 5 0 Median 1st quartile Minimum 1 year 3 years 5 years Time from release to first out-of-state arrest (in years) Note: Prisoners were tracked for 5 years following release. See appendix table 5 for estimates and appendix table 12 for standard errors. Source: Bureau of Justice Statistics, Recidivism of State Prisoners Released in 2005 data collection. three-quarters of all state prisoners released nationwide. States were selected for the study based on their ability to provide prisoner records and the FBI or state identification numbers on persons released from correctional facilities in 2005. Older inmates were more likely than younger inmates to have prior out-of-state arrests In 2005 in 30 states, nearly 9 in 10 (89%) released prisoners were male, and the mean age of the prisoners at the time of release was age 35 (table 1). About 1 in 4 (26%) were in prison for a violent crime. The proportions of non-Hispanic black and non-Hispanic white prisoners were similar (about 40% each). Table 1 Characteristics of prisoners released in 30 states in 2005, by number of prior out-of-state arrests Characteristic All released prisoners Sex Male Female Race/Hispanic origin Whitea Black/African Americana Hispanic/Latino Othera,b Age at release 24 or younger 25–29 30–34 35–39 40 or older Mean age Most serious commitment offense Violent Property Drug Public orderc Number of released prisoners Number of prior All released out-of-state arrests prisoners 0* 1 or more 100% 100% 100% 89.3% 10.7 88.9% 11.1 90.6% ** 9.4 ** 39.9% 40.1 17.7 2.4 36.5% 41.4 19.7 2.5 50.2% ** 36.1 ** 11.5 ** 2.2 17.6% 19.3 15.9 15.7 31.5 21.1% 21.2 16.1 14.9 26.8 7.1% ** 13.7 ** 15.5 18.1 ** 45.5 ** 35 34 39 ** 25.7% 29.8 31.8 12.7 405,000 26.3% 28.9 32.5 12.3 305,000 23.9% ** 32.6 ** 29.8 ** 13.8 ** 100,000** Note: Prior out-of-state arrests include those that occurred before release in 2005 in another state. Data on the prisoner’s sex and age at release were known for 100% of cases, and race and Hispanic origin for nearly 100%. Number of prisoners was rounded to the nearest 1,000. Detail may not sum to total due to rounding. See appendix table 13 for standard errors. *Comparison group. **Difference with comparison group is significant at the 95% confidence level. aExcludes persons of Hispanic or Latino origin. bIncludes American Indian or Alaska Natives; Asian, Native Hawaiian, or other Pacific Islanders; and persons of two or more races. cIncludes 0.8% of cases in which the prisoners most serious offense was unspecified. Source: Bureau of Justice Statistics, Recidivism of State Prisoners Released in 2005 data collection. MULTISTATE CRIMINAL HISTORY PATTERNS OF PRISONERS RELEASED IN 30 STATES | SEPTEMBER 2015 2 The composition of the group of released prisoners with at least one prior out-of-state arrest differed from the group that had no prior out-of-state arrests. A released prisoner is defined as a pre-release multistate offender if he or she had at least one prior out-of-state arrest. The composition of the pre-release single-state and multistate offender groups varied by race. Non-Hispanic whites made up half (50%) of pre-release multistate offenders, compared to about a third (36%) of pre-release single-state offenders. On average, pre-release multistate offenders were older, with a mean age of 39, while the mean age of pre-release single-state offenders was age 34. An estimated 46% of the pre-release multistate offenders were age 40 or older at release, compared to 27% of pre-release single-state offenders. Prior to their release in 2005, three-quarters (75%) of the released prisoners had no arrests outside the state where they had served time, while 1 in 4 (25%) had been arrested at least once in another state (table 2). The percentage of prisoners who had an out-of-state arrest prior to release varied by personal characteristics. The prior criminal histories of older inmates were more likely than those of younger inmates to include an out-of-state arrest. For example, 10% of released prisoners age 24 or younger were multistate offenders prior to release, compared to 18% of released prisoners ages 25 to 29, 24% of those ages 30 to 34, 29% of those ages 35 to 39, and 36% of released prisoners age 40 or older at the time of release. Male prisoners (25%) were more likely than female prisoners (22%) to have a prior arrest in another state. White prisoners (31%) were more likely than black (22%) and Hispanic (16%) prisoners to have a prior out-of-state arrest. Prior to being released from prison, an estimated 27% of prisoners who had been in prison for a property offense had been arrested in at least one other state. Prisoners released for a violent or drug offense (23% each) were less likely than those released for a property offense to have a prior out-ofstate arrest. Table 2 Percent of prisoners released in 30 states in 2005 who had an out-of-state arrest prior to release, by demographic characteristics and most serious commitment offense Characteristic All released prisoners Sex Male* Female Race/Hispanic origin Whitea,* Black/African Americana Hispanic/Latino Othera,b Age at release 24 or younger* 25–29 30–34 35–39 40 or older Most serious commitment offense Violent* Property Drug Public orderc Total 100% Number of prior out-of-state arrests 0 1 or more 75.3% 24.7% 100% 100% 74.9% 78.3 ** 25.1% 21.7 ** 100% 100% 100% 100% 68.8% 77.7 ** 83.8 ** 76.9 ** 31.2% 22.3 ** 16.2 ** 23.1 ** 100% 100% 100% 100% 100% 90.0% 82.5 ** 75.9 ** 71.4 ** 64.2 ** 10.0% 17.5 ** 24.1 ** 28.6 ** 35.8 ** 100% 100% 100% 100% 77.0% 73.0 ** 76.9 73.1** 23.0% 27.0 ** 23.1 26.9 ** Note: Prior out-of-state arrests include those that occurred before release in 2005 in another state. Data on the prisoner’s sex and age at release were known for 100% of cases, and race and Hispanic origin for nearly 100%. See appendix table 14 for standard errors. *Comparison group. **Difference with comparison group is significant at the 95% confidence level. aExcludes persons of Hispanic or Latino origin. bIncludes American Indian or Alaska Natives; Asian, Native Hawaiian, or other Pacific Islanders; and persons of two or more races. cIncludes 0.8% of cases in which the prisoners most serious offense was unspecified. Source: Bureau of Justice Statistics, Recidivism of State Prisoners Released in 2005 data collection. MULTISTATE CRIMINAL HISTORY PATTERNS OF PRISONERS RELEASED IN 30 STATES | SEPTEMBER 2015 3 Prior to release, the majority of multistate offenders had arrest records in two states An estimated 25% of released prisoners had at least one out-of-state arrest prior to their release, including 9% who had four or more prior out-of-state arrests, 7% who had two to three prior out-of-state arrests, and 9% who had one out-of-state arrest (table 3). Among the released prisoners who had prior arrests in more than one state, 72% had arrests in two states, while 18% had arrests in three states, and 9% had arrests in four or more states (not shown). Among the estimated 100,000 prisoners released in 30 states in 2005 with prior arrests in multiple states— 39% had a prior arrest record that moved sequentially from state to state without returning to a prior state. 61% had a prior arrest record that moved back and forth among states. Inmates with prior out-of-state arrests were more likely than other inmates to have an out-of-state arrest following release An estimated 11% of all released prisoners had at least one out-of-state arrest in the 5 years following their release from prison. The likelihood of the prisoners being arrested out of state following release increased with the number of out-of-state arrests in their prior criminal history. Within 5 years of release, 34% of those who had four or more prior out-of-state arrests were arrested in a state other than the one that released them, compared to 6% with no prior out-of-state arrests. For prisoners with prior out-of state arrests who were arrested within 5 years of release, 79% of their first post-release arrests were in the state that released them, 15% were in another state where they had been previously arrested, and 6% were arrested in a new state that was not in their prior criminal history (not shown). For prisoners without prior out-of-state arrests who were arrested within 5 years of release, 96% of their first post-release arrests were in the state that released them and 4% were in another state. Recidivism patterns based on national criminal history records differed from those limited to criminal history records within the state of release Within 1 year of release in 2005, an estimated 43% of prisoners released in 2005 in 30 states were arrested for a new crime either within or outside the state of release (figure 2). When measuring recidivism only as an arrest within the state of release, an estimated 41% of the inmates were arrested within 1 year following release. At the end of the 5-year period, the recidivism rate based on national (i.e., in-state and out-of-state) criminal history information was 77%, compared to 72% for the rate based solely on in-state criminal history information. During the 5-year follow-up period, 5% of the prisoners had only out-of-state arrests following release and were not arrested within the state that released them (appendix table 9). The difference of in-state recidivism rates when out-of-state arrests were included for the 30 states shows the limitations of recidivism studies that have access only to in-state criminal history information. Table 3 Percent of prisoners released in 30 states in 2005 who were arrested in another state following release, by number of prior out-of-state arrests Number of prior out-of-state arrests All released prisoners 0* 1 2–3 4 or more All released prisoners 100% 75.3 8.9 ** 6.8 ** 9.1 ** Following release, percent arrested in another state within— 1 year 3 years 5 years 3.3% 7.7% 10.9% 1.5 4.0 6.3 4.7 ** 11.6 ** 16.1 ** 8.0 ** 18.0 ** 24.1 ** 13.6 ** 26.9 ** 34.2 ** Note: Prior out-of-state arrests include those that occurred before release in 2005 in another state. Prisoners were tracked for 5 years following release. Detail may not sum to total due to rounding. See appendix table 15 for standard errors. *Comparison group. **Difference with comparison group is significant at the 95% confidence level. Source: Bureau of Justice Statistics, Recidivism of State Prisoners Released in 2005 data collection. Figure 2 Percent of prisoners released in 30 states in 2005 who were arrested following release within or outside the state of release Percent 80 National* 70 Arrested for any type of crime 60 In-state 50 40 30 Arrested for a violent crime 20 National* In-state 10 0 0 6 12 18 24 30 36 42 48 Time from release to first arrest (in months) 54 60 Note: Prisoners were tracked for 5 years following release. See appendix table 16 for estimates and standard errors. *Includes in-state and out-of-state criminal history records. Source: Bureau of Justice Statistics, Recidivism of State Prisoners Released in 2005 data collection. MULTISTATE CRIMINAL HISTORY PATTERNS OF PRISONERS RELEASED IN 30 STATES | SEPTEMBER 2015 4 Among all released inmates, 5% were arrested for a property crime in a state other than the one that released them. During the 5-year follow-up period, 4% of the released prisoners were arrested for a drug crime in another state. An estimated 7% of the released prisoners were arrested for a public order offense outside of the state that released them, such as a probation violation, weapons offense, or disorderly conduct. Within 5 years of release, 29% of prisoners released in 2005 in 30 states were arrested for a violent offense within or outside the state of release (appendix table 16). When limiting criminal histories to arrests only for violent crimes within the state of release, 26% of the inmates were arrested within 5 years following release for a violent crime. Among state prisoners released in 30 states in 2005, 3% of the inmates were arrested at least once outside the state that released them within a year. After 3 years following release, the percentage of inmates with an out-of-state arrest increased to 8%. An estimated 11% of inmates were arrested outside of the state that released them at least once within 5 years of their release. Within 5 years of release from prison, 3% of inmates were arrested for a violent offense in another state (not shown). Less than 1% of prisoners were arrested for a violent crime both within and outside the state of release during the 5-year follow-up period. Of the prisoners released in 2005 in the study’s 30 states, the majority (74%) were granted conditional release and placed on parole, probation, or some other form of community supervision (not shown). About 1 in 4 (26%) were granted an unconditional release. Overall, those prisoners granted conditional release (77%) were arrested at similar rates to those granted an unconditional release (77%) during the following 5 years (table 4). During this period, the prisoners who were released on community supervision were arrested within that state at higher rates (73%) than those granted an unconditional release (69%). In contrast, prisoners released conditionally (9%) were less likely than those released unconditionally (15%) to be arrested in another state at the end of the 5-year follow-up period. Table 4 Percent of prisoners released in 30 states in 2005 who were arrested following release within or outside the state of release, by characteristics Characteristic All released prisoners Sex Male* Female Race/Hispanic origin Whitea,* Black/African Americana Hispanic/Latino Othera,b Age at release 24 or younger* 25–29 30–34 35–39 40 or older Type of prison release Conditional* Unconditional Prior out-of-state arrests 0* 1 or more Within or outside the state of release 1 year 3 years 5 years 43.4% 67.8% 76.6% Following release, percent of prisoners arrested— Within the state of release 1 year 3 years 5 years 41.0% 63.8% 71.9% Outside the state of release 1 year 3 years 5 years 3.3% 7.7% 10.9% 44.5% 34.4 ** 69.0% 58.5 ** 77.6% 68.1 ** 42.0% 32.6 ** 64.8% 55.4 ** 72.8% 64.3 ** 3.4% 2.3 ** 7.9% 6.0 ** 11.2% 8.6 ** 39.7% 45.8 ** 46.3 ** 42.7 63.9% 71.7 ** 68.1 ** 67.3 73.1% 80.8 ** 75.3 ** 75.0 36.7% 43.7 ** 44.4 ** 40.7 ** 58.8% 68.1 ** 64.9 ** 63.8 ** 67.2% 76.6 ** 71.6 ** 71.3 ** 4.1% 2.9 ** 2.5 ** 2.7 ** 9.5% 6.8 ** 6.0 ** 6.7 ** 13.3% 9.8 ** 8.3 ** 9.1 ** 51.3% 45.4 ** 43.4 ** 44.4 ** 37.3 ** 75.9% 71.1 ** 68.1 ** 69.8 ** 60.3 ** 84.1% 80.3 ** 77.0 ** 78.1 ** 69.2 ** 48.8% 42.5 ** 40.5 ** 42.1 ** 35.3 ** 71.9% 66.4 ** 63.2 ** 65.9 ** 56.7 ** 80.0% 75.0 ** 71.2 ** 73.4 ** 64.9 ** 3.7% 3.9 3.5 3.2 2.6 ** 8.3% 8.8 8.6 7.9 6.2 ** 11.7% 12.3 12.5 11.5 8.5 ** 44.0% 41.8 ** 67.8% 67.9 76.5% 76.8 42.2% 37.7 ** 64.7% 61.3 ** 72.8% 69.4 ** 2.5% 5.3 ** 6.3% 11.3 ** 9.3% 15.1 ** 43.0% 44.6 ** 67.3% 69.4 ** 76.0% 78.4 ** 42.0% 37.7 ** 65.5% 58.5 ** 73.8% 66.1 ** 1.5% 8.9 ** 4.0% 18.9 ** 6.3% 24.9 ** Note: Data on the prisoner’s sex and age at release were known for 100% of cases, race and Hispanic origin for nearly 100%, and type of prison release for 98.2%. Prisoners were tracked for 5 years following release. Prior out-of-state arrests include those that occurred before release in 2005 in another state. See appendix table 17 for standard errors. *Comparison group. **Difference with comparison group is significant at the 95% confidence level. aExcludes persons of Hispanic or Latino origin. bIncludes American Indian or Alaska Natives; Asian, Native Hawaiian, or other Pacific Islanders; and persons of two or more races. Source: Bureau of Justice Statistics, Recidivism of State Prisoners Released in 2005 data collection. MULTISTATE CRIMINAL HISTORY PATTERNS OF PRISONERS RELEASED IN 30 STATES | SEPTEMBER 2015 5 One year after release from prison, males (44%) were more likely than females (34%) to have been arrested at least once either in the state where they were released or in another state. At the end of the 5-year follow-up period, more than three-quarters (78%) of males and two-thirds (68%) of females had either an in-state or an out-of-state arrest. Males also had higher recidivism rates than females when measured as being arrested in a state other than the one that released them. Within 1 year of release, 3% of males and 2% of females had an out-of-state arrest. During the 5 years following release, 11% of males compared to 9% of females had an out-of-state arrest. At the end of the 5-year follow-up period, the recidivism rate based on arrests within and outside the state of release was higher among blacks (81%) than whites (73%) and Hispanics (75%). In comparison, the recidivism rate based only on arrests outside the state of release was higher among whites (13%) than blacks (10%) and Hispanics (8%). Although older inmates were more likely than younger inmates to have a prior out-of-state arrest in their criminal history, this pattern was not observed in the out-of-state recidivism rates. Younger inmates were more likely than older inmates to have an out-of-state arrest following release. An estimated 12% of inmates under age 40 had an out-of-state arrest following release, compared to 8% of those age 40 or older. For most states, their released prisoners had arrest histories in about 50 states Among the prisoners released in 2005 in 30 states who were sampled for this study, the number of states and U.S. territories that each state’s sample had arrests in ranged from 42 to 52 (appendix table 11). Out-of-state arrests of former prisoners were most frequently, but not always, in bordering states or ones close in proximity. For instance, the persons released from New Jersey state prisons in 2005 were arrested in New Jersey and 46 other states either prior to being released or during the 5 years following their release. While the majority of the arrests of the prisoners released in New Jersey were within that state, the most common states outside of New Jersey where its prisoners were arrested included New York, Pennsylvania, and Florida. Direct comparisons of recidivism rates in this report to prior BJS studies are limited due to improvements in records Direct comparisons of the out-of-state recidivism rates of the 15 states in the Bureau of Justice Statistics’ (BJS) 1994 study to the rates of the 30 states in this study are not appropriate due to differences in the two samples of prisoners. In addition to the expanded geographic coverage of states contributing information about released prisoners to the new study, other differences involved changes in prisoner demographic characteristics and criminal histories of those released, which are attributes known to be related to recidivism. For instance, the proportion of inmates who were age 40 or older at release increased from 17% in the 1994 study to 32% in the 2005 study. The proportion who were in prison for a violent offense increased from 22% to 27%. Comparisons between recidivism rates in the 1994 and 2005 studies are also difficult because the 2005 study used new data collection capabilities to directly access the criminal history record systems of all 50 states and obtain more comprehensive out-of-state information than was available for the 1994 study. Due to efforts funded by individual states and the BJS’s National Criminal History Improvement Program (NCHIP) to help states improve their criminal history recordkeeping, state criminal history repositories may now capture more information on offenders’ criminal activities than in the past. However, the potential effects of these improvements to the nation’s criminal history recordkeeping on the observed out-of-state recidivism rates are difficult to quantify, and statistical adjustments for their effects cannot be made. With these limitations in mind, and for general discussion purposes only, BJS conducted analyses of the out-of-state recidivism rates of the inmates released in the 11 states that had out-of-state criminal history records available for both the 1994 and 2005 studies. For these 11 states, an estimated 7% of the inmates released in 1994 were arrested within 3 years outside the state that released them, compared to an estimated 9% of the inmates released in 2005. MULTISTATE CRIMINAL HISTORY PATTERNS OF PRISONERS RELEASED IN 30 STATES | SEPTEMBER 2015 6 Methodology This report estimates the multistate criminal history patterns of 404,638 persons released in 2005 from state prisons in 30 states. A representative sample of inmates released in 2005 was developed for each of the 30 states using data reported by state departments of corrections to the Bureau of Justice Statistics’ (BJS) National Corrections Reporting Program (NCRP), yielding a total sample of 70,878 persons (table 5). This sample excluded transfers to the custody of another authority, releases due to death, releases on bond, releases to seek or participate in an appeal of a case, and prisoners who escaped or were absent without leave. Inmates whose sentence was less than a year were also excluded. For persons released multiple times during 2005, the first release was selected. The 30 state departments of corrections that supplied BJS with the required data included Alaska, Arkansas, California, Colorado, Florida, Georgia, Hawaii, Iowa, Louisiana, Maryland, Michigan, Minnesota, Missouri, Nebraska, Nevada, New Jersey, New York, North Carolina, North Dakota, Ohio, Oklahoma, Oregon, Pennsylvania, South Carolina, South Dakota, Texas, Utah, Virginia, Washington, and West Virginia. The International Justice and Public Safety Network (Nlets) developed an automated system for BJS to collect multistate (i.e., national) criminal history records. Nlets also produced software to extract key data elements from individual state and federal criminal history records into a uniform file layout that supported statistical analysis. NORC at the University of Chicago converted the state-specific fields extracted from the criminal history records (e.g., offense statutes and disposition descriptions) into a common national coding structure. In 2011, on behalf of BJS, Nlets sent the state and FBI identification numbers, which were supplied by the departments of corrections, to the FBI’s Interstate Table 5 Number of prisoners released in 30 states in 2005 State of release All released prisoners Alaska Arkansas California Colorado Florida Georgia Hawaii Iowa Louisiana Maryland Michigan Minnesota Missouri Nebraska Nevada New Jersey New York North Carolina North Dakota Ohio Oklahoma Oregon Pennsylvania South Carolina South Dakota Texas Utah Virginia Washington West Virginia Number of released prisonersa 412,731 1,827 10,844 107,633 8,277 31,537 12,321 1,041 4,607 12,876 10,200 12,177 4,619 15,997 1,386 5,022 13,097 23,963 11,743 884 15,832 7,768 4,731 12,452 10,046 2,159 43,532 3,000 12,776 8,439 1,945 Released prisoners included in the studyb Number of sample cases Weighted total Sample size 70,878 404,638 69,279 1,158 1,764 1,118 2,785 10,513 2,697 4,604 106,116 4,542 2,351 8,042 2,281 3,350 30,975 3,285 2,763 12,054 2,697 793 1,022 779 1,897 4,465 1,839 2,806 12,552 2,737 2,597 9,859 2,513 2,603 11,775 2,519 1,897 4,581 1,882 2,919 15,513 2,828 966 1,366 952 1,973 4,965 1,949 2,697 12,992 2,674 3,532 23,448 3,459 2,748 11,335 2,653 686 868 674 3,070 15,688 3,038 2,345 7,459 2,250 1,955 4,625 1,912 2,840 12,020 2,741 2,537 9,982 2,519 1,285 2,151 1,280 3,779 43,118 3,742 1,569 2,974 1,556 2,719 12,319 2,619 2,443 8,234 2,382 1,211 1,864 1,162 Criminal history record collected Number Percent 68,597 99.0% 1,099 98.3% 2,640 97.9 4,541 100 2,275 99.7 3,272 99.6 2,602 96.5 772 99.1 1,836 99.8 2,723 99.5 2,494 99.2 2,504 99.4 1,879 99.8 2,823 99.8 952 100 1,808 92.8 2,630 98.4 3,459 100 2,643 99.6 666 98.8 2,966 97.6 2,184 97.1 1,910 99.9 2,714 99.0 2,512 99.7 1,275 99.6 3,742 100 1,548 99.5 2,609 99.6 2,380 99.9 1,139 98.0 aExcludes releases of prisoners whose sentence was less than a year; releases to custody, detainer, or warrant; releases due to death; escapes or being absent without leave; transfers; administrative releases; and releases on appeal. For persons released multiple times during 2005, the first release was selected. bExcludes 1,595 sampled prisoners who died during the 5-year follow-up period and 4 cases determined to be invalid release records. Source: Bureau of Justice Statistics, Recidivism of State Prisoners Released in 2005 data collection. MULTISTATE CRIMINAL HISTORY PATTERNS OF PRISONERS RELEASED IN 30 STATES | SEPTEMBER 2015 7 Identification Index (III) to collect the criminal history records on 70,878 former prisoners. These records contained arrests from state and federal criminal justice agencies across the 50 states and the District of Columbia prior to and following the prison releases in 2005. Traffic violations (with the exception of vehicular manslaughter, driving while intoxicated, and hit-and-run) were excluded from the study because the coverage of these events in the criminal history records varied widely by state. This study used the death information from the FBI’s III and the Social Security Administration’s public Death Master File to identify individuals who died during the 5-year follow-up period. The 1,595 prisoners who died according to either source of information were excluded from the study, along with 4 additional cases that were later determined to be invalid release records. Among the 69,279 eligible prisoners sampled from 30 states, BJS did not obtain criminal history records on 406 subjects because the departments of corrections were unable to provide their FBI or state identification number. An additional 276 prisoners had an identification number, but no criminal history record linked to this number was found in the FBI or state record repositories. To account for the missing data, the sample weights for the 682 cases without a criminal history record were equally distributed among the weights of the other 68,597 cases with the same commitment offense, demographic characteristics, and state of release. The adjusted weights for the final sample of 68,597 persons were used to produce recidivism estimates on the 404,638 persons released from prison in the 30 states in 2005. Conducting tests of statistical significance Because this study was based on a sample and not a complete enumeration, the estimates in this report are subject to sampling error (i.e., a discrepancy between an estimate and a population parameter based on chance). One measure of the sampling error associated with an estimate is the standard error. The standard error can vary from one estimate to the next. In general, for a given metric, an estimate with a smaller standard error provides a more reliable approximation of the true value than an estimate with a larger standard error. Estimates with relatively large standard errors are associated with less precision and reliability and should be interpreted with caution. BJS conducted tests to determine whether differences in estimated numbers and percentages were statistically significant once sampling error was taken into account. All differences discussed in this report are statistically significant at or above the 95% confidence level. Standard errors were generated using SPSS Complex Samples and SUDAAN, both statistical software packages that estimate sampling error from complex sample surveys. Standard errors for each table are available at the end of the report. Offense definitions Violent offenses—include homicide, rape or sexual assault, robbery, assault, and other miscellaneous or unspecified violent offenses. Property offenses—include burglary, fraud or forgery, larceny, motor vehicle theft, and other miscellaneous or unspecified property offenses. Drug offenses—include possession, trafficking, and other miscellaneous or unspecified drug offenses. Public order offenses—include those that violate the peace or order of the community or threaten the public health or safety through unacceptable conduct, interference with governmental authority, or the violation of civil rights or liberties. This category includes weapons offenses, driving under the influence, probation and parole violation, obstruction of justice, commercialized vice, disorderly conduct, and other miscellaneous or unspecified offenses. MULTISTATE CRIMINAL HISTORY PATTERNS OF PRISONERS RELEASED IN 30 STATES | SEPTEMBER 2015 8 Appendix table 1 Percent of prisoners released in 30 states in 2005 who had an out-of-state arrest prior to release, by state of release State of release All released prisoners Alaska Arkansas California Colorado Florida Georgia Hawaii Iowa Louisiana Maryland Michigan Minnesota Missouri Nebraska Nevada New Jersey New York North Carolina North Dakota Ohio Oklahoma Oregon Pennsylvania South Carolina South Dakota Texas Utah Virginia Washington West Virginia Number of prisoners released 404,638 1,764 10,513 106,116 8,042 30,975 12,054 1,022 4,465 12,552 9,859 11,775 4,581 15,513 1,366 4,965 12,992 23,448 11,335 868 15,688 7,459 4,625 12,020 9,982 2,151 43,118 2,974 12,319 8,234 1,864 Percent with at least one prior out-of-state arrest 24.7% 28.9 33.5 18.8 40.7 27.5 24.4 18.6 35.8 19.8 24.0 22.0 39.1 29.3 40.6 57.3 30.5 21.6 27.2 45.2 22.8 31.4 38.1 27.6 24.9 43.1 16.6 36.9 30.4 34.9 34.5 Note: See appendix table 2 for standard errors. Source: Bureau of Justice Statistics, Recidivism of State Prisoners Released in 2005 data collection. Appendix table 2 Standard errors for appendix table 1: Percent of prisoners released in 30 states in 2005 who had an out-of-state arrest prior to release, by state of release State of release All released prisoners Alaska Arkansas California Colorado Florida Georgia Hawaii Iowa Louisiana Maryland Michigan Minnesota Missouri Nebraska Nevada New Jersey New York North Carolina North Dakota Ohio Oklahoma Oregon Pennsylvania South Carolina South Dakota Texas Utah Virginia Washington West Virginia Percent with at least one prior out-of-state arrest 0.24% 0.87 0.87 0.73 0.92 0.84 0.82 0.71 0.89 0.74 0.81 0.81 0.91 0.84 0.89 0.97 0.88 0.78 0.84 0.94 0.79 0.87 0.89 0.86 0.80 0.90 0.68 0.87 0.86 0.87 0.90 Source: Bureau of Justice Statistics, Recidivism of State Prisoners Released in 2005 data collection. MULTISTATE CRIMINAL HISTORY PATTERNS OF PRISONERS RELEASED IN 30 STATES | SEPTEMBER 2015 9 Appendix table 3 Number and proportion of all arrests prior to release that were within or outside the state of release, among prisoners released in 30 states in 2005 Number of arrests State of release prior to release All released prisoners 4,304,000 Alaska 14,000 Arkansas 78,000 California 1,508,000 Colorado 102,000 Florida 439,000 Georgia 132,000 Hawaii 16,000 Iowa 32,000 Louisiana 112,000 Maryland 126,000 Michigan 68,000 Minnesota 43,000 Missouri 124,000 Nebraska 10,000 Nevada 48,000 New Jersey 126,000 New York 199,000 North Carolina 74,000 North Dakota 6,000 Ohio 110,000 Oklahoma 47,000 Oregon 59,000 Pennsylvania 103,000 South Carolina 93,000 South Dakota 20,000 Texas 328,000 Utah 31,000 Virginia 127,000 Washington 116,000 West Virginia 13,000 Arrests prior to release Within state Outside state Total of release of release 100% 89.8% 10.2% 100% 79.0 21.0 100% 82.3 17.7 100% 94.5 5.5 100% 83.2 16.8 100% 90.5 9.5 100% 89.3 10.7 100% 92.5 7.5 100% 78.3 21.7 100% 92.1 7.9 100% 92.2 7.8 100% 86.1 13.9 100% 79.0 21.0 100% 86.3 13.7 100% 73.0 27.0 100% 59.8 40.2 100% 88.4 11.6 100% 91.1 8.9 100% 81.8 18.2 100% 69.8 30.2 100% 87.5 12.5 100% 78.3 21.7 100% 83.1 16.9 100% 87.0 13.0 100% 88.3 11.7 100% 75.1 24.9 100% 90.8 9.2 100% 82.9 17.1 100% 85.3 14.7 100% 86.2 13.8 100% 82.1 17.9 Note: Number of arrests was rounded to the nearest 1,000. See appendix table 4 for standard errors. Source: Bureau of Justice Statistics, Recidivism of State Prisoners Released in 2005 data collection. Appendix table 4 Standard errors for appendix table 3: Number and proportion of all arrests prior to release that were within or outside the state of release, among prisoners released in 30 states in 2005 State of release All released prisoners Alaska Arkansas California Colorado Florida Georgia Hawaii Iowa Louisiana Maryland Michigan Minnesota Missouri Nebraska Nevada New Jersey New York North Carolina North Dakota Ohio Oklahoma Oregon Pennsylvania South Carolina South Dakota Texas Utah Virginia Washington West Virginia Arrests prior to release Number of arrests Within state Outside state prior to release of release of release 23,080 0.16% 0.16% 260 0.90 0.90 1,140 0.73 0.73 20,610 0.36 0.36 1,360 0.61 0.61 6,020 0.47 0.47 1,840 0.58 0.58 210 0.42 0.42 500 0.85 0.85 1,710 0.50 0.50 1,800 0.47 0.47 1,030 0.73 0.73 680 0.75 0.75 1,900 0.64 0.64 160 0.95 0.95 740 0.93 0.93 1,930 0.59 0.59 3,660 0.56 0.56 1,210 0.84 0.84 80 0.90 0.90 2,010 0.66 0.66 740 0.86 0.86 950 0.64 0.64 1,580 0.62 0.62 1,560 0.63 0.63 320 0.82 0.82 4,260 0.62 0.62 420 0.64 0.64 1,750 0.68 0.68 1,600 0.54 0.54 230 0.74 0.74 Note: Number of arrests was rounded to the nearest 10. Source: Bureau of Justice Statistics, Recidivism of State Prisoners Released in 2005 data collection. MULTISTATE CRIMINAL HISTORY PATTERNS OF PRISONERS RELEASED IN 30 STATES | SEPTEMBER 2015 10 Appendix table 5 Percent of prisoners released in 30 states in 2005 who were arrested in another state following release, by state of release Following release, percent arrested in another state within— Number of State of release prisoners released 1 year 3 years 5 years All released prisoners 404,638 3.3% 7.7% 10.9% Alaska 1,764 2.2 5.5 10.0 Arkansas 10,513 5.8 12.7 17.4 California 106,116 1.7 4.0 5.9 Colorado 8,042 4.7 10.4 14.9 Florida 30,975 4.3 8.9 12.7 Georgia 12,054 3.5 8.1 11.2 Hawaii 1,022 1.7 5.1 6.7 Iowa 4,465 5.6 13.3 18.3 Louisiana 12,552 4.2 9.5 13.3 Maryland 9,859 4.9 9.6 13.0 Michigan 11,775 2.8 6.7 10.6 Minnesota 4,581 6.1 13.3 17.3 Missouri 15,513 4.3 9.4 13.2 Nebraska 1,366 9.0 21.2 26.2 Nevada 4,965 9.9 18.8 24.4 New Jersey 12,992 3.7 10.8 16.5 New York 23,448 2.5 7.4 11.0 North Carolina 11,335 4.4 11.4 14.9 North Dakota 868 6.5 15.3 21.8 Ohio 15,688 2.9 8.5 11.4 Oklahoma 7,459 4.8 11.4 14.3 Oregon 4,625 5.4 12.9 17.0 Pennsylvania 12,020 3.3 7.1 9.7 South Carolina 9,982 4.0 10.0 14.5 South Dakota 2,151 5.6 11.2 16.2 Texas 43,118 1.8 5.0 7.5 Utah 2,974 3.4 8.8 13.0 Virginia 12,319 4.7 9.0 12.4 Washington 8,234 5.3 10.8 14.1 West Virginia 1,864 6.8 14.6 20.3 Note: Prisoners were tracked for 5 years following release. See appendix table 6 for standard errors. Source: Bureau of Justice Statistics, Recidivism of State Prisoners Released in 2005 data collection. Appendix table 6 Standard errors for appendix table 5: Percent of prisoners released in 30 states in 2005 who were arrested in another state following release, by state of release State of release All released prisoners Alaska Arkansas California Colorado Florida Georgia Hawaii Iowa Louisiana Maryland Michigan Minnesota Missouri Nebraska Nevada New Jersey New York North Carolina North Dakota Ohio Oklahoma Oregon Pennsylvania South Carolina South Dakota Texas Utah Virginia Washington West Virginia Following release, percent arrested in another state within— 1 year 3 years 5 years 0.09% 0.13% 0.16% 0.28 0.44 0.59 0.44 0.62 0.70 0.24 0.37 0.44 0.40 0.58 0.67 0.39 0.54 0.63 0.35 0.52 0.60 0.25 0.40 0.46 0.43 0.63 0.72 0.38 0.55 0.64 0.42 0.56 0.64 0.32 0.49 0.60 0.45 0.64 0.71 0.38 0.54 0.63 0.53 0.75 0.80 0.61 0.78 0.86 0.36 0.60 0.71 0.30 0.50 0.60 0.39 0.61 0.68 0.49 0.69 0.79 0.32 0.53 0.60 0.41 0.60 0.66 0.42 0.62 0.70 0.35 0.50 0.57 0.36 0.56 0.66 0.42 0.58 0.67 0.25 0.40 0.49 0.34 0.52 0.62 0.40 0.54 0.62 0.41 0.57 0.64 0.48 0.67 0.77 Source: Bureau of Justice Statistics, Recidivism of State Prisoners Released in 2005 data collection. MULTISTATE CRIMINAL HISTORY PATTERNS OF PRISONERS RELEASED IN 30 STATES | SEPTEMBER 2015 11 Appendix table 7 Number and proportion of all arrests following release that were within or outside the state of release, among prisoners released in 30 states in 2005 Number of arrests State of release following release All released prisoners 1,173,000 Alaska 4,000 Arkansas 25,000 California 403,000 Colorado 26,000 Florida 110,000 Georgia 38,000 Hawaii 3,000 Iowa 9,000 Louisiana 33,000 Maryland 34,000 Michigan 23,000 Minnesota 15,000 Missouri 36,000 Nebraska 4,000 Nevada 15,000 New Jersey 33,000 New York 49,000 North Carolina 24,000 North Dakota 2,000 Ohio 41,000 Oklahoma 15,000 Oregon 17,000 Pennsylvania 21,000 South Carolina 31,000 South Dakota 4,000 Texas 80,000 Utah 9,000 Virginia 33,000 Washington 33,000 West Virginia 4,000 Arrests following release Within state Outside state Total of release of release 100% 91.0% 9.0% 100% 84.6 15.4 100% 80.9 19.1 100% 96.8 3.2 100% 89.2 10.8 100% 89.8 10.2 100% 91.2 8.8 100% 91.2 8.8 100% 78.3 21.7 100% 88.5 11.5 100% 90.6 9.4 100% 88.6 11.4 100% 86.6 13.4 100% 87.5 12.5 100% 73.0 27.0 100% 74.5 25.5 100% 83.3 16.7 100% 89.8 10.2 100% 81.5 18.5 100% 76.7 23.3 100% 89.6 10.4 100% 81.9 18.1 100% 87.2 12.8 100% 88.0 12.0 100% 88.4 11.6 100% 80.2 19.8 100% 91.0 9.0 100% 89.4 10.6 100% 87.6 12.4 100% 91.7 8.3 100% 77.2 22.8 Note: Prisoners were tracked for 5 years following release. Number of arrests was rounded to the nearest 1,000. See appendix table 8 for standard errors. Source: Bureau of Justice Statistics, Recidivism of State Prisoners Released in 2005 data collection. Appendix table 8 Standard errors for appendix table 7: Number and proportion of all arrests following release that were within or outside the state of release, among prisoners released in 30 states in 2005 State of release All released prisoners Alaska Arkansas California Colorado Florida Georgia Hawaii Iowa Louisiana Maryland Michigan Minnesota Missouri Nebraska Nevada New Jersey New York North Carolina North Dakota Ohio Oklahoma Oregon Pennsylvania South Carolina South Dakota Texas Utah Virginia Washington West Virginia Number of arrests following release 8,330 100 580 7,280 490 2,310 700 60 180 670 650 480 310 730 70 390 690 1,310 570 40 890 310 410 470 670 100 1,700 220 670 670 90 Arrests following release Within state Outside state of release of release 0.18% 0.18% 1.28 1.28 1.09 1.09 0.33 0.33 0.66 0.66 0.85 0.85 0.65 0.65 0.99 0.99 1.08 1.08 0.81 0.81 0.63 0.63 0.83 0.83 0.84 0.84 0.78 0.78 1.09 1.09 1.27 1.27 1.02 1.02 0.73 0.73 1.15 1.15 1.00 1.00 0.73 0.73 1.06 1.06 0.74 0.74 0.88 0.88 0.75 0.75 1.05 1.05 0.86 0.86 0.73 0.73 0.90 0.90 0.53 0.53 1.04 1.04 Note: Number of arrests was rounded to nearest 10. Source: Bureau of Justice Statistics, Recidivism of State Prisoners Released in 2005 data collection. MULTISTATE CRIMINAL HISTORY PATTERNS OF PRISONERS RELEASED IN 30 STATES | SEPTEMBER 2015 12 Appendix table 9 Percent increase in the in-state recidivism rate when out-of-state arrests were included, among prisoners released in 30 states in 2005, by state of release State of release All released prisoners Alaska Arkansas California Colorado Florida Georgia Hawaii Iowa Louisiana Maryland Michigan Minnesota Missouri Nebraska Nevada New Jersey New York North Carolina North Dakota Ohio Oklahoma Oregon Pennsylvania South Carolina South Dakota Texas Utah Virginia Washington West Virginia 1 year 2.4% 2.2 4.1 1.1 3.0 3.3 2.5 1.4 4.4 3.3 3.1 2.4 3.4 3.3 7.1 8.0 2.7 2.0 3.7 5.2 1.9 3.7 3.3 2.8 3.2 4.8 1.5 2.5 3.5 3.4 4.9 3 years 4.1% 4.4 6.6 1.8 4.9 5.1 3.8 3.0 7.5 5.3 4.5 3.8 5.1 4.8 12.5 12.0 6.1 4.1 7.5 7.7 3.4 6.8 4.9 4.0 6.0 7.8 3.1 3.9 5.1 4.4 8.7 5 years 4.7% 6.5 7.4 2.1 5.7 5.4 4.2 3.2 8.2 5.8 4.5 4.5 5.6 5.5 13.8 13.4 7.9 5.4 7.8 8.7 3.9 7.3 5.3 4.9 7.0 9.0 4.2 4.3 5.9 4.5 9.8 Note: Prisoners were tracked for 5 years following release. In this table, recidivism is measured as a new arrest. See appendix table 10 for standard errors. Source: Bureau of Justice Statistics, Recidivism of State Prisoners Released in 2005 data collection. Appendix table 10 Standard errors for appendix table 9: Percent increase in the in-state recidivism rate when out-of-state arrests were included, among prisoners released in 30 states in 2005, by state of release All released prisoners Alaska Arkansas California Colorado Florida Georgia Hawaii Iowa Louisiana Maryland Michigan Minnesota Missouri Nebraska Nevada New Jersey New York North Carolina North Dakota Ohio Oklahoma Oregon Pennsylvania South Carolina South Dakota Texas Utah Virginia Washington West Virginia 1 year 0.07% 0.28 0.37 0.19 0.32 0.34 0.29 0.22 0.38 0.34 0.33 0.30 0.34 0.33 0.47 0.55 0.31 0.27 0.37 0.44 0.26 0.36 0.33 0.32 0.32 0.39 0.22 0.29 0.35 0.34 0.41 3 years 0.10% 0.39 0.46 0.25 0.41 0.41 0.37 0.32 0.49 0.42 0.40 0.37 0.41 0.40 0.61 0.65 0.45 0.38 0.51 0.51 0.34 0.48 0.40 0.37 0.44 0.48 0.32 0.36 0.42 0.38 0.53 5 years 0.10% 0.47 0.48 0.27 0.43 0.42 0.38 0.32 0.51 0.44 0.39 0.40 0.42 0.42 0.64 0.68 0.51 0.43 0.51 0.52 0.36 0.49 0.41 0.41 0.48 0.52 0.37 0.37 0.45 0.38 0.56 Source: Bureau of Justice Statistics, Recidivism of State Prisoners Released in 2005 data collection. MULTISTATE CRIMINAL HISTORY PATTERNS OF PRISONERS RELEASED IN 30 STATES | SEPTEMBER 2015 13 Appendix table 11 States where prisoners released in 30 states in 2005 were arrested prior to and within 5 years following release State of release Alaska Arkansas California Colorado Florida Georgia Hawaii Iowa Louisiana Maryland Michigan Minnesota Missouri Nebraska Nevada New Jersey New York North Carolina North Dakota Ohio Oklahoma Oregon Pennsylvania South Carolina South Dakota Texas Utah Virginia Washington West Virginia Total number of states where released prisoners were arrested* 47 50 48 50 52 52 44 48 48 46 47 47 47 44 49 47 47 49 42 48 47 50 49 50 49 50 46 49 50 42 Most common states where prisoners were arrested outside the state of release Washington California Oregon Texas Missouri California Nevada Arizona Texas California Texas Arizona Georgia New York Texas Florida South Carolina Alabama California Nevada Washington Illinois Nebraska Missouri Texas California Florida District of Columbia Virginia Pennsylvania Florida Illinois Ohio Wisconsin Illinois North Dakota Kansas Illinois California Iowa California Texas California Arizona Utah New York Pennsylvania Florida New Jersey Florida Pennsylvania South Carolina Florida Virginia Minnesota South Dakota California Florida Kentucky California Texas California Kansas Washington California Idaho New Jersey New York Florida Georgia North Carolina Florida Minnesota Iowa Nebraska California Louisiana Florida California Nevada Colorado Maryland District of Columbia North Carolina Oregon California Idaho Ohio Virginia North Carolina *Includes the state where released as well as the District of Columbia and the U.S. territories. Source: Bureau of Justice Statistics, Recidivism of State Prisoners Released in 2005 data collection. MULTISTATE CRIMINAL HISTORY PATTERNS OF PRISONERS RELEASED IN 30 STATES | SEPTEMBER 2015 14 Appendix table 12 Estimates for figure 1: Distribution of the state-level percent of prisoners who were arrested in another state following release, among prisoners released in 30 states in 2005 1 year 1.7% 3.4 4.3 5.5 9.9 Minimum 1st quartile Median 3rd quartile Maximum 3 years 4.0% 8.2 9.8 12.4 21.2 5 years 5.9% 11.2 13.7 16.8 26.2 Source: Bureau of Justice Statistics, Recidivism of State Prisoners Released in 2005 data collection. Appendix table 13 Standard errors for table 1: Characteristics of prisoners released in 30 states in 2005, by number of prior out-of-state arrests Characteristic Sex Male Female Race/Hispanic origin White Black/African American Hispanic/Latino Other Age at release 24 or younger 25–29 30–34 35–39 40 or older Mean age Most serious commitment offense Violent Property Drug Public order Number of released prisoners All released prisoners Number of prior out-of-state arrrests 0 1 or more --- 0.06% 0.06 0.18% 0.18 0.28% 0.32% 0.55% 0.27 0.26 0.09 0.32 0.33 0.11 0.52 0.42 0.16 0.22% 0.24 0.22 0.22 0.28 0.28% 0.29 0.26 0.26 0.32 0.27% 0.36 0.39 0.41 0.55 0.06 0.07 0.11 0.26% 0.28 0.28 0.18 0.31% 0.33 0.33 0.22 0.49% 0.51 0.51 0.33 970 970 Note: Number of released prisoners was rounded to the nearest 10. --Less than 0.005%. Source: Bureau of Justice Statistics, Recidivism of State Prisoners Released in 2005 data collection. Appendix table 14 Standard errors for table 2: Percent of prisoners released in 30 states in 2005 who had an out-of-state arrest prior to release, by demographic characteristics and most serious commitment offense Characteristic All released prisoners Sex Male Female Race/Hispanic origin White Black/African American Hispanic/Latino Other Age at release 24 or younger 25–29 30–34 35–39 40 or older Most serious commitment offense Violent Property Drug Public order Number of prior out-of-state arrests 0 1 or more 0.24% 0.24% 0.26% 0.38 0.26% 0.38 0.39% 0.35 0.60 1.50 0.39% 0.35 0.60 1.50 0.38% 0.46 0.59 0.64 0.50 0.38% 0.46 0.59 0.64 0.50 0.49% 0.45 0.43 0.61 0.49% 0.45 0.43 0.61 Source: Bureau of Justice Statistics, Recidivism of State Prisoners Released in 2005 data collection. Appendix table 15 Standard errors for table 3: Percent of prisoners released in 30 states in 2005 who were arrested in another state following release, by number of prior out-of-state arrests Number of prior out-of-state arrests All released prisoners 0 1 2 to 3 4 or more All released prisoners 0.24% 0.16 0.14 0.15 Following release, percent arrested in another state within— 1 year 3 years 5 years 0.09% 0.13% 0.16% 0.07 0.12 0.15 0.41 0.56 0.63 0.55 0.78 0.88 0.51 0.70 0.76 Source: Bureau of Justice Statistics, Recidivism of State Prisoners Released in 2005 data collection. MULTISTATE CRIMINAL HISTORY PATTERNS OF PRISONERS RELEASED IN 30 STATES | SEPTEMBER 2015 15 Appendix table 16 Estimates and standard errors for figure 2: Percent of prisoners released in 30 states in 2005 who were arrested following release within or outside the state of release Months 6 12 18 24 30 36 42 48 54 60 Percent Arrested for any type of crime Arrested for a violent crime National In-state National In-state 28.2% 26.7% 4.6% 4.3% 43.4 41.0 8.7 8.1 53.0 49.9 12.2 11.2 59.5 56.0 15.2 14.0 64.3 60.5 17.9 16.5 67.8 63.8 20.3 18.6 70.6 66.3 22.6 20.6 73.0 68.5 24.8 22.6 75.0 70.4 26.7 24.2 76.6 71.9 28.6 25.9 Standard error Arrested for any type of crime Arrested for a violent crime National In-state National In-state 0.28% 0.28% 0.13% 0.13% 0.29 0.29 0.17 0.17 0.28 0.28 0.20 0.19 0.27 0.27 0.21 0.21 0.26 0.27 0.23 0.22 0.25 0.26 0.24 0.24 0.25 0.26 0.25 0.25 0.24 0.25 0.26 0.25 0.23 0.25 0.27 0.26 0.23 0.24 0.27 0.27 Source: Bureau of Justice Statistics, Recidivism of State Prisoners Released in 2005 data collection. Appendix table 17 Standard errors for table 4: Percent of prisoners released in 30 states in 2005 who were arrested following release within or outside the state of release, by characteristics Characteristic All released prisoners Sex Male Female Race/Hispanic origin White Black/African American Hispanic/Latino Other Age at release 24 or younger 25–29 30–34 35–39 40 or older Type of prison release Conditional Unconditional Prior out-of-state arrests 0 1 or more Within or outside the state of release 1 year 3 years 5 years 0.29% 0.25% 0.23% Following release, percent of prisoners arrested— Within the state of release 1 year 3 years 5 years 0.29% 0.26% 0.24% Outside the state of release 1 year 3 years 5 years 0.09% 0.13% 0.16% 0.32% 0.49 0.28% 0.48 0.25% 0.44 0.32% 0.49 0.29% 0.48 0.26% 0.45 0.10% 0.12 0.15% 0.21 0.17% 0.25 0.44% 0.42 0.93 1.97 0.39% 0.35 0.81 1.71 0.35% 0.30 0.75 1.57 0.44% 0.42 0.93 1.98 0.41% 0.37 0.84 1.76 0.38% 0.32 0.78 1.63 0.15% 0.12 0.24 0.32 0.23% 0.18 0.38 0.73 0.27% 0.22 0.44 0.79 0.68% 0.68 0.76 0.77 0.54 0.54% 0.55 0.66 0.65 0.50 0.45% 0.48 0.60 0.57 0.46 0.69% 0.69 0.76 0.77 0.54 0.57% 0.59 0.69 0.67 0.51 0.49% 0.53 0.64 0.61 0.48 0.23% 0.23 0.21 0.21 0.14 0.33% 0.33 0.36 0.34 0.21 0.40% 0.39 0.44 0.42 0.24 0.37% 0.42 0.32% 0.39 0.29% 0.35 0.37% 0.42 0.33% 0.41 0.30% 0.38 0.10% 0.18 0.16% 0.26 0.19% 0.29 0.34% 0.55 0.30% 0.47 0.27% 0.42 0.34% 0.55 0.31% 0.52 0.28% 0.49 0.07% 0.28 0.12% 0.39 0.15% 0.43 Source: Bureau of Justice Statistics, Recidivism of State Prisoners Released in 2005 data collection. MULTISTATE CRIMINAL HISTORY PATTERNS OF PRISONERS RELEASED IN 30 STATES | SEPTEMBER 2015 16 The Bureau of Justice Statistics of the U.S. Department of Justice is the principal federal agency responsible for measuring crime, criminal victimization, criminal offenders, victims of crime, correlates of crime, and the operation of criminal and civil justice systems at the federal, state, tribal, and local levels. BJS collects, analyzes, and disseminates reliable and valid statistics on crime and justice systems in the United States, supports improvements to state and local criminal justice information systems, and participates with national and international organizations to develop and recommend national standards for justice statistics. William J. Sabol is director. This report was written by Matthew R. Durose, Howard N. Snyder, Ph.D., and Alexia D. Cooper, Ph.D. Joshua Markman and Marshay Lentini verified the report. Lynne McConnell and Jill Thomas edited the report. Tina Dorsey and Barbara Quinn produced the report. September 2015, NCJ 248942 Celebrating 35 years NCJ248942 Office of Justice Programs Innovation • Partnerships • Safer Neighborhoods www.ojp.usdoj.gov


