

Doj Capital Punishment Statistics 2008
Download original document:
Document text
Document text
This text is machine-read, and may contain errors. Check the original document to verify accuracy.
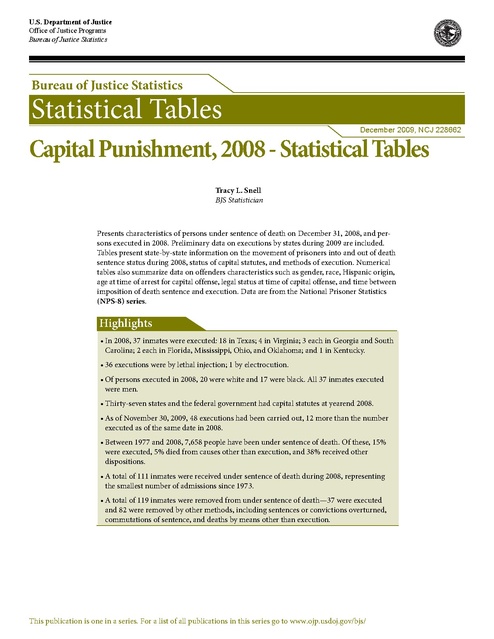
U.S. Department of Justice
Office of Justice Programs
Bureau of Justice Statistics

Bureau of Justice Statistics

Statistical Tables
December 2009, NCJ 228662

Capital Punishment, 2008 - Statistical Tables
Tracy L. Snell
BJS Statistician

Presents characteristics of persons under sentence of death on December 31, 2008, and persons executed in 2008. Preliminary data on executions by states during 2009 are included.
Tables present state-by-state information on the movement of prisoners into and out of death
sentence status during 2008, status of capital statutes, and methods of execution. Numerical
tables also summarize data on offenders characteristics such as gender, race, Hispanic origin,
age at time of arrest for capital offense, legal status at time of capital offense, and time between
imposition of death sentence and execution. Data are from the National Prisoner Statistics
(NPS-8) series.

Highlights
• In 2008, 37 inmates were executed: 18 in Texas; 4 in Virginia; 3 each in Georgia and South
Carolina; 2 each in Florida, Mississippi, Ohio, and Oklahoma; and 1 in Kentucky.
• 36 executions were by lethal injection; 1 by electrocution.
• Of persons executed in 2008, 20 were white and 17 were black. All 37 inmates executed
were men.
• Thirty-seven states and the federal government had capital statutes at yearend 2008.
• As of November 30, 2009, 48 executions had been carried out, 12 more than the number
executed as of the same date in 2008.
• Between 1977 and 2008, 7,658 people have been under sentence of death. Of these, 15%
were executed, 5% died from causes other than execution, and 38% received other
dispositions.
• A total of 111 inmates were received under sentence of death during 2008, representing
the smallest number of admissions since 1973.
• A total of 119 inmates were removed from under sentence of death—37 were executed
and 82 were removed by other methods, including sentences or convictions overturned,
commutations of sentence, and deaths by means other than execution.

This publication is one in a series. For a list of all publications in this series go to www.ojp.usdoj.gov/bjs/

2008 statistical tables
Table 1. Capital offenses, by state, 2008
Table 2. Method of execution, by state, 2008
Table 3. Federal capital offenses, 2008
Table 4. Prisoners under sentence of death, by region, jurisdiction, and race, 2007 and 2008
Table 5. Demographic characteristics of prisoners under sentence of death, 2008
Table 6. Hispanics and women under sentence of death, by jurisdiction, 2007 and 2008
Table 7. Age at time of arrest for capital offense and age of prisoners under sentence of death at yearend 2008
Table 8. Criminal history profile of prisoners under sentence of death, by race and Hispanic origin, 2008
Table 9. Number of persons executed, by jurisdiction, 1930-2008
Table 10. Executions and other dispositions of inmates sentenced to death, by race and Hispanic origin, 1977-2008
Table 11. Time under sentence of death and execution, by race, 1977-2008
Table 12. Women under sentence of death, by race and jurisdiction, 12/31/08
Table 13. Persons under sentence of death, by gender, race, and Hispanic origin, 12/31/08
Table 14. Number of inmates received under sentence of death, 1993-2008
Table 15. Number of persons executed, by year, 1977-2008
Table 16. Number of persons executed, by race, Hispanic origin, and method, 1977-2008
Table 17. Elapsed time since sentencing for inmates under sentence of death on 12/31/08, by gender, race, and Hispanic origin
Table 18. Advance count of executions: January 1, 2009 - November 30, 2009

2

Capital Punishment, 2008 - Statistical Tables

Table 1. Capital offenses, by state, 2008
State
Offense
Alabama
Intentional murder with 18 aggravating factors (Ala. Stat. Ann. 13A-5-40(a)(1)-(18)).
Arizona

First-degree murder accompanied by at least 1 of 14 aggravating factors (A.R.S. § 13-703(F)).

Arkansas

Capital murder (Ark. Code Ann. 5-10-101) with a finding of at least 1 of 10 aggravating
circumstances; treason.

California

First-degree murder with special circumstances; sabotage; train wrecking causing death; treason;
perjury causing execution of an innocent person; fatal assault by a prisoner serving a life sentence.

Colorado

First-degree murder with at least 1 of 17 aggravating factors; first-degree kidnapping resulting in
death; treason.

Connecticut

Capital felony with 8 forms of aggravated homicide (C.G.S. § 53a-54b).

Delaware

First-degree murder with at least 1 statutory aggravating circumstance (11 Del. C. § 4209).

Florida

First-degree murder; felony murder; capital drug trafficking; capital sexual battery.

Georgia

Murder; kidnapping with bodily injury or ransom when the victim dies; aircraft hijacking; treason.

Idaho

First-degree murder with aggravating factors; first-degree kidnapping; perjury resulting in death.

Illinois

First-degree murder with 1 of 21 aggravating circumstances (720 Ill. Comp. Stat. 5/9-1).

Indiana

Murder with 16 aggravating circumstances (IC 35-50-2-9).

Kansas

Capital murder with 8 aggravating circumstances (KSA 21-3439, KSA 21-4625, KSA 21-4636).

Kentucky

Murder with aggravating factors; kidnapping with aggravating factors (KRS 32.025).
a

Louisiana

First-degree murder; treason (La. R.S. 14:30 and 14:113).

Maryland

First-degree murder, either premeditated or during the commission of a felony, provided that certain
death eligibility requirements are satisfied.

Mississippi

Capital murder (Miss. Code Ann. § 97-3-19(2)); aircraft piracy (Miss. Code Ann. § 97-25-55(1)).

Missouri

First-degree murder (565.020 RSMO 2000).

Montana

Capital murder with 1 of 9 aggravating circumstances (Mont. Code Ann. § 46-18-303); aggravated
sexual intercourse without consent (Mont. Code Ann. § 45-5-503).

Nebraska

b

First-degree murder with a finding of at least 1 statutorily-defined aggravating circumstance.

Nevada

First-degree murder with at least 1 of 15 aggravating circumstances (NRS 200.030, 200.033,
200.035).

New Hampshire

Murder committed in the course of rape, kidnapping, or drug crimes; killing of a law enforcement
officer; murder for hire; murder by an inmate while serving a sentence of life without parole (RSA
630:1, RSA 630:5).

New Mexico

First-degree murder with at least 1 of 7 statutorily-defined aggravating circumstances (Section 30-2-1
A, NMSA).

c

New York

First-degree murder with 1 of 13 aggravating factors (NY Penal Law §125.27).

North Carolina

First-degree murder (NCGS §14-17).

Ohio

Aggravated murder with at least 1 of 10 aggravating circumstances (O.R.C. secs. 2903.01, 2929.02,
and 2929.04).

Oklahoma

First-degree murder in conjunction with a finding of at least 1 of 8 statutorily-defined aggravating
circumstances; sex crimes against a child under 14 years of age.

Oregon

Aggravated murder (ORS 163.095).

Pennsylvania

First-degree murder with 18 aggravating circumstances.

South Carolina

Murder with 1 of 12 aggravating circumstances (§ 16-3-20(C)(a)); criminal sexual conduct with a
minor with 1 of 9 aggravators (§ 16-3-655).

South Dakotad

First-degree murder with 1 of 10 aggravating circumstances.
Revision: Revised the code ~of criminal procedure. Changes included establishing procedures to be
used by circuit judges in determining whether to stop an execution because the inmate is mentally
incompetent (SDCL § 23A-27A-22) and clarifying that persons carrying out executions are immune
from civil and/or criminal liability (SDCL § 23A-27A-31.2), effective 7/1/2008.

Tennessee

First-degree murder with 1 of 15 aggravating circumstances (Tenn. Code Ann. § 39-13-204).

Texas

Criminal homicide with 1 of 9 aggravating circumstances (Tex. Penal Code § 19.03).

Utahd

Aggravated murder (76-5-202, Utah Code Annotated).
Revision: Amended the criminal code to allow aggravating circumstances to be treated as separate
acts from the capital offense which can be prosecuted as a separate offense (Utah Code Ann.
§ 76-5-202), effective 2/26/08.

Virginia

First-degree murder with 1 of 15 aggravating circumstances (VA Code § 18.2-31).

Washington

Aggravated first-degree murder.

Wyoming

First-degree murder; murder during the commission of sexual assault, sexual abuse of a minor,
arson, robbery, escape, resisting arrest, kidnapping, or abuse of a minor under 16.

a

The United States Supreme Court struck a portion of the Louisiana capital statute on June 25, 2008 (Kennedy v.
Louisiana, U.S. 128 S.Ct. 2641). The statute (La. Rev. Stat. Ann. § 14:42(D)(2)) allowing execution as a punishment for
the rape of a minor when no murder had been committed had been ruled constitutionally permissible by the Louisiana
Supreme Court. The U.S. Supreme Court found that since no national consensus existed for application of the death
penalty in cases of rape where no murder had been committed, such laws constiute cruel and unusual punishment under
the Eighth and Fourteenth Amendments. The ruling affects laws passed in Florida, Oklahoma, South Carolina, Texas, and
Montana.
b
The Nebraska Supreme Court struck a portion of the state’s capital statute on February 8, 2008 (State v. Mata, 745
N.W.2d 229, 278 (2008)). The court found that Nebraska’s electrocution procedure violated the state constitution’s
prohibition of cruel and unusual punishment.
c
The New York Court of Appeals has held that a portion of New York’s death penalty sentencing statute (CPL 400.27) was
unconstitutional (People v. Taylor, 9 N.Y.3d 129 (2007)). As a result, no defendants can be sentenced to death until the
legislature corrects the errors in this statute.
d
Two states revised statutory provisions relating to the death penalty during 2008.

Table 2. Method of execution, by state, 2008
Lethal Injection
Alabamaa
Arizonaa,b
Arkansas a,d
California a
Colorado
Connecticut
Delawarea,c
Floridaa

Electrocution
Alabamaa
Arkansas a,d
Floridaa
Illinois a,h
Kentuckya,j
Oklahomaf
South Carolina a
Tennesseea,k
Virginiaa

Lethal gas
Arizonaa,b
California a
Missouria
Wyoming i

Hanging
Delawarea,c
New Hampshirea,e
Washington a

Firing Squad
Idahoa
Oklahomaf
Utahg

Georgia
Idahoa
Illinois a
Indiana
Kansas
Kentuckya,j
Louisiana
Maryland
Mississippi
Missouria
Montana
Nevada
New Hampshirea
New Mexico
New York
North Carolina
Ohio
Oklahomaa
Oregon
Pennsylvania
South Carolina a
South Dakota
Tennesseea,k
Texas
Utaha
Virginiaa
Washington a
Wyoming a
Note: The method of execution of Federal prisoners is lethal injection, pursuant to 28 CFR, Part 26. For offenses under the Violent
Crime Control and Law Enforcement Act of 1994, the execution method is that of the State in which the conviction took place (18
U.S.C. 3596). In February 2008, the Nebraska Supreme Court ruled that electrocution violated the state's constitution. As of
12/31/2008, Nebraska had no authorized method of execution.
a
Authorizes two methods of execution.
b
Authorizes lethal injection for persons sentenced after November 15, 1992; inmates sentenced before that date may select lethal
injection or gas.
c
Authorizes lethal injection for those whose capital offense occurred on or after June 13, 1986; those who committed the offense
before that date may select lethal injection or hanging.
d
Authorizes lethal injection for those whose offense occurred on or after July 4, 1983; inmates whose offense occurred before that
date may select lethal injection or electrocution.
e
Authorizes hanging only if lethal injection cannot be given.
f
Authorizes electrocution if lethal injection is held to be unconstitutional, and firing squad if both lethal injection and electrocution are
held to be unconstitutional.
g
Authorizes firing squad if lethal injection is held unconstitutional. Inmates who selected execution by firing squad prior to May 3,
2004, may still be entitled to execution by that method.
h
Authorizes electrocution only if lethal injection is held illegal or unconstitutional.
i
Authorizes lethal gas if lethal injection is held to be unconstitutional.
j
Authorizes lethal injection for persons sentenced on or after March 31, 1998; inmates sentenced before that date may select lethal
injection or electrocution.
k
Authorizes lethal injection for those whose capital offense occurred after December 31, 1998; those who committed the offense
before that date may select electrocution by written waiver.

Table 3. Federal capital offenses, 2008
Statute
8 U.S.C. 1342
18 U.S.C. 32-34
18 U.S.C. 36
18 U.S.C. 37
18 U.S.C. 115(b)(3) [by crossreference to 18 U.S.C. 1111]
18 U.S.C. 241, 242, 245, 247
18 U.S.C. 351 [by cross-reference
to 18 U.S.C. 1111]
18 U.S.C. 794
18 U.S.C. 844(d), (f), (i)
18 U.S.C. 924(i)
18 U.S.C. 930
18 U.S.C. 1091
18 U.S.C. 1111
18 U.S.C. 1114
18 U.S.C. 1116
18 U.S.C. 1118
18 U.S.C. 1119
18 U.S.C. 1120
18 U.S.C. 1121
18 U.S.C. 1201
18 U.S.C. 1203
18 U.S.C. 1503
18 U.S.C. 1512
18 U.S.C. 1513
18 U.S.C. 1716
18 U.S.C. 1751[by cross-reference
to 18 U.S.C. 1111]
18 U.S.C. 1958
18 U.S.C. 1959
18 U.S.C. 1992
18 U.S.C. 2113
18 U.S.C. 2119
18 U.S.C. 2245
18 U.S.C. 2251
18 U.S.C. 2280
18 U.S.C. 2281
18 U.S.C. 2332
18 U.S.C. 2332a
18 U.S.C. 2340
18 U.S.C. 2381
21 U.S.C. 848(e)
49 U.S.C. 1472-1473

Description
Murder related to the smuggling of aliens.
Destruction of aircraft, motor vehicles, or related facilities resulting in death.
Murder committed during a drug-related drive-by shooting.
Murder committed at an airport serving international civil aviation.
Retaliatory murder of a member of the immediate family of law enforcement officials.
Civil rights offenses resulting in death.
Murder of a member of Congress, an important executive official, or a Supreme Court Justice.
Espionage.
Death resulting from offenses involving transportation of explosives, destruction of government
property, or destruction of property related to foreign or interstate commerce.
Murder committed by the use of a firearm during a crime of violence or a drug-trafficking crime.
Murder committed in a Federal Government facility.
Genocide.
First-degree murder.
Murder of a federal judge or law enforcement official.
Murder of a foreign official.
Murder by a federal prisoner.
Murder of a U.S. national in a foreign country.
Murder by an escaped federal prisoner already sentenced to life imprisonment.
Murder of a state or local law enforcement official or other person aiding in a federal investigation;
murder of a state correctional officer.
Murder during a kidnapping.
Murder during a hostage taking.
Murder of a court officer or juror.
Murder with the intent of preventing testimony by a witness, victim, or informant.
Retaliatory murder of a witness, victim, or informant.
Mailing of injurious articles with intent to kill or resulting in death.
Assassination or kidnapping resulting in the death of the President or Vice President.
Murder for hire.
Murder involved in a racketeering offense.
Willful wrecking of a train resulting in death.
Bank-robbery-related murder or kidnapping.
Murder related to a carjacking.
Murder related to rape or child molestation.
Murder related to sexual exploitation of children.
Murder committed during an offense against maritime navigation.
Murder committed during an offense against a maritime fixed platform.
Terrorist murder of a U.S. national in another country.
Murder by the use of a weapon of mass destruction.
Murder involving torture.
Treason.
Murder related to a continuing criminal enterprise or related murder of a federal, state, or local law
enforcement officer.
Death resulting from aircraft hijacking.

Table 4. Prisoners under sentence of death, by region, jurisdiction, and race, 2007 and 2008

Region and
jurisdiction

Prisoners under sentence
of death, 12/31/07
b

Total

White

c

Received under sentence
of death, 2008
c

Black

b

Total

White

c

c

Black

Removed from death row
(excluding executions),
2008a
b

Total

White

c

c

Black

Prisoners under sentence
of death, 12/31/08

Executed, 2008
b

Total

White

c

c

Black

b

Total

U.S. total
3,215
1,806
1,338
111
65
44
82
53
27
37
20
17
3,207
Federald
48
21
26
3
2
1
0
0
0
0
0
0
51
State
3,167
1,785
1,312
108
63
43
82
53
27
37
20
17
3,156
Northeast
233
84
139
7
4
3
6
3
2
0
0
0
234
Connecticut
9
4
5
1
0
1
0
0
0
0
0
0
10
New Hampshire
0
0
0
1
0
1
0
0
0
0
0
0
1
New York
0
0
0
0
0
0
0
0
0
0
0
0
0
Pennsylvania
224
80
134
5
4
1
6
3
2
0
0
0
223
Midwest
272
144
125
14
8
6
14
8
6
2
1
1
270
Illinois
13
8
5
3
3
0
1
1
0
0
0
0
15
Indiana
14
11
3
0
0
0
1
1
0
0
0
0
13
Kansas
7
3
4
2
2
0
1
1
0
0
0
0
8
Missouri
45
25
20
6
3
3
1
0
1
0
0
0
50
Nebraska
9
8
1
0
0
0
0
0
0
0
0
0
9
Ohio
181
86
92
3
0
3
10
5
5
2
1
1
172
South Dakota
3
3
0
0
0
0
0
0
0
0
0
0
3
South
1,732
952
757
58
33
25
49
32
16
35
19
16
1,706
Alabama
199
106
93
9
3
6
3
2
1
0
0
0
205
Arkansas
38
14
24
3
2
1
0
0
0
0
0
0
41
Delaware
19
10
9
1
0
1
0
0
0
0
0
0
20
Florida
388
255
133
16
11
5
12
10
2
2
1
1
390
Georgia
106
59
46
3
1
2
1
1
0
3
2
1
105
Kentucky
38
31
7
0
0
0
1
0
1
1
1
0
36
Louisiana
85
31
53
3
1
2
4
4
0
0
0
0
84
Maryland
5
1
4
0
0
0
0
0
0
0
0
0
5
Mississippi
65
32
32
0
0
0
3
2
1
2
2
0
60
North Carolina
166
69
88
1
0
1
6
3
3
0
0
0
161
Oklahoma
80
43
33
9
4
5
2
0
2
2
2
0
85
South Carolina
59
23
36
4
4
0
2
1
1
3
1
2
58
Tennessee
96
56
38
0
0
0
9
7
2
0
0
0
87
Texas
367
214
148
9
7
2
4
2
1
18
9
9
354
Virginia
21
8
13
0
0
0
2
0
2
4
1
3
15
West
930
605
291
29
18
9
13
10
3
0
0
0
946
Arizona
117
100
14
6
5
0
4
3
1
0
0
0
119
California
655
389
238
20
12
7
6
4
2
0
0
0
669
Colorado
1
0
1
1
0
1
0
0
0
0
0
0
2
Idaho
17
17
0
0
0
0
0
0
0
0
0
0
17
Montana
2
2
0
0
0
0
0
0
0
0
0
0
2
Nevada
82
50
31
1
0
1
2
2
0
0
0
0
81
New Mexico
2
2
0
0
0
0
0
0
0
0
0
0
2
Oregon
35
31
3
0
0
0
0
0
0
0
0
0
35
Utah
9
7
1
1
1
0
0
0
0
0
0
0
10
Washington
8
5
3
0
0
0
0
0
0
0
0
0
8
Wyoming
2
2
0
0
0
0
1
1
0
0
0
0
1
Note: Some figures shown for yearend 2007 are revised from those reported in Capital Punishment, 2007 - Statistical Tables, NCJ 224528.The
revised figures include 6 inmates who were either reported late to the National Prisoner Statistics program or were not in custody of State
correctional authorities on 12/31/07 (3 in Pennsylvania and 1 each in Georgia, Virginia, and Arizona). The revised figures also exclude 11 inmates
who were relieved of a death sentence before 12/31/07 (5 in Texas and 1 each in Ohio, Florida, Kentucky, Louisiana, North Carolina, and
Nevada).
a

Includes 16 deaths from natural causes (3 each in Pennsylvania, Florida, and North Carolina; 2 each in Alabama and California; and 1 each in
Ohio, Tennessee, and Nevada) and 7 deaths from suicide (2 each in Texas and California; and 1 each in Pennsylvania, Illinois, and Florida).
b
Includes American Indians, Alaska Natives, Asians, Native Hawaiians, and other Pacific Islanders.
c
The reporting of race and Hispanic origin differs from that presented in tables 8 and 10. In this table counts of white and black inmates include
persons of Hispanic/Latino origin.
d
Excludes persons held under Armed Forces jurisdiction with a military death sentence for murder.

White

c

1,798
23
1,775
85
4
0
0
81
143
10
10
4
28
8
80
3
934
107
16
10
255
57
30
28
1
28
66
45
25
49
210
7
613
102
397
0
17
2
48
2
31
8
5
1

c

Black

1,338
27
1,311
140
6
1
0
133
124
5
3
4
22
1
89
0
750
98
25
10
135
47
6
55
4
31
86
36
33
36
140
8
297
13
243
2
0
0
32
0
3
1
3
0

Table 5. Demographic characteristics of prisoners under sentence
of death, 2008
Prisoners under sentence of death, 2008
Characteristic
Yearend
Admissions
Removals
Total inmates
3,207
111
119
Gender
Male
98.2 %
97.3 %
99.2
Female
1.8
2.7
0.8
Racea
White
56.1 %
58.6 %
61.3
Black
41.7
39.6
37.0
All other races b
2.2
1.8
1.7
Hispanic origin
Hispanic
13.2 %
19.8 %
8.1
Non-Hispanic
86.8
80.2
91.9
Number unknown
384
5
8
Education
8th grade or less
13.5 %
17.1 %
19.2
9th-11th grade
36.5
31.7
36.4
High school graduate/GED
40.8
41.5
35.4
Any college
9.2
9.8
9.1
Median
12th
12th
11th
Number unknown
528
29
20
Marital status
Married
22.2 %
18.3 %
20.2
Divorced/separated
20.1
19.5
27.9
Widowed
2.9
4.9
1.9
Never married
54.7
57.3
50.0
Number unknown
371
29
15
Note: Calculations are based on those cases for which data were
reported. Detail may not add to total due to rounding.
a
Includes persons of Hispanic/Latino origin.
b
At yearend 2008, inmates in "all other races" consisted of 27
American Indians, 35 Asians, and 9 self-identified Hispanics. During
2008, 1 American Indian and 1 Asian were admitted; and 1 Asian
and 1 self-identified Hispanic were removed.

%

%

%

%

%

Table 6. Hispanics and women under sentence of death, by jurisdiction, 2007 and 2008

Jurisdiction

Under sentence
of death, 12/31/07 a
Hispanics
Women

Received under sentence
of death, 2008
Hispanics
Women

Death sentence
removed, 2008 b
Hispanics
Women

U.S. total
361
56
21
3
Federal
4
1
0
1
Alabama
1
4
1
0
Arizona
17
2
2
0
California
144
15
8
0
Connecticut
1
0
0
0
Delaware
2
0
0
0
Florida
32
0
1
1
Georgia
2
1
0
0
Idaho
1
1
0
0
Illinois
2
0
0
0
Indiana
1
1
0
0
Kentucky
1
1
0
0
Louisiana
1
2
1
0
Mississippi
0
3
0
0
Nebraska
3
0
0
0
Nevada
7
0
0
0
New Mexico
1
0
0
0
North Carolina
4
5
0
0
Ohio
5
2
0
0
Oklahoma
2
1
0
0
Oregon
2
0
0
0
Pennsylvania
21
5
2
0
South Carolina
0
0
1
0
Tennessee
1
2
0
0
Texas
104
9
4
1
Utah
2
0
1
0
Virginia
0
1
0
0
a
The count of Hispanics under sentence of death at yearend 2007 has been revised.
b
Includes 3 Hispanic men in Texas who were executed in 2008.

9
0
0
1
1
0
0
0
0
0
0
0
0
0
0
0
0
0
0
0
0
0
2
0
0
5
0
0

1
0
0
0
0
0
0
0
0
0
0
0
0
0
0
0
0
0
0
1
0
0
0
0
0
0
0
0

Under sentence
of death, 12/31/08
Hispanics
Women
373
4
2
18
151
1
2
33
2
1
2
1
1
2
0
3
7
1
4
5
2
2
21
1
1
103
3
0

58
2
4
2
15
0
0
1
1
1
0
1
1
2
3
0
0
0
5
1
1
0
5
0
2
10
0
1

Table 7. Age at time of arrest for capital offense and age of prisoners
under sentence of death at yearend 2008

Age

Prisoners under sentence of death
At time of arrest
On December 31, 2008
Number*
Percent
Number
Percent

Total number under sentence of
death on 12/31/08
2,957
100 %
3,207
19 or younger
311
10.5
0
20-24
811
27.4
44
25-29
682
23.1
222
30-34
507
17.1
388
35-39
317
10.7
564
40-44
172
5.8
543
45-49
93
3.1
575
50-54
36
1.2
394
55-59
21
0.7
245
60-64
5
0.2
161
65 or older
2
0.1
71
Mean age
29 yrs.
43 yrs.
Median age
27 yrs.
43 yrs.
Note: The youngest person under sentence of death was a black male in Texas,
born in June 1988 and sentenced to death in June 2007. The oldest person under
sentence of death was a white male in Arizona, born in September 1915 and
sentenced to death in June 1983.
*Excludes 250 inmates for whom the date of arrest for capital offense was not
available.

100 %
1.4
6.9
12.1
17.6
16.9
17.9
12.3
7.6
5.0
2.2

Table 8. Criminal history profile of prisoners under sentence of death,
by race and Hispanic origin, 2008
Percent of prisoners under sentence of death a
All
White c
Blackc
Hispanic
b

U.S. total
Prior felony convictions
Yes
No
Number unknown
Prior homicide convictions
Yes
No
Number unknown
Legal status at time of
capital offense
Charges pending
Probation
Parole
On escape
Incarcerated
Other status
None
Number unknown
a

100 %

100 %

100 %

100 %

65.5 %
34.5
260

61.8 %
38.2

71.1 %
28.9

61.7 %
38.3

8.3 %
91.7
52

8.4 %
91.6

8.7 %
91.3

6.5 %
93.5

7.8 %
10.6
15.3
1.4
3.7
0.4
60.8
347

8.9 %
8.9
13.2
1.9
4.1
0.4
62.6

7.5 %
12.3
16.3
0.9
3.6
0.4
59.0

5.0 %
11.5
19.8
1.5
2.7
0.3
59.3

Percentages are based on those offenders for whom data were reported.
Detail may not add to total because of rounding.
b
Includes American Indians, Alaska Natives, Asians, Native Hawaiians, and
other Pacific Islanders.
c
Excludes persons of Hispanic/Latino origin.

Table 9. Number of persons executed,
by jurisdiction, 1930-2008

Jurisdiction
U.S. total
Texas
Georgia
New York
North Carolina
California
Florida
South Carolina
Ohio
Virginia
Alabama
Mississippi
Louisiana
Pennsylvania
Oklahoma
Arkansas
Missouri
Kentucky
Illinois
Tennessee
New Jersey
Maryland
Arizona
Indiana
Washington
Colorado
Nevada
District of Columbia
West Virginia
Federal system
Massachusetts
Delaware
Connecticut
Oregon
Utah
Iowa
Kansas
Montana
New Mexico
Wyoming
Nebraska
Idaho
Vermont
South Dakota
New Hampshire

Number executed
Since 1930
Since 1977
4,995
720
409
329
306
305
236
202
200
194
173
164
160
155
148
145
128
106
102
97
74
73
61
60
51
48
41
40
40
36
27
26
22
21
19
18
15
9
9
8
7
4
4
2
1

1,136
423
43
0
43
13
66
40
28
102
38
10
27
3
88
27
66
3
12
4
0
5
23
19
4
1
12
0
0
3
0
14
1
2
6
0
0
3
1
1
3
1
0
1
0

Table 10. Executions and other dispositions of inmates sentenced to death,
by race and Hispanic origin, 1977-2008

Race/Hispanic
origin
Total
White c
Blackc
Hispanic
All other races c,d

Total under
sentence
of death
1977-2008 b
7,658
3,726
3,139
673
120

Prisoners executed
Percent
of total
Number
1,136
648
390
84
14

14.8 %
17.4 %
12.4
12.5
11.7

Prisoners who received
other dispositions a
Percent
of total
Number
3,315
1,631
1,421
216
47

a

Includes persons removed from a sentence of death because of statutes struck down
on appeal, sentences or convictions vacated, commutations, or death by other than
execution.

b

Includes 6 persons sentenced to death prior to 1977 who were still under sentence of
death on 12/31/08; 374 persons sentenced to death prior to 1977 whose death
sentence was removed between 1977 and 12/31/08; and 7,278 persons sentenced to
death between 1977 and 2008.
c
Excludes persons of Hispanic/Latino origin.
d

Includes American Indians, Alaska Natives, Asians, Native Hawaiians, and other
Pacific Islanders.

43.3 %
43.8
45.3
32.1
39.2

Table 11. Time under sentence of death and execution,
by race, 1977-2008

Year of execution
Total
1977-83
1984
1985
1986
1987
1988
1989
1990
1991
1992
1993
1994
1995
1996
1997
1998
1999
2000
2001
2002
2003
2004
2005
2006
2007
2008

All races a
1,136
11
21
18
18
25
11
16
23
14
31
38
31
56
45
74
68
98
85
66
71
65
59
60
53
42
37

Number executed
White b

Blackb

728
9
13
11
11
13
6
8
16
7
19
23
20
33
31
45
48
61
49
48
53
44
39
41
32
28
20

Note: Average time was calculated from the most recent
sentencing date.
a

Includes American Indians, Alaska Natives, Asians, Native
Hawaiians, and other Pacific Islanders.
b
Includes persons of Hispanic/Latino origin.

393
2
8
7
7
12
5
8
7
7
11
14
11
22
14
27
18
33
35
17
18
20
19
19
21
14
17

Average elapsed time
from sentence to execution
for all inmates
128 mo
51 mo
74
71
87
86
80
95
95
116
114
113
122
134
125
133
130
143
137
142
127
131
132
147
145
153
139

Table 12. Women under sentence of death,
by race and jurisdiction, 12/31/2008
Jurisdiction

All races a

White b

Blackb

Total
58
40
15
California
15
11
2
Texas
10
6
4
Pennsylvania
5
2
3
North Carolina
5
2
2
Alabama
4
2
2
Mississippi
3
3
0
Federal
2
2
0
Louisiana
2
1
1
Tennessee
2
2
0
Arizona
2
2
0
Ohio
1
1
0
Florida
1
1
0
Georgia
1
1
0
Kentucky
1
1
0
Oklahoma
1
1
0
Virginia
1
1
0
Idaho
1
1
0
Indiana
1
0
1
a
Includes American Indians, Alaska Natives, Asians,
Native Hawaiians, and other Pacific Islanders.
b
Excludes persons of Hispanic/Latino origin.

Table 13. Persons under sentence of
death, by gender, race, and Hispanic
origin, 12/31/2008
Persons under sentence
of death
Male
Female
White
1,758
40
Hispanic
347
4
Black
1,323
15
Hispanic
10
0
All other races*
68
3
Hispanic
10
2
*Includes American Indians, Alaska
Natives, Asians, Native Hawaiians, and
other Pacific Islanders.

Table 14. Number of inmates received
under sentence of death, 1993-2008

Year
1993
1994
1995
1996
1997
1998
1999
2000
2001
2002
2003
2004
2005
2006
2007
2008

Inmates
received
295
328
326
323
281
306
284
235
167
169
154
140
138
122
119
111

Table 15. Number of persons executed,
by year, 1977-2008

Year
1977
1979
1981
1982
1983
1984
1985
1986
1987
1988
1989
1990
1991
1992
1993
1994
1995
1996
1997
1998
1999
2000
2001
2002
2003
2004
2005
2006
2007
2008

Number
of inmates
executed
1
2
1
2
5
21
18
18
25
11
16
23
14
31
38
31
56
45
74
68
98
85
66
71
65
59
60
53
42
37

Table 16. Number of persons executed, by race, Hispanic origin,
and method, 1977-2008

Method of execution

White*

Number of persons executed
American
Indian*
Black*
Hispanic

Total
648
390
Lethal injection
553
317
Electrocution
82
70
Lethal gas
8
3
Hanging
3
0
Firing squad
2
0
*Excludes persons of Hispanic/Latino origin.

84
82
2
0
0
0

8
7
1
0
0
0

Asian*
6
6
0
0
0
0

Table 17. Elapsed time since sentencing for inmates
under sentence of death on 12/31/2008, by gender, race,
and Hispanic origin
Elapsed time since sentencing
Inmates under
sentence of death

Mean

Median

Total
147 mo
141 mo
Male
148
142
Female
110
107
White*
150
145
Black*
149
144
Hispanic
131
122
Note: For those persons sentenced to death
more than once, the data are based on the
most recent death sentence.
*Excludes persons of Hispanic/Latino origin.

Table 18. Advance count of executions:
January 1, 2009 - November 30, 2009

Jurisdiction

Number of
executions

Texas
Alabama
Ohio
Georgia
Oklahoma
Virginia
Florida
South Carolina
Missouri
Tennessee

23
6
4
3
3
3
2
2
1
1

Total

48

Note: Of the 48 execution carried out during
this period, 47 were by lethal injection; 1
execution in Virginia was carried out by
electrocution.


