

Doj Juveniles in Residential Treatment 1997-2008
Download original document:
Document text
Document text
This text is machine-read, and may contain errors. Check the original document to verify accuracy.
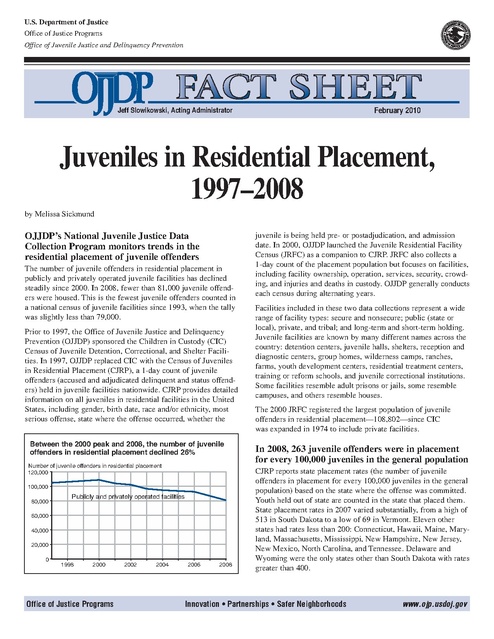
U.S. Department of Justice
Office of Justice Programs
Office of Juvenile Justice and Delinquency Prevention

February 2010

Jeff Slowikowski, Acting Administrator

Juveniles in Residential Placement,
1997–2008
by Melissa Sickmund

OJJDP’s National Juvenile Justice Data
Collection Program monitors trends in the
residential placement of juvenile offenders
The number of juvenile offenders in residential placement in
publicly and privately operated juvenile facilities has declined
steadily since 2000. In 2008, fewer than 81,000 juvenile offenders were housed. This is the fewest juvenile offenders counted in
a national census of juvenile facilities since 1993, when the tally
was slightly less than 79,000.
Prior to 1997, the Office of Juvenile Justice and Delinquency
Prevention (OJJDP) sponsored the Children in Custody (CIC)
Census of Juvenile Detention, Correctional, and Shelter Facilities. In 1997, OJJDP replaced CIC with the Census of Juveniles
in Residential Placement (CJRP), a 1-day count of juvenile
offenders (accused and adjudicated delinquent and status offenders) held in juvenile facilities nationwide. CJRP provides detailed
information on all juveniles in residential facilities in the United
States, including gender, birth date, race and/or ethnicity, most
serious offense, state where the offense occurred, whether the
Between the 2000 peak and 2008, the number of juvenile
offenders in residential placement declined 26%
Number of juvenile offenders in residential placement
120,000
100,000
80,000

Publicly and privately operated facilities

60,000
40,000
20,000
0
1998

2000

Office of Justice Programs

2002

2004

2006

2008

juvenile is being held pre- or postadjudication, and admission
date. In 2000, OJJDP launched the Juvenile Residential Facility
Census (JRFC) as a companion to CJRP. JRFC also collects a
1-day count of the placement population but focuses on facilities,
including facility ownership, operation, services, security, crowding, and injuries and deaths in custody. OJJDP generally conducts
each census during alternating years.
Facilities included in these two data collections represent a wide
range of facility types: secure and nonsecure; public (state or
local), private, and tribal; and long-term and short-term holding.
Juvenile facilities are known by many different names across the
country: detention centers, juvenile halls, shelters, reception and
diagnostic centers, group homes, wilderness camps, ranches,
farms, youth development centers, residential treatment centers,
training or reform schools, and juvenile correctional institutions.
Some facilities resemble adult prisons or jails, some resemble
campuses, and others resemble houses.
The 2000 JRFC registered the largest population of juvenile
offenders in residential placement—108,802—since CIC
was expanded in 1974 to include private facilities.

In 2008, 263 juvenile offenders were in placement
for every 100,000 juveniles in the general population
CJRP reports state placement rates (the number of juvenile
offenders in placement for every 100,000 juveniles in the general
population) based on the state where the offense was committed.
Youth held out of state are counted in the state that placed them.
State placement rates in 2007 varied substantially, from a high of
513 in South Dakota to a low of 69 in Vermont. Eleven other
states had rates less than 200: Connecticut, Hawaii, Maine, Maryland, Massachusetts, Mississippi, New Hampshire, New Jersey,
New Mexico, North Carolina, and Tennessee. Delaware and
Wyoming were the only states other than South Dakota with rates
greater than 400.

Innovation • Partnerships • Safer Neighborhoods

www.ojp.usdoj.gov

Nearly half (46%) of all juvenile offenders in residential
placement were held by the 6 states with the largest
placement populations: California, Texas, Florida,
Pennsylvania, Ohio, and New York
State where offense
occurred (upper age of
juvenile court jurisdiction)
U.S. Total
Alabama (17)
Alaska (17)
Arizona (17)
Arkansas (17)
California (17)
Colorado (17)
Connecticut (15)
Delaware (17)
Dist. of Columbia (17)
Florida (17)
Georgia (16)
Hawaii (17)
Idaho (17)
Illinois (16)
Indiana (17)
Iowa (17)
Kansas (17)
Kentucky (17)
Louisiana (16)
Maine (17)
Maryland (17)
Massachusetts (16)
Michigan (16)
Minnesota (17)
Mississippi (17)
Missouri (16)
Montana (17)
Nebraska (17)
Nevada (17)
New Hampshire (16)
New Jersey (17)
New Mexico (17)
New York (15)
North Carolina (15)
North Dakota (17)
Ohio (17)
Oklahoma (17)
Oregon (17)
Pennsylvania (17)
Rhode Island (17)
South Carolina (16)
South Dakota (17)
Tennessee (17)
Texas (16)
Utah (17)
Vermont (17)
Virginia (17)
Washington (17)
West Virginia (17)
Wisconsin (16)
Wyoming (17)

Number of juvenile
offenders in public
or private residential
placement, 2007

Residential
placement
rate, 2007

86,814
1,650
321
1,485
810
14,034
1,752
426
369
288
5,733
2,736
129
528
2,565
2,727
954
1,146
1,116
1,350
204
930
969
2,748
1,317
450
1,227
210
708
996
156
1,677
378
3,612
1,035
213
4,332
864
1,299
4,554
312
1,200
456
1,263
7,035
867
45
2,124
1,527
570
1,422
249

279
325
383
208
261
329
339
148
401
588
315
286
101
298
204
382
294
370
247
321
150
149
167
274
230
131
218
204
359
348
125
176
170
239
144
322
341
219
330
344
282
292
513
191
287
262
69
261
218
320
269
443

Note: State of offense was not reported for 1,748 juveniles.

Melissa Sickmund, Ph.D., Chief of Systems Research with the National
Center for Juvenile Justice, prepared this document as a product of the
National Juvenile Justice Data Analysis Project, which is supported by
OJJDP grant 2008–JF–FX–K071.

Fact Sheet

Between 1997 and 2008, the decline in placement rates
(26%) was not as sharp as the decline in arrest rates (33%)
Juvenile arrest rate
10,000

Juvenile residential placement rate
400

Placements

8,000

300

Arrests

6,000

200
4,000
100

2,000
0
1998

2000

2002

2004

2006

0
2008

Declines in state residential placement rates were
widespread across the country

DC

Change in placement
rate, 1997–2007
Decrease of 3% or more
No change (less than 3% + or –)
Increase of 3% or more

Q From 1997 to 2007, 35 states experienced declines in their residential placement rates, 10 experienced increases, and 5 states and
the District of Columbia saw virtually no change.

Definitions
The residential placement rate is the number of juvenile offenders
assigned a bed in a public or private facility on the census date
per 100,000 youth ages 10 through the state’s upper age of original juvenile court jurisdiction in the general population. The
juvenile arrest rate is the number of arrests involving juveniles
per 100,000 youth ages 10 through 17 in the general population.

For further information
OJJDP’s Statistical Briefing Book (ojjdp.ncjrs.gov/ojstatbb) provides access to CJRP data through two data analysis tools, the
CJRP Databook and Easy Access to the CJRP. The Briefing Book
also includes information on JRFC through bulletins that summarize each wave of data collection.
The Office of Juvenile Justice and Delinquency Prevention is a component
of the Office of Justice Programs, which also includes the Bureau of Justice
Assistance; the Bureau of Justice Statistics; the Community Capacity
Development Office; the National Institute of Justice; the Office for Victims
of Crime; and the Office of Sex Offender Sentencing, Monitoring,
Apprehending, Registering, and Tracking (SMART).

NCJ 229379

