

Doj Statistical Tables on Jail Inmates 2010
Download original document:
Document text
Document text
This text is machine-read, and may contain errors. Check the original document to verify accuracy.
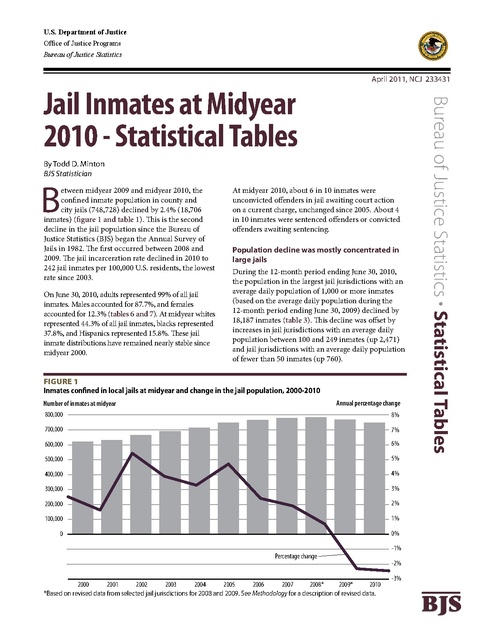
U.S. Department of Justice Office of Justice Programs Bureau of Justice Statistics By Todd D. Minton BJS Statistician B etween midyear 2009 and midyear 2010, the confined inmate population in county and city jails (748,728) declined by 2.4% (18,706 inmates) (figure 1 and table 1). This is the second decline in the jail population since the Bureau of Justice Statistics (BJS) began the Annual Survey of Jails in 1982. The first occurred between 2008 and 2009. The jail incarceration rate declined in 2010 to 242 jail inmates per 100,000 U.S. residents, the lowest rate since 2003. On June 30, 2010, adults represented 99% of all jail inmates. Males accounted for 87.7%, and females accounted for 12.3% (tables 6 and 7). At midyear whites represented 44.3% of all jail inmates, blacks represented 37.8%, and Hispanics represented 15.8%. These jail inmate distributions have remained nearly stable since midyear 2000. At midyear 2010, about 6 in 10 inmates were unconvicted offenders in jail awaiting court action on a current charge, unchanged since 2005. About 4 in 10 inmates were sentenced offenders or convicted offenders awaiting sentencing. Population decline was mostly concentrated in large jails During the 12-month period ending June 30, 2010, the population in the largest jail jurisdictions with an average daily population of 1,000 or more inmates (based on the average daily population during the 12-month period ending June 30, 2009) declined by 18,187 inmates (table 3). This decline was offset by increases in jail jurisdictions with an average daily population between 100 and 249 inmates (up 2,471) and jail jurisdictions with an average daily population of fewer than 50 inmates (up 760). Figure 1 Inmates confined in local jails at midyear and change in the jail population, 2000-2010 Annual percentage change Number of inmates at midyear 800,000 8% 700,000 7% 600,000 6% 500,000 5% 400,000 4% 300,000 3% 200,000 2% 100,000 1% 0 0% Percentage change 2000 2001 2002 2003 2004 2005 2006 2007 2008* 2009* 2010 *Based on revised data from selected jail jurisdictions for 2008 and 2009. See Methodology for a description of revised data. Bureau of Justice Statistics · Statistical Tables Jail Inmates at Midyear 2010 - Statistical Tables April 2011, NCJ 233431 -1% -2% -3% BJS Population declines were mostly concentrated among large jails. Declines were reported in the inmate population between midyear 2009 and midyear 2010 in two-thirds (111 jails) of the 170 jail jurisdictions with 1,000 or more inmates on an average day during the 12-month period ending June 30, 2010. About a third (57 large jails) reported an increase in their inmate population during the 12-month period ending June 30, 2010. Data were estimated for two large jail jurisdictions that did not respond to the survey in 2010, resulting in no change in their inmate population during this period. (See Methodology for a description of estimation and weighting procedures.) Six jail jurisdictions account for nearly half of the decline in jail population Six jail jurisdictions reported a drop of more than 1,000 inmates (accounting for 46% of the decline nationwide). Los Angeles County, California, with a drop of 3,007 inmates, led the nation in overall decline in their inmate population during the 12-month period ending June 30, 2010. Five other jail jurisdictions reported a decline of more than 1,000 inmates, including Maricopa County, Arizona (1,196 inmates); Orange County, California (1,143); Philadelphia, Pennsylvania (1,111); Fresno County, California (1,105); and Harris County, Texas (1,096). Capacity to hold inmates continues to increase at slower rate The estimated rated capacity for all jail jurisdictions at midyear 2010 reached 866,974 beds (table 2), an increase of 2.0% (17,079 beds) from midyear 2009. This was less than the average annual increase each year since 2000 (2.5% or 22,281 beds). Rated capacity is the maximum number of beds or inmates allocated to each jail facility by a state or local rating official. The percentage of capacity occupied at midyear 2010 (86.4%) was the lowest since 1984. Jail jurisdictions holding 50 or more inmates experienced a decline in the percent of bed space occupied between midyear 2009 (91.5%) and 2010 (87.4%) (not shown in a table). In jail jurisdictions holding fewer than 50 inmates, the jail inmate population grew slightly faster than the rated capacity. As a result, the percent of capacity occupied at midyear 2010 (63.3%) was slightly larger than in 2009 (62.2%) (table 5). 2 The amount of bed space occupied was also measured based on an average daily population in jail jurisdictions (748,553) in the year ending June 30, 2010, and the most crowded day in jails during June 2010. Overall, the nation’s jails were operating at about 86% of rated capacity on an average day and about 91% of rated capacity on their most crowded day in June 2010. Local jails admitted almost 13 million persons during the 12 months ending June 30, 2010 The jail population at midyear 2010 represented a comparatively small percentage of all admissions reported over the 12-month period. Local jails admitted an estimated 12.9 million persons during the 12 months ending June 30, 2010, or about 17 times the size of the inmate population (748,728) at midyear. (See Methodology on page 15 for methods used to estimate admissions.) Nearly 4 in 10 (39%) admissions during the last week of June 2010 were to the largest jail jurisdictions (table 4). Small jail jurisdictions holding fewer than 50 inmates accounted for 6.3% of all jail admissions, but the number of inmates admitted was about 36 times the size of the inmate population at midyear 2010. They also experienced the highest turnover rate (136.7%), compared to large jail jurisdictions (51.5%). The turnover rate takes into account all admissions into and releases from jails. Higher turnover rates mean relatively larger numbers of admissions and releases relative to the size of the average daily population. Jail Inmates at Midyear 2010 – Statistical Tables Annual Survey of Jails (ASJ)—functions and definition of terms Jails in the ASJ include confinement facilities—usually administered by a local law enforcement agency—that are intended for adults but may hold juveniles before or after adjudication. Facilities include jails and city or county correctional centers; special jail facilities, such as medical or treatment release centers, halfway houses, and work farms; and temporary holding or lockup facilities that are part of the jail’s combined function. Inmates sentenced to jail facilities usually are sentenced to serve a year or less. Jail functions Within the ASJ, jail functions are to— receive individuals pending arraignment and hold them awaiting trial, conviction, or sentencing re-admit probation, parole, and bail bond violators and absconders temporarily detain juveniles pending transfer to juvenile authorities hold mentally ill persons pending their movement to appropriate mental health facilities hold individuals for the military, for protective custody, for contempt, and for the courts as witnesses release convicted inmates to the community upon completion of sentence transfer inmates to federal, state, or other authorities house inmates for federal, state, or other authorities because of crowding of their facilities sometimes operate community-based programs as alternatives to incarceration. Definition of terms Admissions—persons are officially booked and housed in jails by formal legal document and the authority of the courts or some other official agency. Jail admissions include persons sentenced to weekend programs and who are booked into the facility for the first time. Excluded from jail admissions are inmates re-entering the facility after an escape, work release, medical or treatment facility appointment, and bail and court appearances. BJS collects jail admissions for the last 7 days in June. Average daily population—derived by the sum of inmates in jail each day for a year, divided by the number of days in the year (i.e., between July 1, 2009, and June 30, 2010). April 2011 Average annual change—denotes the mean average change across a 12-month time period. Calculating annual admissions—the number of jail admissions during the last 7 days in June. Annual jail admissions are calculated by multiplying weekly admissions by the sum of 365 days divided by 7 days. Calculating weekly jail turnover rate—calculated by adding admissions and releases and dividing by the average daily population. See Methodology for additional information. Inmates confined at midyear—the number of inmates held in custody on the last weekday in June. Jail incarceration rate—the number of inmates held in the custody of local jails, per 100,000 U.S. residents. Percent of capacity occupied—calculated by taking the number of inmates at midyear, dividing by the rated capacity, and multiplying by 100. Rated capacity—describes the number of beds or inmates assigned by a rating official to a facility, excluding separate temporary holding areas. Releases—persons released after a period of confinement (e.g., sentence completion, bail/bond releases, other pretrial releases, transfers to other jurisdictions, and deaths). Releases include those persons who have completed their weekend program and who are leaving the facility for the last time. Excluded from jail releases are temporary discharges including work release, medical or treatment center appointment, court appearance, furlough, day reporting, and transfers to other facilities within the jail jurisdiction. Under jail supervision but not confined—includes all persons in community-based programs operated by a jail facility. Programs include electronic monitoring, house arrest, community service, day reporting, and work programs. The classification excludes persons on pretrial release and who are not in a community-based program run by the jail, as well as persons under supervision of probation, parole or other agencies, inmates on weekend programs, and inmates who participate in work release programs and return to the jail at night. Weekend programs—offenders in these programs are allowed to serve their sentences of confinement only on weekends (i.e., Friday through Sunday). 3 List of Tables Table 1. Inmates confined in local jails at midyear, average daily population, and incarceration rates, 2000-2010 Table 2. Rated capacity of local jails and percent of capacity occupied, 2000-2010 Table 3. Inmates confined in local jails at midyear, by size of jurisdiction, 2009 and 2010 Table 4. Average daily jail population, admissions, and turnover rate, by size of jurisdiction, week ending June 30, 2009 and 2010 Table 5. Percent of jail capacity occupied at midyear, by size of jurisdiction, 2009, and 2010 Table 6. Number of inmates in local jails, by characteristic, midyear 2000 and 2005-2010 Table 7. Percent of inmates in local jails, by characteristic, midyear 2000 and 2005-2010 Table 8. Inmate population in jail jurisdictions reporting on confined persons being held for U.S. Immigration and Customs Enforcement, midyear 2002-2010 Table 9. The 50 largest local jail jurisdictions, by number of inmates held, average daily population, and rated capacity, midyear 2008-2010 Table 10. Persons under jail supervision, by confinement status and type of program, midyear 2000 and 2006-2010 Table 11. Estimated standard errors, by confinement status, Annual Survey of Jails, 2010 Table 12. Estimated standard errors, by selected characteristics, Annual Survey of Jails, 2010 Table 13. Estimated percentages of local jail inmates, by selected characteristics and ratio estimates, 2010 4 Jail Inmates at Midyear 2010 – Statistical Tables Table 1 Inmates confined in local jails at midyear, average daily population, and incarceration rates, 2000-2010 Average daily populationa Inmates confined at midyear Year Number 2000 621,149 2001 631,240 2002 2003 Percentage change Jail incarceration rateb Number Percentage change 2.5% 618,319 1.7% 220 1.6 625,966 1.2 222 665,475 5.4 652,082 4.2 231 691,301 3.9 680,760 4.4 238 2004 713,990 3.3 706,242 3.7 243 2005 747,529 4.7 733,442 3.9 252 2006 765,819 2.4 755,320 3.0 256 2007 780,174 1.9 773,138 2.4 259 2008c 785,536 0.7 776,573 0.4 258 2009c 767,434 -2.3 768,135 -1.1 250 2010 748,728 -2.4 748,553 -1.1 242 Average annual change 2000-2009 2.4% 2.4% 2009-2010 -2.4 -2.5 aAverage daily population is the sum of all inmates in jail each day for a year, divided by the number of days in the year. bNumber of inmates confined at midyear per 100,000 U.S. residents. cBased on revised data from selected jail jurisdictions for the number of inmates confined at midyear 2008 and 2009 and for the average daily population in 2009. See Methodology for a description of revised data. Table 2 Rated capacity of local jails and percent of capacity occupied, 2000-2010 Year 2000 2001 2002 2003 2004 2005 2006 2007 2008d 2009d 2010 Average annual change 2000-2009 2009-2010 Rated capacityb 677,787 699,309 713,899 736,471 755,603 786,954 794,984 810,543 828,714 849,895 866,974 2.5% 2.0 Year-to-year change in rated capacitya Number Percentage 25,466 3.9% 21,522 3.2 14,590 2.1 22,572 3.2 19,132 2.6 33,398 4.1 8,638 1.0 15,863 2.0 18,171 2.2 21,181 2.6 17,079 2.0 Percentage of capacity occupiedc 92.0% 90.0 93.0 94.0 94.0 95.0 96.3 96.3 94.8 90.3 86.4 22,281 17,079 Note: Rated capacity data for 2000-2004 and 2006-2010 were survey estimates subject to sampling error. aIncrease or reduction in the number of beds during the 12 months ending midyear of each year. Number and percentage change for 2000 are calculated using the rated capacity of 652,321 for 1999. bRated capacity is the number of beds or inmates assigned by a rating official to facilities within each jurisdiction. cNumber of confined inmates on the last weekday in June divided by the rated capacity and multiplied by 100. dBased on revised data from selected jail jurisdictions for 2008 and 2009. See Methodology for a description of revised data. April 2011 5 Table 3 Inmates confined in local jails at midyear, by size of jurisdiction, 2009 and 2010 Jurisdiction sizea Totalb Fewer than 50 inmates 50 to 99 100 to 249 250 to 499 500 to 999 1,000 or moreb Number of inmates 2009 2010 767,434 748,728 22,046 22,806 37,838 37,460 86,279 88,750 108,462 106,826 123,442 121,704 389,368 371,181 Difference -18,706 760 -378 2,471 -1,636 -1,738 -18,187 Percentage change -2.4% 3.4% -1.0 2.9 -1.5 -1.4 -4.7 Percentage of all inmates 2009 2010 100.0% 100.0% 2.9% 3.0% 4.9 5.0 11.2 11.9 14.1 14.3 16.1 16.3 50.7 49.6 Note: Detail may not add to total due to rounding. aBased on the average daily population during the 12-month period ending June 30, 2009. Average daily population is the sum of all inmates in jail each day for a year, divided by the number of days in the year. bBased on revised data from selected jail jurisdictions for the number of inmates confined at midyear 2009. See Methodology for a description of revised data. Table 4 Average daily jail population, admissions, and turnover rate, by size of jurisdiction, week ending June 30, 2009 and 2010 Jurisdiction sizec Total Fewer than 50 inmates 50 to 99 100 to 249 250 to 499 500 to 999 1,000 or more Average daily populationa 2009 2010 768,135 748,553 22,012 21,875 37,992 38,041 85,650 87,508 108,025 104,076 123,243 121,611 391,213 375,442 Estimated number of admissions during the last week in June 2009 2010 245,385 246,919 14,627 15,644 17,889 18,955 36,860 36,932 37,314 41,468 36,977 37,882 101,718 96,037 Weekly turnover rateb 2009 2010 63.7% 64.9% 137.8% 136.7% 90.8 96.1 84.2 80.6 68.5 78.0 59.2 61.1 52.5 51.5 Note: See Methodology for greater detail on estimation procedures. aAverage daily population is the sum of all inmates in jail each day for a year, divided by the number of days in the year. Based on revised data for selected jail jurisdictions in 2009. bTurnover rate was calculated by adding weekly admissions and releases, dividing by the average daily population and multiplying by 100. cBased on the average daily population during the 12-month period ending June 30, 2009. 6 Jail Inmates at Midyear 2010 – Statistical Tables Table 5 Percent of jail capacity occupied at midyear, by size of jurisdiction, 2009 and 2010 Jurisdiction sizeb Total Fewer than 50 inmates 50 to 99 100 to 249 250 to 499 500 to 999 1,000 or more Percent of capacity occupieda 2009c 2010 90.3% 86.4% 62.2% 63.3% 78.6 73.1 84.3 83.3 93.5 83.9 91.3 88.5 94.3 90.9 aNumber of inmates at midyear divided by the rated capacity multiplied by 100. bBased on the average daily population during the 12-month period ending June 30, 2009. cBased on revised data from selected jail jurisdictions for 2009. See Methodology for a description of revised data. Table 6 Number of inmates in local jails, by characteristic, midyear 2000 and 2005–2010 Characteristic Total Sex Male Female Adults Male Female Juvenilesb Held as adultsc Held as juveniles Race/Hispanic origind Whitee Black/African Americane Hispanic/Latino Othere,f Two or more racese 2000 621,149 2005 747,529 2006 765,819 2007 780,174 2008a 785,536 2009a 767,434 2010 748,728 550,162 70,987 613,534 543,120 70,414 7,615 6,126 1,489 652,958 94,571 740,770 646,807 93,963 6,759 5,750 1,009 666,819 99,000 759,717 661,164 98,552 6,102 4,835 1,268 679,654 100,520 773,341 673,346 99,995 6,833 5,649 1,184 685,865 99,670 777,832 678,660 99,172 7,703 6,410 1,294 673,728 93,706 760,216 667,039 93,176 7,218 5,846 1,373 656,360 92,368 741,168 649,284 91,884 7,560 5,647 1,912 260,500 256,300 94,100 10,200 ... 331,000 290,500 111,900 13,000 1,000 336,500 295,900 119,200 13,500 700 338,200 301,700 125,500 13,900 800 333,300 308,000 128,500 14,000 1,300 326,400 300,500 124,000 14,800 1,800 331,600 283,200 118,100 15,000 800 Note: Detail may not sum to total due to rounding. ...Not collected. aBased on revised data from selected jail jurisdictions for the number of inmates confined at midyear 2008 and 2009. See Methodology for a description of revised data. bJuveniles are persons under the age of 18 at midyear. cIncludes juveniles who were tried or awaiting trial as adults. dEstimates are based on reported data adjusted for nonresponse. eExcludes persons of Hispanic or Latino origin. fIncludes American Indians, Alaska Natives, Asians, Native Hawaiians, and other Pacific Islanders. April 2011 7 Table 7 Percent of inmates in local jails, by characteristic, midyear 2000 and 2005–2010 Characteristic Sex Male Female Adults Male Female Juvenilesa Held as adultsb Held as juveniles Race/Hispanic originc Whited Black/African Americand Hispanic/Latino Otherd,e Two or more racesd Conviction statusb Convicted Male Female Unconvicted Male Female 2000 2005 2006 2007 2008 2009 2010 88.6% 11.4 98.8% 87.4 11.3 1.2% 1.0 0.2 87.3% 12.7 99.1% 86.5 12.6 0.9% 0.8 0.1 87.1% 12.9 99.2% 86.3 12.9 0.8% 0.6 0.2 87.1% 12.9 99.1% 86.3 12.8 0.9% 0.7 0.2 87.3% 12.7 99.0% 86.4 12.6 1.0% 0.8 0.2 87.8% 12.2 99.1% 86.9 12.1 0.9% 0.8 0.2 87.7% 12.3 99.0% 86.7 12.3 1.0% 0.8 0.3 41.9% 41.3 15.2 1.6 ... 44.3% 38.9 15.0 1.7 0.1 43.9% 38.6 15.6 1.8 0.1 43.3% 38.7 16.1 1.8 0.1 42.5% 39.2 16.4 1.8 0.2 42.5% 39.2 16.2 1.9 0.2 44.3% 37.8 15.8 1.3 0.6 44.0% 39.0 5.0 56.0% 50.0 6.0 38.0% 33.2 4.9 62.0% 54.2 7.7 37.9% 32.8 5.0 62.1% 54.3 7.8 38.0% 32.9 5.2 62.0% 54.3 7.7 37.1% 32.3 4.8 62.9% 55.2 7.8 37.8% 33.0 4.8 62.2% 54.8 7.4 38.9% … … 61.1% … … Note: Detail may not sum to total due to rounding. ...Not collected. Starting in 2010, the Annual Survey of Jails does not collect data on conviction status by sex. aPersons under age 18 at midyear. bIncludes juveniles who were tried or awaiting trial as adults. cEstimates are based on reported data and adjusted for nonresponse. dExcludes persons of Hispanic or Latino origin. eIncludes American Indians, Alaska Natives, Asians, Native Hawaiians, and other Pacific Islanders. 8 Jail Inmates at Midyear 2010 – Statistical Tables Table 8 Inmate population in jail jurisdictions reporting on confined persons being held for U.S. Immigration and Customs Enforcement, midyear 2002-2010 Year 2002 2003 2004 2005 2006 2007 2008 2009 2010 Jurisdictions reporting on holdings for ICEb 2,961 2,940 2,962 2,824 2,784 2,713 2,699 2,643 2,531 Total number of inmates 626,870 637,631 673,807 703,084 698,108 683,640 704,278 685,500 622,954 Confined persons held for ICEa Number Percent of all inmates 12,501 2.0% 13,337 2.1 14,120 2.1 11,919 1.7 13,598 1.9 15,063 2.2 20,785 3.0 24,278 3.5 21,607 3.5 aICE—Immigration and Customs Enforcement. bNot all jurisdictions reported on this specific characteristic. April 2011 9 Table 9 The 50 largest local jail jurisdictions, by number of inmates held, average daily population, and rated capacity, midyear 2008-2010 Jurisdiction Los Angeles County, CA New York City, NY Harris County, TX Cook County, IL Philadelphia City, PA Maricopa County, AZ Dallas County, TX Miami-Dade County, FL Shelby County, TN San Bernardino County, CA Orange County, CA San Diego County, CAe Broward County, FL Alameda County, CA Sacramento County, CA Bexar County, TX Jacksonville City, FL Baltimore City, MD Orange County, FL Santa Clara County, CA DeKalb County, GA Davidson County, TNe Orleans Parish, LA Riverside County, CA Hillsborough County, FL Tarrant County, TX Allegheny County, PAe Pinellas County, FL Gwinnett County, GA Clark County, NVf District of Columbiag Palm Beach County, FL Milwaukee County, WI Travis County, TX Bernalillo County, NM Kern County, CA Cobb County, GA King County, WA York County, PA Suffolk County, MAh Mecklenburg County, NC Fulton County, GA Polk County, FL Salt Lake County, UT Essex County, NJ 10 Number of inmatesa 2008 2009 2010 19,533 19,869 16,862 13,804 13,130 12,745 10,063 11,360 10,264 9,984 9,737 9,777 8,824 9,436 8,325 9,536 8,745 7,549 6,252 6,222 6,909 7,082 5,992 5,653 5,925 5,961 5,560 5,596 5,923 5,720 6,216 5,990 4,847 5,435 5,215 4,863 5,509 4,915 4,631 4,345 4,405 4,132 4,592 4,796 3,972 4,256 4,191 4,242 3,799 3,950 3,837 4,265 3,957 3,595 4,665 3,721 3,591 4,664 4,244 3,776 3,365 3,304 3,516 3,934 3,748 3,636 2,370 3,473 3,505 3,597 3,675 3,342 3,857 3,503 3,296 3,574 3,151 3,135 3,219 3,196 3,342 3,463 3,233 3,220 3,415 3,289 3,233 3,121 3,109 3,311 3,046 3,364 3,071 2,987 2,973 3,059 3,025 2,884 2,525 2,533 2,459 2,722 2,589 2,724 2,688 2,368 2,291 2,364 2,467 2,369 2,373 2,517 2,437 2,328 2,235 2,238 2,264 2,494 2,399 2,934 2,647 2,285 2,258 2,821 3,026 2,271 2,369 2,293 2,214 2,021 2,022 2,238 2,389 2,365 2,136 Average daily populationb 2008 2009 2010 19,836 19,437 18,036 13,849 13,365 13,049 10,000 11,361 10,242 9,900 9,383 9,586 8,811 9,359 8,804 9,265 9,215 8,055 6,385 6,039 6,865 7,050 6,051 5,770 5,765 5,943 5,766 5,593 5,591 5,755 6,000 6,255 5,134 5,363 5,263 4,848 5,500 4,981 4,583 4,371 4,444 4,305 4,563 4,700 4,199 4,062 4,236 4,169 3,606 3,728 3,835 4,010 3,997 3,701 4,294 4,206 3,604 4,660 4,498 3,587 2,906 3,404 3,560 3,528 3,567 3,551 2,613 2,750 3,522 3,530 3,472 3,410 3,985 3,658 3,340 3,500 3,432 3,248 3,246 3,103 3,233 3,559 3,145 3,225 3,311 3,361 3,198 3,115 3,101 3,158 3,012 3,030 3,102 2,900 2,825 2,901 3,037 2,963 2,710 2,662 2,434 2,691 2,607 2,636 2,689 2,372 2,405 2,483 2,579 2,440 2,369 2,657 2,426 2,343 2,211 2,262 2,284 2,445 2,463 2,280 2,610 2,496 2,274 2,789 2,970 2,269 2,456 2,315 2,268 1,995 2,100 2,196 2,260 2,300 2,151 Rated capacityc 2008 2009 2010 22,349 22,477 18,112 19,554 19,636 19,404 9,391 9,391 9,391 10,158 10,607 10,607 8,685 8,685 8,685 9,395 9,395 9,395 7,665 8,097 7,805 5,845 5,845 6,035 6,675 6,669 6,912 5,970 5,914 5,984 5,078 5,063 5,063 4,972 4,664 4,692 5,722 5,504 5,144 4,243 4,673 4,673 5,075 5,075 4,318 4,596 4,596 4,596 3,137 3,137 3,137 3,683 3,683 3,683 4,721 4,721 4,721 3,825 3,825 3,825 3,636 3,636 3,636 3,679 4,010 4,010 2,633 3,514 3,514 3,132 3,132 3,132 4,190 4,190 4,190 3,386 3,386 3,386 3,371 3,713 3,727 4,155 4,151 / 3,419 3,492 4,196 2,957 2,984 2,984 3,825 3,522 3,250 3,359 3,366 3,165 3,000 2,974 2,835 3,137 3,008 3,659 2,236 2,236 2,236 2,698 2,698 2,698 2,559 2,559 3,451 3,154 3,154 3,154 2,446 2,446 2,497 2,990 2,644 2,644 2,668 2,668 2,988 3,115 2,949 2,652 1,808 1,808 1,808 2,000 2,088 2,098 2,434 2,434 2,434 Percent of capacity occupiedd 2008 2009 2010 % % 87.4 88.4 93.1% 70.6 66.9 65.7 107.2 121.0 109.3 98.3 91.8 92.2 101.6 108.6 95.9 101.5 93.1 80.4 81.6 76.8 88.5 121.2 102.5 93.7 88.8 89.4 80.4 93.7 100.2 95.6 122.4 118.3 95.7 109.3 111.8 103.6 96.3 89.3 90.0 102.4 94.3 88.4 90.5 94.5 92.0 92.6 91.2 92.3 121.1 125.9 122.3 115.8 107.4 97.6 98.8 78.8 76.1 121.9 111.0 98.7 92.5 90.9 96.7 106.9 93.5 90.7 90.0 98.8 99.7 114.8 117.3 106.7 92.1 83.6 78.7 105.6 93.1 92.6 95.5 86.1 89.7 83.3 77.9 / 99.9 94.2 77.0 105.5 104.2 111.0 79.6 95.5 94.5 88.9 88.3 96.7 100.8 97.0 89.1 80.7 81.7 74.4 115.8 121.8 120.2 87.8 84.9 87.6 96.4 92.6 68.8 79.8 77.3 73.8 91.4 91.5 90.7 83.4 90.7 111.0 99.2 85.6 75.6 90.6 102.6 85.6 131.0 126.8 122.5 101.1 96.8 106.7 98.2 97.2 87.8 Jail Inmates at Midyear 2010 – Statistical Tables Table 9 (continued) The 50 largest local jail jurisdictions, by number of inmates held, average daily population, and rated capacity, midyear 2008-2010 Jurisdiction Number of inmatesa 2008 2009 2010 Denver County, CO Oklahoma County, OK Marion County, INe Clayton County, GA Franklin County, OH 2,299 2,263 2,336 1,997 2,544 2,217 2,133 2,541 1,991 2,313 2,085 2,100 2,303 1,966 2,194 Average daily populationb 2008 2009 2010 2,380 2,150 2,344 1,958 2,457 2,248 2,145 2,485 1,900 2,251 2,101 2,100 2,096 2,080 2,041 Rated capacityc 2008 2009 2010 Percent of capacity occupiedd 2008 2009 2010 1,792 2,635 2,656 2,146 2,541 128.3% 85.9 88.0 93.1 100.1 1,792 2,635 2,656 2,162 2,541 2,377 2,635 2,599 2,162 2,541 123.7% 80.9 95.7 92.1 91.0 87.7% 79.7 88.6 90.9 86.3 Note: Jurisdictions are ordered by their average daily population in 2010. /Not reported. aNumber of inmates held in jail facilities on the last weekday in June. Based on revised data from selected jail jurisdictions for the number of inmates confined at midyear 2008 and 2009. See Methodology for a description of revised data. bBased on the average daily population for the year ending June 30. Average daily population is the sum of all inmates in jail each day for a year, divided by the number of days in the year. Based on revised data for selected jail jurisdictions in 2009. cNumber of beds or inmates assigned by a rating official to facilities within each jurisdiction. dNumber of inmates at midyear divided by the rated capacity and multiplied by 100. eIncludes privately operated facilities. fConfined population total for Clark County, NV, excludes inmates held in contract facilities. gIncludes the Central Detention Facility (D.C. Jail), Correctional Treatment Facility (Contract Adult Detention Center), and contractual bed space at four halfway houses. The maximum physical capacity is fixed at the Central Detention Facility and Correctional Treatment Facility, and new capacity has not been constructed since 2003. The Central Detention Facility capacity is capped by D.C. Statute at 2,164, and the contracted bed space varies annually per budget and operational requirements. hData for 2008 and 2009 exclude inmates held in the pre-trial facility. In 2010, inmates held in the pre-trial facility are included. April 2011 11 Table 10 Persons under jail supervision, by confinement status and type of program, midyear 2000 and 2006–2010 Confinement status and type of program Totala Held in jaila Supervised outside of a jail facilityb Weekend programsc Electronic monitoring Home detentiond Day reporting Community service Other pretrial supervision Other work programse Treatment programsf Other 2000 687,033 621,149 65,884 14,523 10,782 332 3,969 13,592 6,279 8,011 5,714 2,682 Number of persons under jail supervision 2006 2007 2008 2009 826,041 848,419 858,388 837,647 765,819 780,174 785,536 767,434 60,222 68,245 72,852 70,213 11,421 10,473 12,325 11,212 10,999 13,121 13,539 11,834 807 512 498 738 4,841 6,163 5,758 6,492 14,667 15,327 18,475 17,738 6,409 11,148 12,452 12,439 8,319 7,369 5,808 5,912 1,486 2,276 2,259 2,082 1,273 1,857 1,739 1,766 2010 809,360 748,728 60,632 9,871 12,319 736 5,552 14,646 9,375 4,351 1,799 1,983 aBased on revised data from selected jail jurisdictions for the number of inmates confined at midyear 2008 and 2009. See Methodology for a description of revised data. bExcludes persons supervised by a probation or parole agency. cPrograms that allow offenders to serve their sentences of confinement on weekends only (i.e., Friday to Sunday). dIncludes only persons without electronic monitoring. eIncludes persons in work release programs, work gangs, and other alternative work programs. fIncludes persons under drug, alcohol, mental health, and other medical treatment. Table 11 Estimated standard errors, by confinement status, Annual Survey of Jails, 2010 Characteristic Total Held in jail Supervised outside a jail facilityb Excluding weekenders Weekend programs Average daily population Rated capacity Admissions during the last week in June Survey estimates Standard error 809,360 6,128 748,728 5,638 60,632 1,965 50,761 1,941 9,871 297 748,553 5,566 866,974 11,129 246,919 4,482 Relative standard errora 0.76% 0.75% 3.24 3.82 3.01 0.74% 1.28% 1.82% aCalculated by dividing the standard error by the survey estimates and multiplying by 100. bIncludes persons under jail supervision but confined. Excludes persons supervised by a probation or parole agency. Weekend programs allow offenders to serve their sentences of confinement on weekends only (i.e., Friday to Sunday). 12 Jail Inmates at Midyear 2010 – Statistical Tables Table 12 Estimated standard errors, by selected characteristic, Annual Survey of Jails, 2010 Characteristic Sex Male Female Adults Juvenilesc Held as adultsd Held as juveniles Race/Hispanic origin Whitee Black/African Americane Hispanic/Latino Othere,f Two or more racese Conviction statusd Convicted Unconvicted Totala Relative standard Survey estimate Standard error error (percentage)b 656,360 92,368 741,168 7,560 5,647 1,912 650,342 91,521 734,852 7,490 5,596 1,895 4,999 1,026 5,600 263 246 255 0.77% 1.12 0.76% 3.51% 4.40 13.47 331,600 283,200 118,100 15,000 800 274,907 234,738 97,869 12,448 689 3,672 3,182 2,143 1,063 153 1.34% 1.36 2.19 8.54 22.25 291,300 457,500 234,566 368,412 3,328 4,604 1.42% 1.25 Note: Detail may not sum to total due to rounding. aTotal estimates were based on reported data, adjusted for nonresponse. bCalculated by dividing the standard error by the survey estimates and multiplying by 100. cJuveniles are persons under the age of 18 at midyear. dIncludes juveniles who were tried or awaiting trial as adults. eExcludes persons of Hispanic or Latino origin. fIncludes American Indians, Alaska Natives, Asians, Native Hawaiians, and other Pacific Islanders. Table 13 Estimated percentages of local jail inmates, by selected characteristic and ratio estimates, 2010 Characteristic Sex Male Female Race/Hispanic origin Whitea Black/African Americana Hispanic/Latino Othera,b Two or more racesa Conviction statusc Convicted Unconvicted Estimate Standard error 87.7% 12.3 0.10% 0.10 44.3% 37.8 15.8 1.3 0.6 0.41% 0.39 0.30 0.17 0.03 38.9% 61.1% 0.42% 0.42% Note: Detail may not sum to total due to rounding. aExcludes persons of Hispanic or Latino origin. bIncludes American Indians, Alaska Natives, Asians, Native Hawaiians, and other Pacific Islanders. cIncludes juveniles who were tried or awaiting trial as adults. April 2011 13 Methodology Annual Survey of Jails In years between the complete census of local jails, BJS conducts the Annual Survey of Jails (ASJ). ASJ is a sample survey of local jails used to estimate the number and characteristics of local inmates nationwide. For the 2010 ASJ, the U.S. Census Bureau, as the collection agent, drew a sample of 873 jail jurisdictions represented by 936 jail facilities (also referred to as reporting units). This sample represents approximately 2,830 jail jurisdictions nationwide. Local jail jurisdictions include counties (parishes in Louisiana) or municipal governments that administer one or more local jails. The 2010 ASJ sample included all jails with certainty (67) that were operated jointly by two or more jurisdictions, or multi-jurisdictional jails. Other jail jurisdictions included with certainty (268) were those that— held juvenile inmates at the time of the 2005 Census of Jail Inmates and had an average daily population of 500 or more inmates during the 12 months ending June 30, 2005. held only adult inmates and had an average daily population of 750 or more. adjustment procedures to account for missing data. However, prior to implementing the plan, data were estimated for 3 of the 8 survey nonrespondents. For the confined population and average daily population (ADP), the estimation method included applying the average annual change from 2007-2009 to estimate the 2010 data. The rated capacity for 2010 is the same as in 2009 because of the stability of these numbers. After October, 21, 2010, BJS implemented the nonresponse weight adjustment procedure to account for five respondents that did not participate. Nonresponse weight adjustment The nonresponse weighting adjustment for the ASJ is handled in two steps. The first step is to calculate a multijail factor for the jail jurisdictions with more than one nonregional jail reporting unit. The second step is to calculate the nonresponse weighting adjustment factor within sample stratum. Step 1: Multi-jail factor When all the nonregional jail reporting units within the jail jurisdiction respond, the multi-jail factor is 1. When none of the nonregional jail reporting units within the jurisdiction respond, the multi-jail factor is 0. When at least one nonregional jail reporting unit within the jail jurisdiction has responded and at least one nonregional jail reporting unit has not responded, the multi-jail factor weights up the data for the responding nonregional jail reporting unit to account for the nonresponding nonregional jail reporting units within the jail jurisdiction. The remaining jurisdictions were stratified into two groups: jurisdictions with jails holding at least one juvenile on June 30, 2005, and jails holding only adults on that date. Using stratified random sampling, 538 jurisdictions were selected from eight strata based on the two conditions The nonregional jail reporting units were match back to the enumerated above and four strata based onfactor the average daily Multi-jail 2005 Census of Jail Inmates, and the 2005 ADP was used in jail inmate population during 2005. The average daily jail the multi-jail factor. For 2010, the 5 nonrespondents were inmate population was derived from the 2005 Census of Jail The 54 jail jurisdictions with nonregional jailand reporting units have a total offactor. 111 individual j self representative not considered for a multi-jail Inmates. reporting units. We match theThe nonregional jail reporting units back to the 2005 Census of Ja multi-jail factor F1hi is calculated as— Data were obtained from sampled jurisdictions by the mail-2005 ADP in the multi-jail factor. The multi-jail factor F1hi is calculate Inmates, and use out and web-based survey questionnaires. After follow-up ��� phone calls and facsimiles to respondents, the response �� �∑��� ���� rate for the survey was 100% for critical items, such as the number of inmates confined, average daily population, and �∑��� � ���� � ���� � �� � ��� ��� ��� rated capacity. (See tables 12, 13 and 14 for standard errors ���� � � �� associated with reported estimates from the ASJ 2010 at � http://www.bjs.gov/index.cfm?ty=pbdetail&iid=2195.) � Response rate, nonresponse adjustment, and out-ofscope jail facilities where � ����� � ���� � ����������������� � ��� where There were 930 active respondents in the 2010 ASJ universe J = Number of jail reporting units in jurisdiction i, i file.* Eight jail facilities were nonrespondents. For this J = Number of jail reporting in jurisdiction = Number of responding jail reporting units units in jurisdiction i, i, J i Ri collection year, BJS implemented nonresponse weight J = Number of responding jail reporting units Ri Xhij = Value of 2005 ADP for jail reporting unit j in jurisdiction i in stratum h. *Of the 936 respondents in the 2010 ASJ universe file, two jail facilities were in jurisdiction i, determined to be out-of-scope for the 2009 ASJ and remained out-of-scope Xhij = Value of 2005 ADP for jail reporting unit for 2010. Four were out-of-scope for the 2010 data because they jail reporting When all collection the nonregional units within the jurisdiction respond, the multi-jail fa j in jurisdiction i in stratum h. closed permanently, leaving 930 active respondents. 14 is 1. When none of the nonregional jail reporting units within the jurisdiction respond, the m jail factor is 0. When at least one nonregional jail reporting unit within the jurisdiction has responded and at least one nonregional jail reporting unit has not responded, the multi-jail fa Jail Inmates at Midyear 2010 – Statistical Tables for the weights up the data for the responding nonregional jail reporting unit to account nonresponding nonregional jail reporting units within the jail jurisdiction. east nonregional jail reporting within the jurisdiction has factor one one nonregional jail reporting unit unit has not responded, the multi-jail e the nonregional jailnonregional reporting unit not responded, the multi-jail responding jailhas reporting unit to account for the factor eonal responding nonregional jail reporting unit to account for the jail reporting units within the jail jurisdiction. al jail reporting units within the jail jurisdiction. ng adjustment Stepfactor 2: Nonresponse weighting adjustment factor Calculating annual admissions adjustmentThe factor nonresponse weighting adjustment factor is calculated BJS determined that the June admission data on the 2004 hting adjustment is calculated within each stratum. We use Survey the of Large Jails (SLJ) were a reliable source to calculate withinfactor each stratum. The sample weights in the nonresponse adjustment are used. The nonresponse weighting ng adjustment factor isfactor calculated within each stratum. We use thea nationwide annual admission estimate. Although the nonresponse adjustment factor. The nonresponse weighting adjustment adjustment factor. factor F2hThe is calculated as— weighting adjustment number of admissions to jails fluctuated throughout the response adjustment nonresponse as year, the SLJ tracked monthly movements from January �� �� ∑��� ∑��� ���� 2003 to January 2004 and showed that the June 2003 count � � � � �∑� � �� ��� ∑ ����� (339,500) closely matched the annual average number of ��� ��� ��� � ��∑������∑��� ���� admissions (342,956). The number of annual admissions was ∑��� ∑��� ���� calculated by multiplying the weekly admissions by 365 days jurisdictions in stratum h, and dividing by 7 days. isdictions inwhere stratum h, eight for jail j in jurisidiction i in stratum h. Calculating weekly turnover rates ght for jail j in jurisidiction i in stratum h. nh = number of jurisdictions in stratum h, whij = sample weight for jail j in jurisidiction i in stratum h. Weekly jail turnover rates were modeled after the Bureau of Labor Statistics’ Job Openings and Labor Turnover Survey. Additional information on turnover rates is available at Final weight for each individual jail reporting unitindividual on the 2010 ASJ data file is http://www.bls.gov/jlt/. Jail turnover rates were calculated The final weight FWhij for each jail reporting unit by adding admissions and releases and dividing by the each individual unit on the 2010 on thejail 2010reporting ASJ data file is calculated as— ASJ data file is average daily population. The turnover rate takes into account admissions into and releases from jails and gives an ����� � ���� � ���� � ��� . indication of the fluctuation of the jail population. Higher turnover rates mean larger numbers of admissions and ����� � ���� � ���� � ��� . Weekly admission and release estimation procedures releases relative to the size of the average daily population. Based on the 2010 ASJ, 821 of the 925 jail facilities (89%) Revised 2008 and 2009 data provided valid data on weekly admissions or releases (including estimates for five nonrespondents). To calculate The number of inmates held at midyear 2008 and 2009 and an overall weekly estimate, data on offender flows through the average daily population in 2009 for Bexar County, TX, local jails were estimated for the 104 jail facilities that did are based on revised data. not report data on admissions and releases. The rated capacity data for Bexar County, TX, and the Estimates were calculated based on the following criteria: District of Columbia have been revised for 2008 and 2009. Revised rated capacity data for Kern County, CA, have been Data for 64 jail facilities included admission and release revised for 2009. data based on estimates from the 2009 Annual Survey of Jails. Data for 13 jail facilities included admission and release data based on estimates from the 2008 Annual Survey of Jails. Release data for 13 jail facilities was based on admission data reported in 2009. Data for 11 jail facilities included admission and release data based on estimates from the 2007 Annual Survey of Jails. Admission data for 2 jail facilities was based on release data reported in 2009. Admission data for 1 jail facility was based on admission data reported in 2009. April 2011 15 U.S. Department of Justice Office of Justice Programs Bureau of Justice Statistics Washington, DC 20531 ncj233431 PRESORTED STANDARD POSTAGE & FEES PAID DOJ/BJS Permit No. G-91 Official Business Penalty for Private Use $300 Office of Justice Programs • Innovation • Partnerships • Safer Neighborhoods • http://www.ojp.gov The Bureau of Justice Statistics is the statistical agency of the U.S. Department of Justice. James P. Lynch is director. These Statistical Tables were prepared and data were analyzed by Todd D. Minton. Margaret Noonan verified the report. Lisa A. McNelis and Jennifer Deppe carried out the data collection and processing with assistance provided by Joshua Giunta, Alonzo Johnson, and Andrea Arroyo, under the supervision of Stephen Simoncini and Heather C. West, Ph.D., Governments Division, Census Bureau, U.S. Department of Commerce. Suzanne Dorinski and Andrew Post provided statistical and technical assistance, respectively. Catherine Bird and Jill Thomas edited the report, Tina Dorsey produced the report, and Jayne Robinson prepared the report for final printing under the supervision of Doris J. James. April 2011, NCJ 233431 This report in portable document format and in ASCII and its related statistical data and tables are available at the BJS website: http://www.bjs.gov/index.cfm?ty=pbdetail&iid=2375.


