

Felony Defendants in Large Urban Counties 2004 Usdoj Bureau of Justice Statistics 2008.pdf
Download original document:
Document text
Document text
This text is machine-read, and may contain errors. Check the original document to verify accuracy.
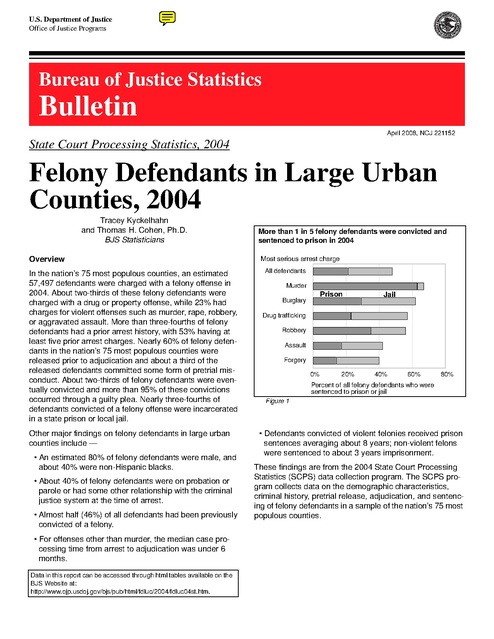
U.S. Department of Justice
Office of Justice Programs

Bureau of Justice Statistics

Bulletin
April 2008, NCJ 221152

State Court Processing Statistics, 2004

Felony Defendants in Large Urban
Counties, 2004
Tracey Kyckelhahn
and Thomas H. Cohen, Ph.D.
BJS Statisticians
Overview
In the nation’s 75 most populous counties, an estimated
57,497 defendants were charged with a felony offense in
2004. About two-thirds of these felony defendants were
charged with a drug or property offense, while 23% had
charges for violent offenses such as murder, rape, robbery,
or aggravated assault. More than three-fourths of felony
defendants had a prior arrest history, with 53% having at
least five prior arrest charges. Nearly 60% of felony defendants in the nation’s 75 most populous counties were
released prior to adjudication and about a third of the
released defendants committed some form of pretrial misconduct. About two-thirds of felony defendants were eventually convicted and more than 95% of these convictions
occurred through a guilty plea. Nearly three-fourths of
defendants convicted of a felony offense were incarcerated
in a state prison or local jail.
Other major findings on felony defendants in large urban
counties include —
• An estimated 80% of felony defendants were male, and
about 40% were non-Hispanic blacks.
• About 40% of felony defendants were on probation or
parole or had some other relationship with the criminal
justice system at the time of arrest.
• Almost half (46%) of all defendants had been previously
convicted of a felony.
• For offenses other than murder, the median case processing time from arrest to adjudication was under 6
months.
Data in this report can be accessed through html tables available on the
BJS Website at:
http://www.ojp.usdoj.gov/bjs/pub/html/fdluc/2004/fdluc04st.htm.

More than 1 in 5 felony defendants were convicted and
sentenced to prison in 2004
Most serious arrest charge
All defendants
Murder

Prison

Burglary

Jail

Drug trafficking
Robbery
Assault
Forgery
0%

20%

40%

60%

80%

Percent of all felony defendants who were
sentenced to prison or jail
Figure 1

• Defendants convicted of violent felonies received prison
sentences averaging about 8 years; non-violent felons
were sentenced to about 3 years imprisonment.
These findings are from the 2004 State Court Processing
Statistics (SCPS) data collection program. The SCPS program collects data on the demographic characteristics,
criminal history, pretrial release, adjudication, and sentencing of felony defendants in a sample of the nation’s 75 most
populous counties.

Two-thirds of felony defendants were charged with a
drug or property offense
An estimated 57,497 felony cases were filed in the state
courts of the nation’s 75 largest counties during May 2004.
About a quarter of defendants were charged with a violent
offense, usually robbery or assault (figure 2). Less than 1%
of defendants were charged with murder (0.6%) or rape
(0.9%).
About two-thirds of defendants were charged with a drug
(37%) or property offense (31%). About 40% of drug defendants, 15% of defendants overall, were charged with drug
trafficking. A majority of property defendants were charged
with burglary (8% of all defendants) or larceny (8%). About
10% of defendants were charged with a public-order
offense. A majority of these charges were driving-related
(3%) or weapons-related (3%) offenses.
Eight out of 10 felony defendants were males
Eighty-two percent of felony defendants were male, including 90% or more of those charged with rape (99%), a
weapons offense (96%), murder (92%), robbery (91%), or a
driving-related offense (90%). Women accounted for 41%
of fraud defendants and about a third of forgery (34%) and
larceny/theft (29%) defendants.
Blacks accounted for two-fifths of felony defendants
Non-Hispanic blacks comprised more than half of the
defendants charged with robbery (56%), a weapons
offense (54%), or drug trafficking (51%) (table 1). Non-Hispanic whites were nearly half of those charged with a driving-related felony (44%). Hispanics comprised almost half
of those charged with motor vehicle theft (44%). Half of the
defendants were under age 30. Seventeen percent were
under age 21, including 40% of those charged with robbery
and 30% of those charged with motor vehicle theft. Three
percent of defendants were under age 18, including 13% of
robbery defendants and 6% of murder defendants.
Nearly 40% of felony defendants had an active criminal
justice status at time of arrest
At the time of arrest, 39% of defendants had an active criminal justice status, such as probation (16%), release pending disposition of a prior case (11%), or parole (5%). Fortyfive percent of burglary defendants and 51% of motor vehicle theft defendants had an active criminal justice status
when arrested.
Table 1. Race and Hispanic origin of felony defendants,
by most serious arrest charge, 2004
Most serious
arrest charge
All offenses
Violent
Property
Drug
Public-order

Black non- White non- Hispanic, Other nonHispanic Hispanic
any race Hispanic
42%
44
38
44
38

29%
24
33
27
32

28%
30
26
27
27

2 Felony Defendants in Large Urban Counties, 2004

2%
2
3
2
3

More than a third of felony defendants in the nation's 75
most populous counties charged with drug offenses
Most frequent felony arrest charges
Non-trafficking drug offenses
Drug trafficking
Assault
Burglary
Larceny/theft
Robbery

0%

5%

10% 15% 20% 25% 30%
Percent of defendants

Figure 2

Seventy-eight percent of all defendants had been arrested
previously, with 53% having at least five prior arrest
charges. Sixty-two percent of defendants had at least one
prior conviction, including 46% with one or more felony
convictions.
Fifty-seven percent of felony defendants received a
pretrial release prior to adjudication
Forty-three percent of all defendants were detained until
the court disposed of their case, including 6% who were
denied bail. Murder defendants (88%) were the most likely
to be detained. A majority of defendants charged with
motor vehicle theft (61%), robbery (58%), or burglary (54%)
were also detained until case disposition.
Defendants with an active criminal justice status (58%)
were considerably more likely to be detained until case disposition than those without such a status (33%). Defendants on parole (83%) were the most likely to be detained.
Defendants were most likely to be released on commercial
surety bond (43% of all releases), followed by personal
recognizance (25%), conditional release (16%), and
deposit bond (9%) (figure 3).
More than a third of released felony defendants
committed pretrial misconduct
An estimated 35% of released defendants committed one
or more types of pretrial misconduct while in a release status. Among those released, 21% failed to appear in court
as scheduled and 21% were arrested for a new offense.
In 2004 half of the cases were adjudicated in 85 days
or less
About a quarter of defendants had their case adjudicated
within one month of arrest, and over half within three
months. At the end of the 1-year study period, 88% of all
cases had been adjudicated.

About 60% of defendants were convicted of a felony
Sixty-eight percent of cases adjudicated within one year
resulted in a conviction. Fifty-nine percent of defendants
were convicted of a felony, and 9% of a misdemeanor. The
felony conviction rate was highest for those originally
charged with motor vehicle theft (74%), followed by drivingrelated offenses (73%), murder (70%), burglary (69%), and
drug trafficking (67%). Defendants charged with assault
(45%) had the lowest felony conviction rate.
Nearly all (97%) convictions obtained during the 1-year
study period were the result of a guilty plea. Eighty-seven
percent of guilty pleas were to a felony.
Seventy-nine percent of trials resulted in a guilty verdict or
judgment, including 82% of bench trials and 76% of jury
trials.
Type of trial

Two-thirds of felony defendants in the nation's 75 largest
counties were released through surety bond or
recognizance
Type of pretrial release
Surety bond
Recognizance
Conditional
Deposit bond
Unsecured bond
Full cash bond
Property bond
0%

Percent of trials resulting in a conviction
Total
Felony
Misdemeanor

10%
20%
30%
40%
Percent of released defendants

50%

Figure 3
Total
Bench
Jury

79%
82
76

69%
68
70

9%
14
6

Median prison sentence for violent felony convictions
was 4 years
About two-thirds of convicted defendants were sentenced
within one day of adjudication. Three-fourths of all sentences for felony convictions were to prison (36%) or jail
(40%). Ninety-six percent of those convicted of murder
were sentenced to prison. A majority of rape (65%) and
robbery (63%) convictions also resulted in prison sentences. Nearly all convicted defendants who did not receive
an incarceration sentence were placed on probation.
Fifty-three percent of those with multiple prior felony convictions were sentenced to prison following a felony conviction in the current case, compared to 22% of those with no
prior felony or misdemeanor convictions (figure 4).

Over half of felony defendants with more than 1 prior
felony conviction sentenced to prison
Criminal history
More than 1 prior
felony conviction
1 prior felony
conviction

Prison
Jail
Probation

Prior misdemeanor
convictions only

No prior convictions
0%

10% 20% 30% 40% 50% 60%
Percent of defendants convicted of a felony

Figure 4

The mean maximum prison sentence for violent felony convictions was about 8 years and the median was 4 years.
For nonviolent felonies the mean was about 3 years and
the median 2 years. Murder (about 19 years) and rape (10
years) convictions carried the longest median prison sentences.

Since 1994 more than a third of felony defendants were
charged with a drug offense
Percent of defendants
40%

Distribution of major felony offense categories was
relatively stable

35%

Since 1990, defendants charged with a drug or property
offense have comprised about two-thirds of felony cases in
the 75 largest counties. From 1990 to 2004 the percentage
of felony defendants charged with a violent offense has
ranged from 23% to 27% (figure 5). Since 1994, drug
defendants have comprised the largest group, ranging from
35% to 37%. Property defendants have accounted for 29%
to 31% of defendants during this time.

25%

Drug
Property

30%

Violent

20%
15%

Public-order

10%
5%
0%
1990

1992

1994

1996

1998

2000

2002

2004

Figure 5

Felony Defendants in Large Urban Counties, 2004

3

U.S. Department of Justice
Office of Justice Programs
Bureau of Justice Statistics

*NCJ~221152*

PRESORTED STANDARD
POSTAGE & FEES PAID
DOJ/BJS
Permit No. G-91

Washington, DC 20531

Official Business
Penalty for Private Use $300

Methodology
Since 1988, the Bureau of Justice Statistics (BJS) has
sponsored a biennial data collection on the processing of
felony defendants in the state courts of the nation's 75 most
populous counties. Previously known as the National Pretrial Reporting Program, this data collection series was
renamed the State Court Processing Statistics (SCPS) program in 1994 to better reflect the wide range of data elements collected.
The 2004 SCPS collected data for 15,761 felony cases filed
during May 2004 in 40 large counties. These cases were
part of a 2-stage sample that was representative of the estimated 57,497 felony cases filed in the nation’s 75 most populous counties during that month. Murder cases were
tracked for up to two years and all other cases for up to one
year. In 2004 the 75 largest counties accounted for 38% of
the U.S. population. According to the Federal Bureau of
Investigation’s (FBI) 2004 Uniform Crime Reports program,
these jurisdictions accounted for 45% of all reported serious violent crimes in the United States, including 43% of
murders and non-negligent manslaughters, 34% of rapes,
53% of robberies, and 43% of aggravated assaults.
For additional details about the data collection and analysis,
see the expanded Methodology on the BJS Website at
<http://www.ojp.usdoj.gov/bjs/pub/html/fdluc/2004/
fdluc04st.htm>.
4 Felony Defendants in Large Urban Counties, 2004

The Bureau of Justice Statistics is the statistical
agency of the U.S. Department of Justice. Jeffrey L.
Sedgwick is the director.
BJS Bulletins present the first release of findings
from permanent data collection programs.
Tracey Kyckelhahn and Thomas H. Cohen wrote this
report. Brian Reaves provided statistical review.
Catherine Bird edited the report, Tina Dorsey
produced it, and Jayne Robinson prepared it for final
printing under the supervision of Doris J. James.
April 2008, NCJ 221152

This report in portable document format and in ASCII
and its related statistical data and tables are available
at the BJS World Wide Web Internet site: <http://
www.ojp.usdoj.gov/bjs/abstract/fdluc04.htm>.

Office of Justice Programs
Innovation • Partnerships • Safer Neighborhoods
http://www.ojp.usdoj.gov


