

Homicide in the U.S. Known to Law Enforcement BJS 2011
Download original document:
Document text
Document text
This text is machine-read, and may contain errors. Check the original document to verify accuracy.
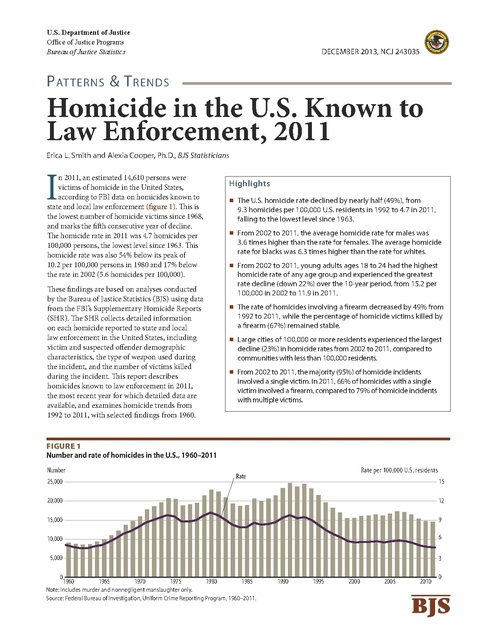
U.S. Department of Justice Office of Justice Programs Bureau of Justice Statistics DECEMBER 2013, NCJ 243035 P at terns & T rends Homicide in the U.S. Known to Law Enforcement, 2011 Erica L. Smith and Alexia Cooper, Ph.D., BJS Statisticians I n 2011, an estimated 14,610 persons were victims of homicide in the United States, according to FBI data on homicides known to state and local law enforcement (figure 1). This is the lowest number of homicide victims since 1968, and marks the fifth consecutive year of decline. The homicide rate in 2011 was 4.7 homicides per 100,000 persons, the lowest level since 1963. This homicide rate was also 54% below its peak of 10.2 per 100,000 persons in 1980 and 17% below the rate in 2002 (5.6 homicides per 100,000). Highlights The U.S. homicide rate declined by nearly half (49%), from 9.3 homicides per 100,000 U.S. residents in 1992 to 4.7 in 2011, falling to the lowest level since 1963. From 2002 to 2011, the average homicide rate for males was 3.6 times higher than the rate for females. The average homicide rate for blacks was 6.3 times higher than the rate for whites. From 2002 to 2011, young adults ages 18 to 24 had the highest homicide rate of any age group and experienced the greatest rate decline (down 22%) over the 10-year period, from 15.2 per 100,000 in 2002 to 11.9 in 2011. These findings are based on analyses conducted by the Bureau of Justice Statistics (BJS) using data from the FBI’s Supplementary Homicide Reports (SHR). The SHR collects detailed information on each homicide reported to state and local law enforcement in the United States, including victim and suspected offender demographic characteristics, the type of weapon used during the incident, and the number of victims killed during the incident. This report describes homicides known to law enforcement in 2011, the most recent year for which detailed data are available, and examines homicide trends from 1992 to 2011, with selected findings from 1960. The rate of homicides involving a firearm decreased by 49% from 1992 to 2011, while the percentage of homicide victims killed by a firearm (67%) remained stable. Large cities of 100,000 or more residents experienced the largest decline (23%) in homicide rates from 2002 to 2011, compared to communities with less than 100,000 residents. From 2002 to 2011, the majority (95%) of homicide incidents involved a single victim. In 2011, 66% of homicides with a single victim involved a firearm, compared to 79% of homicide incidents with multiple victims. Figure 1 Number and rate of homicides in the U.S., 1960–2011 Number Rate per 100,000 U.S. residents Rate 25,000 15 20,000 12 15,000 9 10,000 6 5,000 3 0 1960 1965 1970 1975 1980 1985 Note: Includes murder and nonnegligent manslaughter only. Source: Federal Bureau of Investigation, Uniform Crime Reporting Program, 1960–2011. 1990 1995 2000 2005 2010 0 BJS P at terns & T rends Two national sources of homicide data: the FBI’s Supplementary Homicide Reports (SHR) and the Centers for Disease Control and Prevention’s (CDC) National Vital Statistics System (NVSS) National estimates of the annual number of homicides known to law enforcement in the United States found in this report are derived from data submitted to the FBI’s Uniform Crime Reporting (UCR) Program.1 In 2011, more than 18,000 law enforcement agencies voluntarily submitted annual summary counts of crimes brought to their attention that year. More detailed information specifically on homicides is collected by the FBI through the Supplementary Homicide Reports (SHR), which is part of the UCR. Instead of a summary count of homicides, participating law enforcement agencies provide information on the sex, age, and race of homicide victims and offenders, as well as other incident- and victim-specific characteristics, such as the victim-offender relationship, weapon use, and circumstance of the crime. The SHR captures only information on criminal homicide incidents known and handled by state and local law enforcement that occur in the United States, including homicides involving victims who were not U.S. residents. Homicides of U.S. residents that occur outside of the United States and homicides handled by federal law enforcement are not included in the SHR data. Homicides that are classified as negligent or involuntary are also not included in the SHR. In this analysis of the SHR data, homicide is defined as homicides known to law enforcement that were classified as murder or nonnegligent manslaughter. In the SHR, the determination that a crime was a homicide is made solely based on police investigation, and is not the result of the decision of a court, medical examiner, coroner, jury, or other non-law enforcement entity. A second source of national data on homicide is the National Vital Statistics System (NVSS), a data collection administered by the National Center for Health Statistics (NCHS), a division of the Centers for Disease Control and Prevention (CDC). Data collected through the NVSS provide information on the number of injury-related deaths and the death rate for U.S. residents, as well as demographic information about the victims. These data are based on death certificates filed with state vital-statistics offices in the 50 states and the District of Columbia that include primary cause of death. Cause of death is coded using the International Statistical Classification of Diseases and Related Health Problems, 10th Revision (ICD-10). The definition of homicide used in the ICD-10 is “injuries inflicted by another person with intent to injure or kill, by any means.” In the NVSS, the determination that a death was a homicide is made by the physician, medical examiner, or coroner responsible for certifying the death certificate. In the calculation of the homicide rate, the NVSS does not include homicides resulting from legal intervention and operations of war. However, the NVSS does include deaths resulting from assault that occurred one year or more after the originating event. For more information, see the online version of the ICD-10, available from the World Health Organization at http://www.who.int/classifications/icd/ icdonlineversions/en/. (Continued on next page.) 1For more information on the FBI’s UCR, see www.fbi.gov/about-us/ cjis/ucr/ucr. H O M I C I D E I N T H E U. S . K N O W N TO L AW E N F O R C E M E N T, 2011 | D E C E M B E R 2013 2 P at terns & T rends Two national sources of homicide data: the FBI’s Supplementary Homicide Reports (SHR) and the Centers for Disease Control and Prevention’s (CDC) National Vital Statistics System (NVSS) Of the two sources, NVSS data estimate a higher annual number of homicides. Over the 20-year period from 1992 to 2011, the NVSS count of homicides was consistently higher than the homicide count estimated from SHR data (figure 2). The NVSS average annual estimate was about 1,255 homicides higher than the SHR annual estimate. Similarly, the average homicide rate based on the NVSS was 0.4 homicides per 100,000 persons higher than the homicide rate based on the SHR (figure 3). Despite these differences, the two sources show very similar trends for the number and rate of homicides over the most recent 10-year period. From 2002 to 2011, both the NVSS and the SHR reported a 10% decrease in the number of homicides and a 17% decline in the homicide rate. Figure 2 Number of homicides in the SHR and NVSS, 1992–2011 Number 30,000 NVSS SHR 25,000 Figure 3 Homicide rates in the SHR and NVSS, 1992–2011 Rate per 100,000 population 12 10 8 NVSS 6 SHR 4 2 0 1992 1997 2002 2007 2011 Note: Preliminary CDC homicide estimates for 2011 retrieved from Hoyert, D.L. & Xu, J.Q. (2012), Deaths: Preliminary data for 2011, National Vital Statistics Reports, 61(6). Sources: Supplementary Homicide Reports, 1992–2011; and Centers for Disease Control and Prevention, National Center for Injury Prevention and Control, Web-based Injury Statistics Query and Reporting System (WISQARS), 1993–2010. Retrieved September 2013 from www.cdc.gov/ ncipc/wisqars. 20,000 15,000 10,000 5,000 0 1992 1997 2002 2007 2011 Note: Preliminary CDC homicide estimates for 2011 retrieved from Hoyert, D.L. & Xu, J.Q. (2012), Deaths: Preliminary data for 2011, National Vital Statistics Reports, 61(6). Sources: Supplementary Homicide Reports, 1992–2011; and Centers for Disease Control and Prevention, National Center for Injury Prevention and Control, Web-based Injury Statistics Query and Reporting System (WISQARS), 1993–2010. Retrieved September 2013 from www.cdc.gov/ ncipc/wisqars. H O M I C I D E I N T H E U. S . K N O W N TO L AW E N F O R C E M E N T, 2011 | D E C E M B E R 2013 3 P at terns & T rends The U.S. homicide rate declined by nearly half (49%) from 1992 to 2011 Over the 20-year period from 1992 to 2011, the rate of homicide in the United States declined by 49%, from 9.3 homicides per 100,000 residents in 1992 to 4.7 in 2011 (figure 4). The decline in the homicide rate was higher during the 10-year period from 1992 to 2001 (down 39%) than from 2002 to 2011 (down 17%). Rate per 100,000 U.S. residents Male 14 12 10 Total 8 6 4 Female 2 0 1992 1996 2000 The homicide rate in 2011 was highest among males, blacks, and young adults In 2011, the murder rate for males was 7.4 homicides per 100,000 males, or an estimated 11,370 male homicide victims (table 1). The murder rate for females in 2011 was 2.0 homicides per 100,000 females, or about 3,240 female homicide victims. From 2002 to 2011, the homicide rate among males declined by 16%, while the rate for females decreased by 20%. Figure 4 Homicide rates, by sex, 1992–2011 16 On average, the homicide rate for males was 3.6 times higher than the homicide rate for females, from 1992 to 2011. Both sexes experienced similar declines in their overall rates of homicide during the 20-year period. From 1992 to 2011, the murder rate declined by half for both males (50%) and females (49%). 2004 2008 2011 Source: Bureau of Justice Statistics, based on data the from FBI, Supplementary Homicide Reports, 1992–2011. From 2002 to 2011, the homicide rate for blacks was 6.3 times higher than the rate for whites. Over this 10-year period, the homicide rate among whites decreased by 17%, from 3.3 homicides per 100,000 in 2002 to 2.8 in 2011. Similarly, the homicide rate among blacks declined by 19%, from 21.2 per 100,000 in 2002 to 17.3 in 2011. The homicide rate for persons of other races—persons identified as American Indian, Alaska Native, Asian, Native Hawaiian, or other Pacific Islander—experienced the greatest decline (down 33%), from 2.7 homicides per 100,000 persons in 2002 to 1.8 in 2011. Table 1 Number and rate of homicides in the U.S., by victim demographic characteristics, 2002–2011 Sex Year All victims Number of homicides 2002 16,230 2003 16,530 2004 16,150 2005 16,740 2006 17,310 2007 17,130 2008 16,465 2009 15,400 2010 14,720 2011 14,610 Rate per 100,000 U.S. residents 2002 5.6 2003 5.7 2004 5.5 2005 5.7 2006 5.8 2007 5.7 2008 5.4 2009 5.0 2010 4.8 2011 4.7 Male Female Race Black/African White American Other* 12,475 12,835 12,600 13,180 13,655 13,460 12,900 11,880 11,410 11,370 3,755 3,690 3,550 3,560 3,655 3,665 3,565 3,520 3,315 3,240 7,805 7,985 7,980 8,050 8,135 8,110 8,020 7,485 6,885 6,830 7,990 8,080 7,755 8,255 8,710 8,610 8,070 7,495 7,450 7,380 435 465 415 435 460 405 375 425 385 400 8.8 9.0 8.7 9.1 9.3 9.1 8.6 7.8 7.5 7.4 2.6 2.5 2.4 2.4 2.4 2.4 2.3 2.3 2.1 2.0 3.3 3.4 3.4 3.4 3.4 3.3 3.3 3.0 2.8 2.8 21.2 21.2 20.1 21.2 22.1 21.5 19.9 18.3 17.7 17.3 2.7 2.9 2.5 2.5 2.6 2.2 2.0 2.2 1.8 1.8 Age 11 or younger 12–17 18–24 25–34 35–49 50–64 65 or older 790 790 765 745 780 800 810 730 710 740 825 785 860 925 1,035 1,035 955 840 770 665 4,345 4,510 4,165 4,405 4,615 4,485 4,065 3,840 3,655 3,680 4,305 4,375 4,295 4,480 4,545 4,570 4,445 3,975 4,025 3,850 3,875 3,890 3,800 3,880 3,920 3,875 3,745 3,590 3,200 3,260 1,365 1,425 1,510 1,560 1,755 1,680 1,705 1,685 1,700 1,710 720 750 755 740 660 675 745 745 665 700 1.6 1.6 1.6 1.5 1.6 1.6 1.6 1.5 1.4 1.5 3.3 3.1 3.4 3.6 4.1 4.1 3.8 3.4 3.0 2.7 15.2 15.6 14.2 14.9 15.5 15.0 13.4 12.5 11.9 11.9 10.9 11.1 10.9 11.3 11.4 11.4 10.9 9.6 9.8 9.2 5.9 5.9 5.8 5.9 6.0 5.9 5.8 5.6 5.0 5.2 3.0 3.0 3.1 3.1 3.4 3.1 3.1 3.0 2.9 2.8 2.0 2.1 2.1 2.0 1.8 1.8 1.9 1.9 1.6 1.7 Note: Data may not sum to total due to rounding. Counts rounded to the nearest 5. Homicide rates by Hispanic or Latino origin were not calculated due to missing data on ethnicity. See Methodology. *Includes persons identified as American Indian, Alaska Native, Asian, Native Hawaiian, or other Pacific Islander. Source: Bureau of Justice Statistics, based on data from the FBI, Supplementary Homicide Reports, 2002–2011. P at terns & T rends In 2011, age 30 was the median age of homicide victims, (i.e., half of all murder victims were age 30 or younger and half were age 30 or older). From 2002 to 2011, young adults ages 18 to 24 had the highest homicide rate of any age group. Young adults also experienced the largest homicide rate decline (down 22%), from 15.2 per 100,000 in 2002 to 11.9 in 2011. Persons age 65 or older (down 17%) and youth ages 12 to 17 (down 19%) also experienced large declines in their homicide rates from 2002 to 2011. The peak homicide victimization rate for black males was nearly 9 times higher than the peak rate for white males The homicide rate was analyzed by age for white males, black males, white females, and black females to examine differences in the rates by age for those demographic groups. To achieve a sufficient number of cases to support this analysis, homicide and population data were aggregated across the 10-year period from 2002 to 2011. The magnitude of the homicide rate for males varied by age and race, although the patterns by age among black and white males were similar (figure 5). For example, males under age 15 experienced the highest rate of homicide during the first year of life, regardless of race. During the 10-year period from 2002 to 2011, the average homicide rate for white males under age 1 was 5.1 homicides per 100,000, compared to 12.5 per 100,000 for black males younger than age 1. The homicide victimization rate for both white and black males increased after age 14 and into the early 20s, although with dramatically different trajectories. The homicide rate for white males peaked at age 20 (11.4 homicides per 100,000 white males), while the homicide rate for black males peaked at age 23 (100.3 homicides per 100,000 black males). The highest murder rate for black males was nearly 9 times higher than the highest rate for white males. After peaking for victims in their early 20s, the murder rate for both white and black males declined with age. For victims age 60 or older, the homicide rate for black males was more than 4 higher than the rate for white males. The homicide victimization rate for females was highest during the first year of life For the 10-year period from 2002 to 2011, females younger than age 1 had a higher murder rate than females of any other age group (figure 6). The homicide rate for females younger than age 1 was 4.5 homicides per 100,000 for white females and 10.3 per 100,000 for black females. Among white females, the homicide rate was highest during the first year of life. However, among black females, the homicide rate peaked at age 22 (11.8 homicides per 100,000 black females), a level slightly above the rate for black females younger than age 1. In comparison, the homicide rate for white females at age 22 was 37% lower than the homicide rate for white females younger than age 1. Figure 5 Male homicide rates, by victim age and race, 2002–2011 Figure 6 Female homicide rates, by victim age and race, 2002–2011 Rate per 100,000 males 120 Rate per 100,000 females 14 100 12 10 80 60 Black/African American 8 6 40 4 20 2 White 0 Under 5 10 15 20 25 30 35 40 45 50 55 60 65 70 75 80 85 or age 1 older Age of victim Note: Homicide rates by Hispanic or Latino origin were not calculated due to missing data on ethnicity. See Methodology. Source: Bureau of Justice Statistics, based on data from the FBI, Supplementary Homicide Reports, 2002–2011. Black/African American White 0 Under 5 10 15 20 25 30 35 40 45 50 55 60 65 70 75 80 85 or age 1 older Age of victim Note: Homicide rates by Hispanic or Latino origin were not calculated due to missing data on ethnicity. See Methodology. Source: Bureau of Justice Statistics, based on data from the FBI, Supplementary Homicide Reports, 2002–2011. H O M I C I D E I N T H E U. S . K N O W N TO L AW E N F O R C E M E N T, 2011 | D E C E M B E R 2013 5 P at terns & T rends As with male homicide victims, the murder rates for black females and white females followed similar trends across age groups. The average homicide rate for black females was over 3 times higher than the rate for white females. For both black females and white females, the youth murder rate decreased after age 1. After age 11, the female homicide rate for both races increased substantially. The homicide rate for white females age 11 or older was greatest for ages 20 to 31, with an average homicide rate of 2.8 per 100,000. In comparison, the homicide rate for black females age 11 or older was highest for those ages 21 to 26, with an average homicide rate of 11.4 per 100,000. The peak rate for black females age 11 or older was 4 times higher than the peak rate for white females age 11 or older. Homicide rates among black and white females declined with age after age 30. Among victims age 60 or older, black females experienced a homicide rate that was approximately 2 times higher than the rate for white females. In addition, the rate remained stable among white females age 75 or older, while the homicide rate among black females age 75 or older increased, from 2.2 homicides per 100,000 for persons age 75 to 3.6 per 100,000 for those age 83. The rate of homicides involving a firearm decreased by half from 1992 to 2011 The homicide rate declined from 1992 to 2011, regardless of the type of weapon used in the crime. In 1992, the murder rate for incidents involving a firearm was 6.3 homicides per 100,000 persons (figure 7). By 2011, the firearm-involved homicide rate was 3.2 per 100,000, a decline of 49% from 1992. Overall, the total number of homicide incidents involving a firearm declined from more than 16,100 in 1992 to approximately 9,900 in 2011 (not shown in figure). Declines in the number and rate of firearm-involved homicides known to law enforcement are consistent with declines seen in analysis of data in which homicide was the primary cause of death, as recorded by physicians, medical examiners, and coroners through the National Vital Statistics System (NVSS), a data collection of the National Center on Health Statistics within the federal Centers for Disease Control and Prevention (CDC). Over the same 20-year period, the age-adjusted firearm homicide rate based on data from the NVSS declined 45%, from 6.5 homicides per 100,000 in 1992 to 3.6 per 100,000 in 2011 (not shown in figure).2 For more information, see the two national sources of homicide data in this report and the BJS report Firearm Violence, 1993–2011, NCJ 241730, BJS web, May 2013. The homicide rate for incidents involving other types of weapons also declined from 1992 to 2011. During this 20-year period, the rate of murder involving a knife or blunt object declined by 55%, and the rate of murder involving a personal weapon (including fists or feet and pushing or strangling the victim) decreased by 47%. The rate of homicide involving other nonpersonal weapons (e.g., poison, explosives, fire, narcotics, and unknown weapons) declined by 34%. 2Estimates of firearm-involved homicides from 1992 to 2010 were retrieved from Centers for Disease Control and Prevention, National Center for Injury Prevention and Control, Web-based Injury Statistics Query and Reporting System (WISQARS), 1992–2010, retrieved November 2013 from www.cdc.gov/ncipc/wisqars. Preliminary estimates for 2011 firearm-involved homicides were retrieved from Hoyert, D.L. & Xu, J.Q. (2012), Deaths: Preliminary data for 2011, National Vital Statistics Reports, 61(6). Figure 7 Homicide rates, by weapon type, 1992–2011 Rate per 100,000 U.S. residents 7 6 5 4 3 2 Firearm Personal weapon Other nonpersonal weapon 1 0 1992 1995 1998 2001 2004 Knife or blunt object 2007 2010 Source: Bureau of Justice Statistics, based on data from the FBI, Supplementary Homicide Reports, 1992–2011. H O M I C I D E I N T H E U. S . K N O W N TO L AW E N F O R C E M E N T, 2011 | D E C E M B E R 2013 6 P at terns & T rends Missing information on homicide offenders Using data from the FBI’s Supplementary Homicide Reports (SHR) to estimate the characteristics of homicide offenders is problematic due to the number of homicides in the data file with no information on the offender demographic characteristics. This offender information could be missing because either the reporting law enforcement agency did not identify a suspect (i.e., the offender was unknown) or the agency did not report the information to the SHR (i.e., the offender was known but the information was not reported). In 2011, the most recent year for which SHR data are available, 31% of homicide victims had missing corresponding information on all three primary demographic characteristics (i.e., sex, race, and age) for homicide offenders (table 2). In addition, missing information about the offender is not distributed uniformly across homicide victims. Instead, it varies depending on the characteristics of the victim. For example, the demographic characteristics of the homicide offender were more likely to be missing in the SHR data when the homicide victims were male (36%) compared to female (16%), black (40%) compared to white (23%), older juveniles ages 12 to 17 (34%) compared to younger juveniles age 11 or younger (9%), and adults ages 18 to 34 (37%) compared to adults age 35 or older (24%). Table 2 Missing homicide offender characteristics data, by victim demographic characteristics, 2011 Victim demographic characteristic All victims Sex Male Female Race White Black/African American Other* Age 11 or younger 12–17 18–24 25–34 35–49 50–64 65 or older Missing offender characteristic 31.3% Studying data on crimes cleared (i.e., considered by law enforcement to be solved) can provide information on the degree to which the missing offender information in the SHR data is the result of either the offender being unknown or the offender information being known to law enforcement but not reported in the data. A murder is cleared, or considered solved, by law enforcement when an offender is arrested for the crime, or when an offender is identified but cannot be arrested (e.g., the offender is deceased). Information on whether each reported homicide is cleared is not included as part of the SHR. However, through a separate data collection effort, the FBI compiles information from law enforcement agencies on the total number of murders cleared each year. From 1992 to 2011, the average annual murder clearance rate reported by the FBI was 64%, meaning that law enforcement could not identify an offender in 36% of murders. During the same period, the percentage of murders not cleared by law enforcement was, on average, about 2% lower than the percentage of homicides for which the sex, race, and age of the offender were missing in the SHR data (figure 8). This implies that for more than 9 in 10 murders known to law enforcement for which corresponding offender information was not available, the information was missing because the law enforcement agency did not identify a suspect in the crime. Figure 8 Homicides not cleared and missing homicide offender demographic characteristics data, 1992–2011 35.8% 15.7 Percent 22.6% 39.9 20.0 40 8.9% 33.9 38.3 36.0 29.1 23.4 19.4 Note: Homicide rates by Hispanic or Latino origin were not calculated due to missing data on ethnicity. See Methodology. *Includes persons identified as American Indian, Alaska Native, Asian, Native Hawaiian, or other Pacific Islander. Source: Bureau of Justice Statistics, based on data from the FBI, Supplementary Homicide Reports, 2011. 50 Missing offender characteristics Not cleared by arrest or exceptional means 30 20 10 0 1992 1996 2000 2004 2008 2011 Source: Bureau of Justice Statistics, based on data from the FBI, Supplementary Homicide Reports, 1992–2011 and Crime in the United States, 1992-2011. H O M I C I D E I N T H E U. S . K N O W N TO L AW E N F O R C E M E N T, 2011 | D E C E M B E R 2013 7 P at terns & T rends The percentage of victims killed by a firearm remained relatively stable from 1992 to 2011 While the rate of murder involving a firearm declined by half from 1992 to 2011 for both males and females (figures 9 and 10), the percentage of male and female murders committed with a firearm changed little over the period (figures 11 and 12). In both 1992 and 2011, firearms were reportedly used in 73% of all murders of males and in 49% of all murders of females, with minor fluctuations during the period. Handguns were more commonly involved in homicides than other types of firearms. From 1992 to 2011, handguns were used in an average of 57% of male homicides and in 35% of female homicides. An additional 16% of male homicide victims and 13% of female homicide victims were killed with some other type of firearm (e.g., rifles, shotguns, and firearms of unknown type). The percentage of homicides that involved a firearm was generally stable across periods for various victim types The percentage of homicides involving a firearm was examined by age for white males, black males, white females, and black females across different periods to assess whether the percentage of homicides involving a firearm had changed over time for different demographics of victims. Data on the percentage of homicides known to law enforcement agencies that involved a firearm were calculated for the most recent period from 2008 to 2011 and compared to the percentage of firearm-involved homicides from 1992 to 1995, the period within the past 20 years during which the homicide rate peaked. Overall, the percentage of homicides involving a firearm was similar across the two periods, regardless of victim demographics. Although the number and rate Figure 9 Rate of male homicides involving a firearm, by firearm type, 2002–2011 Figure 11 Percent of male homicides involving a firearm, by firearm type, 2002–2011 Rate per 100,000 males 10 Percent 70 60 8 Handgun 50 6 Handgun 4 30 20 2 0 40 Other firearm* 1992 1996 2000 2004 2008 2011 *Includes rifles, shotguns, and firearms of unspecified type, including automatic weapons. Source: Bureau of Justice Statistics, based on data from the FBI, Supplementary Homicide Reports, 2002–2011. Figure 10 Rate of female homicides involving a firearm, by firearm type, 2002–2011 Other firearm* 10 0 1992 2000 2004 2008 2011 Figure 12 Percent of female homicides involving a firearm, by firearm type, 2002–2011 Rate per 100,000 females 2.0 Percent 50 1.5 40 Handgun 30 1.0 Handgun 0.5 0.0 1996 *Includes rifles, shotguns, and firearms of unspecified type, including automatic weapons. Source: Bureau of Justice Statistics, based on data from the FBI, Supplementary Homicide Reports, 2002–2011. 1992 1996 2000 2004 Other firearm* 2008 2011 *Includes rifles, shotguns, and firearms of unspecified type, including automatic weapons. Source: Bureau of Justice Statistics, based on data from the FBI, Supplementary Homicide Reports, 2002–2011. 20 10 0 Other firearm* 1992 1996 2000 2004 2008 *Includes rifles, shotguns, and firearms of unspecified type, including automatic weapons. Source: Bureau of Justice Statistics, based on data from the FBI, Supplementary Homicide Reports, 2002–2011. 2011 P at terns & T rends of homicides have both decreased substantially since the early 1990s, the nature of firearm use in homicides has not changed. Data show that white males were the only demographic category to have a noticeable decrease in the percentage of homicides involving a firearm from the early to mid-1990s to the late 2000s (figure 13). For white females, the percentage of firearm-involved homicides was nearly the same during the two periods, regardless of age (figure 14). Among black male and black female victims, the percentage of murders involving a firearm was similar between the early to mid-1990s and the late 2000s, with a few exceptions (figures 15 and 16). For example, black male victims ages 25 to 45 experienced a higher proportion of homicides involving a firearm from 2008 to 2011 than from 1992 to 1995, while the opposite was true for white male victims in the same age range. In addition, black female victims ages 18 to 41 were more likely to be murdered with a firearm from 2008 to 2011 than from 1992 to 1995. In comparison, the percentage of white females ages 18 to 41 killed with a firearm was lower during the most recent period than during the early to mid-1990s. Figure 13 Percent of white male homicides involving a firearm, by victim age, 1992–1995 and 2008–2011 Figure 15 Percent of black male homicides involving a firearm, by victim age, 1992–1995 and 2008–2011 Percent 100 Percent 100 1992–1995 2008–2011 80 80 2008–2011 60 40 40 20 20 0 Younger 5 than 1 10 15 20 1992–1995 60 25 30 35 40 Age of victim 45 50 55 60 65 or older 0 Younger 5 than 1 10 15 20 25 30 35 40 Age of victim 45 50 55 60 65 or older Source: Bureau of Justice Statistics, based on data from the FBI, Supplementary Homicide Reports, 1992–1995 and 2008–2011. Source: Bureau of Justice Statistics, based on data from the FBI, Supplementary Homicide Reports, 1992–1995 and 2008–2011. Figure 14 Percent of white female homicides involving a firearm, by victim age, 1992–1995 and 2008–2011 Figure 16 Percent of black female homicides involving a firearm, by victim age, 1992–1995 and 2008–2011 Percent 100 Percent 100 1992–1995 60 60 2008–2011 40 1992–1995 40 20 20 0 Younger 5 than 1 2008–2011 80 80 10 15 20 25 30 35 40 Age of victim 45 50 Source: Bureau of Justice Statistics, based on data from the FBI, Supplementary Homicide Reports, 1992–1995 and 2008–2011. 55 60 65 or older 0 Younger 5 than 1 10 15 20 25 30 35 40 Age of victim 45 50 55 60 65 or older Source: Bureau of Justice Statistics, based on data from the FBI, Supplementary Homicide Reports, 1992–1995 and 2008–2011. H O M I C I D E I N T H E U. S . K N O W N TO L AW E N F O R C E M E N T, 2011 | D E C E M B E R 2013 9 P at terns & T rends Firearm use in nonfatal violent victimizations The proportion of nonfatal violent victimizations (rape or sexual assault, robbery, aggravated assault, and simple assault) involving a firearm was calculated to examine whether it followed the same trend over time as the proportion of homicides involving a firearm. Data on nonfatal violent victimizations come from BJS’s National Crime Victimization Survey (NCVS), which collects information on nonfatal crimes reported and not reported to the police against persons age 12 or older from a nationally representative sample of U.S. households. The percentages of nonfatal violent victimizations of males and females age 12 or older that involved a firearm were compared for the periods 1993 to 1995 and 2008 to 2011 for six different victim age categories. Like the pattern among homicides, the proportion of nonfatal violent victimizations involving a firearm for 1993 to 1995 was similar to the proportion for 2008 to 2011, across most of the victim sex and age groups (figures 17 and 18). Exceptions were found in three categories of victims—males ages 12 to 17, females ages 12 to 17, and males ages 35 to 49—each of which experienced a decrease between the two periods in the percentage of nonfatal violent victimizations involving a firearm. For additional information on nonfatal violent victimizations involving firearms, see Firearm Violence, 1993–2011, NCJ 241730, BJS web, May 2013, and National Crime Victimization Survey (NCVS) data on the BJS website. Figure 17 Level for nonfatal violent victimizations of males involving a firearm, by victim age with confidence intervals at 95%, 1993–1995 and 2008–2011 Figure 18 Level for nonfatal violent victimizations of females involving a firearm, by victim age with confidence intervals at 95%, 1993–1995 and 2008–2011 Percent 30 Percent 30 20 2008–2011 1993–1995 20 10 10 0 0 -10 12–17 18–24 25–34 35–49 Victim age 50–64 65 or older Note: Each vertical bar shows the range within which the true victimization rate was likely to fall. Source: Bureau of Justice Statistics, National Crime Victimization Survey, 1993–1995 and 2008–2011. -10 2008–2011 1993–1995 12–17 18–24 25–34 35–49 Victim age 50–64 65 or older Note: Each vertical bar shows the range within which the true victimization rate was likely to fall. Source: Bureau of Justice Statistics, National Crime Victimization Survey, 1993–1995 and 2008–2011. H O M I C I D E I N T H E U. S . K N O W N TO L AW E N F O R C E M E N T, 2011 | D E C E M B E R 2013 10 P at terns & T rends In 2011, the homicide rate in all types of communities fell to the lowest point in 20 years The homicide rate in large cities decreased by nearly a quarter from 2002 to 2011 Using SHR data, trends in homicide rates were examined for five different types of communities: large cities with 500,000 or more residents, large cities with 100,000 to 499,999 residents, small cities with 99,999 or fewer residents, suburban areas, and rural areas. The murder rate in all five types of communities decreased from 1992 to 2011 (figure 19). The largest declines occurred from 1992 to 2002. During this period, the homicide rate declined by half (down 49%) in the largest urban areas with 500,000 or more residents and decreased by about a third both in urban areas with 100,000 to 499,999 residents (down 37%) and in urban areas with 99,999 or fewer residents (down 31%). The homicide rate in suburban areas declined by 42%, and in rural areas by 27%. To better examine trends in murder rates by type of community from 2002 to 2011, the annual homicide rate from 2003 to 2011 was compared to the 2002 rate in that area. The absolute change in the rate was calculated for each year, with positive numbers indicating an increase from the homicide rate in 2002 and negative numbers demonstrating a reduction from the 2002 baseline. This allowed for an examination of the trends in the homicide rate for each type of community. From 2002 to 2011, the murder rate also declined in each type of community, but by a smaller percentage. Large urban areas had the largest declines. Cities with 100,000 to 499,999 residents and those with 500,000 or more residents experienced a 23% decline in the murder rates during this period. In large cities with populations of 500,000 or more residents, the homicide rate decreased from 14.2 homicides per 100,000 in 2002 to 10.9 in 2011. Similarly, in cities with populations of 100,000 to 499,999, the rate declined from 9.9 homicides per 100,000 in 2002 to 7.7 in 2011. Although the murder rate in other types of communities also dropped from 2002 to 2011, the declines were more modest. The homicide rate in suburban areas declined by 13% over the 10-year period from 2002–2011, from 5.4 to 4.7 homicides per 100,000. In comparison, the homicide rate in small cities with 99,999 or fewer residents did not change substantially, decreasing from 2.0 homicides per 100,000 in 2002 to 1.8 in 2011. Rural areas also saw little change, declining from 3.4 homicides per 100,000 in 2002 to 3.1 in 2011. Figure 19 Homicide rate, by community type, 1992–2011 Cities with 100,000 or more residents showed the largest decreases in homicide rates from 2002 to 2011, but the decline was not uniform across the period (figure 20). For example, while large cities with 500,000 or more residents experienced the largest net decline over the period, the murder rates in 2002 and 2006 were similar. After 2006, the homicide rate dropped rapidly, reaching its lowest level in the last decade in 2011. In comparison to large cities, the homicide rate in suburban areas increased slightly from 2002 to 2007, then decreased through 2011. While the rate fluctuated over the 10-year period, the overall number of homicides in suburban areas in 2011 was nearly equal to the number in 2002. Small cities with less than 100,000 residents and rural areas also experienced little change in their respective homicide rates from 2002 to 2011. Figure 20 Homicide rate change, by community type, 2002–2011 Rate change 1.0 0.0 -1.0 -2.0 -3.0 Rate per 100,000 residents 40 Rural areas Suburban areas Small cities, 99,999 or fewer Large cities, 100,000–499,999 Large cities, 500,000 or more 30 20 -4.0 2002 Rural areas Suburban areas Small cities, 99,999 or fewer Large cities, 100,000–499,999 Large cities, 500,000 or more 2003 2004 2005 2006 2007 2008 2009 2010 2011 Source: Bureau of Justice Statistics, based on data from the FBI, Supplementary Homicide Reports, 2002–2011. 10 0 1992 1996 2000 2004 2008 2011 Source: Bureau of Justice Statistics, based on data from the FBI, Supplementary Homicide Reports, 1992–2011. H O M I C I D E I N T H E U. S . K N O W N TO L AW E N F O R C E M E N T, 2011 | D E C E M B E R 2013 11 P at terns & T rends Rural areas experienced a decrease in the percentage of homicides involving a firearm from 1992 to 2011 From 1992 to 2011, the percentage of homicides involving a firearm fluctuated for all five types of communities (figure 21). During that period, the percentage of homicide victims killed with a firearm increased by nearly 6 percentage points in urban areas with 100,000 to 499,999 residents, but decreased about 2 percentage points in urban areas with 500,000 or more residents. The overall percentage of homicides involving a firearm in small cities with 99,999 or fewer residents and in suburban areas was about the same in 2011 as in 1992. In rural areas, the percentage of homicides involving a firearm decreased by 8 percentage points during the same period. From 2002 to 2011, rural areas experienced an overall decline in the percentage of homicides involving a firearm. In comparison, urban areas with 100,000 to 499,999 residents and those with 500,000 or more residents experienced an increase in the percentage of homicides involving a firearm. The percentage of males and females killed with a firearm differed by community type Overall, an estimated two-thirds (68%) of murders that occurred in 2011 involved a firearm, with nearly half (49%) involving a handgun (table 3). Knives or blunt objects were used in 17% of homicides, and personal weapons (e.g., hands, fists, or feet) and other weapons (e.g., poison, fire, or explosives) were used in 15% of murders. Figure 21 Homicides involving a firearm, by community type, 1992–2011 Percent 80 60 40 Rural areas Suburban areas Small cities, 99,999 or fewer Large cities, 100,000 –499,999 Large cities, 500,000 or more 20 0 1992 1996 2000 2004 2008 2011 Source: Bureau of Justice Statistics, based on data from the FBI, Supplementary Homicide Reports, 1992–2011. Table 3 Weapon use in homicides, by victim sex and community type, 2011 Victim sex and community type Total Male victims Urban area 99,999 or fewer 100,000–249,999 250,000–499,999 500,000–999,999 1 million or more Suburban area Rural area Female victims Urban area 99,999 or fewer 100,000–249,999 250,000–499,999 500,000–999,999 1 million or more Suburban area Rural area Number of homicides 14,610 11,370 8,355 1,620 1,415 1,405 1,585 2,330 2,350 660 3,240 1,945 560 375 275 315 420 1,015 290 Percent 100% 100% 100% 100% 100% 100% 100% 100% 100% 100% 100% 100% 100% 100% 100% 100% 100% 100% 100% Percent of homicides involving a— Knife or Personal Handgun Other firearm* blunt object weapon 49.5% 18.4% 17.2% 7.3% 53.9 19.2 15.8 5.0 57.6 18.3 14.4 4.5 46.7 19.8 19.9 6.7 49.0 25.7 13.9 5.7 59.1 22.7 10.7 3.1 53.4 22.7 14.3 4.8 72.2 6.9 13.4 2.9 47.2 20.4 19.2 5.9 31.8 27.1 20.3 7.9 33.8 15.5 22.2 15.5 34.8 12.7 23.5 16.6 30.5 13.8 24.6 20.7 34.5 14.1 21.0 14.9 39.8 20.1 15.2 13.5 33.5 14.7 23.1 18.3 38.7 3.8 29.8 13.5 33.2 17.1 21.0 15.1 29.3 29.2 17.9 9.1 Other nonpersonal weapon 7.6% 6.1 5.2 6.8 5.7 4.4 4.7 4.6 7.2 13.0 13.0 12.4 10.5 15.5 11.4 10.5 14.2 13.7 14.5 Note: Personal weapon includes pushed or thrown out window, drowning, asphyxiation, and strangulation or hanging; other nonpersonal weapon includes poison, explosives, fire, narcotics or drugs, and unknown weapons. *Includes rifles, shotguns, and firearms of unspecified type, including automatic weapons. Source: Bureau of Justice Statistics, based on data from the FBI, Supplementary Homicide Reports, 2011. H O M I C I D E I N T H E U. S . K N O W N TO L AW E N F O R C E M E N T, 2011 | D E C E M B E R 2013 12 P at terns & T rends In 2011, males (73%) were more likely than females (49%) to be killed with a firearm. In comparison, female homicide victims were more likely than male victims to be killed with a weapon other than a firearm. The percentage of female victims killed with a personal weapon (15%) in 2011 was 3 times higher than the comparable percentage of male victims (5%). The type of community in which the homicide occurred was also related to the type of weapon used in the homicide. Across all types of communities in 2011, a higher proportion of male homicide victims was killed by a firearm than any other weapon. In urban and suburban areas, homicides of males involving a firearm were more than twice as likely to include a handgun than other types of firearms (e.g., a rifle, shotgun, or firearm of an unreported type). In the largest cities with 1 million or more residents, homicides involving a handgun were even more common, with male victims being 10 times more likely to be killed by a handgun (72%) than other types of firearms (7%). In comparison, male homicide victims in rural areas were almost equally likely to be killed with a handgun (32%) as another type of firearm other than a handgun (27%). About half of all firearm homicides in rural areas involved a firearm other than a handgun In 2011, of the more than 9,900 homicides involving a firearm, an estimated 73% involved a handgun (table 4). The percentage of firearm homicides committed with a handgun was similar among males and females, although the percentage fluctuated by type of community. Firearm homicides were more likely to involve a handgun if the murder occurred in a large city with 1 million or more residents (91%) than other urban areas, regardless of the sex of the victim. Similarly, nearly half (47%) of firearm homicides that occurred in rural areas involved a firearm other than a handgun, such as a rifle, shotgun, or other unspecified firearm, compared to about a quarter (24%) of firearm homicides in urban areas and about a third (31%) of firearm homicides in suburban areas. Table 4 Homicides involving a firearm, by victim sex, community type, and firearm type, 2011 Victim sex and community type Total Male victims Urban area 99,999 or fewer 100,000–249,999 250,000–499,999 500,000–999,999 1 million or more Suburban area Rural area Female victims Urban area 99,999 or fewer 100,000–249,999 250,000–499,999 500,000–999,999 1 million or more Suburban area Rural area Number 9,915 8,315 6,335 1,080 1,055 1,150 1,205 1,845 1,590 390 1,600 925 250 180 165 150 180 510 170 All firearms 100% 100% 100% 100% 100% 100% 100% 100% 100% 100% 100% 100% 100% 100% 100% 100% 100% 100% 100% Percent involving— Handgun 72.9 73.7 75.9 70.2 65.6 72.3 70.1 91.2 69.8 54.1 68.5 73.3 68.9 71.0 66.5 69.5 91.0 66.0 50.1 Other firearm* 27.1 26.3 24.1 29.8 34.4 27.7 29.9 8.8 30.2 45.9 31.5 26.7 31.1 29.0 33.5 30.5 9.0 34.0 49.9 Note: Data may not sum to total due to rounding. Counts rounded to the nearest 5. *Includes rifles, shotguns, and firearms of unspecified type, including automatic weapons. Source: Bureau of Justice Statistics, based on data from the FBI, Supplementary Homicide Reports, 2011. H O M I C I D E I N T H E U. S . K N O W N TO L AW E N F O R C E M E N T, 2011 | D E C E M B E R 2013 13 P at terns & T rends Since 2002, the percentage of homicide incidents involving two or more victims has remained relatively stable From 2002 to 2011, the majority (95%) of homicide incidents involved the killing of a single victim (not shown in figure).3 During the same period, about 4% of homicide incidents involved two victims, 0.6% involved three victims, and 0.2% involved four or more victims (figure 22). In 2011, about 110 homicide incidents involved three victims, or less than 1% of all homicides that year. Homicide incidents involving four or more victims were even less frequent. In 2011, of an estimated 13,750 reported homicide incidents, about 25 involved four or more victims. Multiple-victim homicides were more likely than single-victim homicides to involve firearms other than handguns In 2011, 66% of single-victim homicides involved a firearm, and 79% of homicide incidents with multiple victims involved a firearm (table 5). Among homicides reported by law enforcement, the percentage of homicide incidents involving a firearm increased with the number of victims killed in the incident. In 2011, 77% of incidents in which two victims were killed involved a firearm, compared to 82% among homicides in which three victims were killed. For incidents involving four or more victims, 91% of the homicides involved a firearm. The percentage of homicides involving a handgun (49%) remained relatively stable, regardless of the number of victims killed during the incident. However, a larger percentage of multiple-victim homicides than single-victim homicides involved a firearm other than a handgun. An estimated 17% of homicides involving one victim were committed with a firearm other than a handgun, compared to 25% of homicides involving two victims, 35% of homicides involving three victims, and 47% of homicides involving four or more victims. Figure 22 Percent of homicides involving two or more victims, 2002–2011 Percent 5 2 victims 4 3 2 4 or more victims 1 0 2002 2003 2004 2005 2006 2007 3 victims 2008 2009 2010 2011 Source: Bureau of Justice Statistics, based on data from the FBI, Supplementary Homicide Reports, 2002–2011. 3Due to the underlying data structure of the SHR, incidents of mass homicide are difficult to count. Although information on homicides involving more than one victim is presented, these data should be used with caution. See Methodology for details on multiple-victim homicides. Table 5 Homicides in the U.S., by the number of victims killed and weapon type, 2011 Number of homicide victims Total 1 victim 2 victims 3 victims 4 or more victims Number of homicide incidents 13,750 13,050 565 110 25 Total 100% 100% 100% 100% 100% Percent of homicides involving a— Firearm Any firearm Handgun Other firearm* 67.1 49.4 17.7 66.5 49.3 17.2 77.3 52.0 25.3 82.3 47.1 35.2 90.8 44.2 46.6 Other weapon 32.9 33.5 22.7 17.7 9.2 ! Note: Due to limitations of the data, the incident count presented above may not accurately reflect the total number of unique homicide incidents in the United States. For more information on how homicide incidents are counted, see Methodology. *Includes rifles, shotguns, and firearms of unspecified type, including automatic weapons. !Interpret data with caution; estimate based on 10 or fewer incidents. Source: Bureau of Justice Statistics, based on data from the FBI, Supplementary Homicide Reports, 2011. H O M I C I D E I N T H E U. S . K N O W N TO L AW E N F O R C E M E N T, 2011 | D E C E M B E R 2013 14 P at terns & T rends Methodology Data sources The FBI’s Uniform Crime Reporting (UCR) program, launched over 80 years ago, collects and publishes annual statistics on criminal offenses known to law enforcement and on arrests. Information on reported offenses is limited to eight offenses: homicide, forcible rape, robbery, aggravated assault, burglary, larceny-theft, motor vehicle theft, and arson. Data on the number of arrests includes many additional types of crime, such as drug abuse violations and driving under the influence. The FBI annually publishes data from the UCR in Crime in the United States, available at http://www.fbi.gov/ about-us/cjis/ucr/ucr#ucr_cius. The UCR is one of two major national indicators about crime, along with BJS’s National Crime Victimization Survey (NCVS). For more information about these two indicators, see The Nation’s Two Crime Measures, NCJ 122705, BJS web, October 2004. The UCR collects data on only those crimes that come to the attention of law enforcement through direct reports or observation. Of all the crimes included in the UCR, homicide incidents are the most completely documented. Information on other serious offenses (e.g., forcible rape, robbery, and aggravated assault) is currently available at the national level only in summary counts and without any details about the incident, victims, or offenders. Such incident-specific detail is available nationally on homicides through the FBI’s Supplementary Homicide Reports (SHR). Supplementary Homicide Reports Most of the data used in this report are from the SHR, which is a part of the FBI’s UCR program. Supplementary data about homicide incidents include details on location, weapon, and victim and offender demographic characteristics. These SHR data include information on the reporting agency and its residential population; county and Metropolitan Statistical Area designations; geographical division and population group; the sex, age, and race of victims and offenders; and the victim-offender relationship, weapon use, and circumstance of the crime. Contributing law enforcement agencies provided supplementary homicide data for 317,492 (89%) of the estimated 356,470 murders that took place from 1992 to 2011. In this report, homicide is used interchangeably with murder, and includes both murder and nonnegligent manslaughter, which is the willful killing of one human being by another. The analyses presented exclude deaths caused by negligence, suicide, or accident; justifiable homicides; attempts to murder; and murders of U.S. residents that occurred outside the United States. Deaths from the terrorist attacks of September 11, 2001, are also not included in these analyses. The data included in the SHR are on homicides known to law enforcement. The determination that a crime was a homicide was made solely based on police investigation rather than the decision of a court, medical examiner, coroner, jury, or other non-law enforcement entity. All rates were calculated by dividing the estimated number of homicide victims by estimates of the U.S. resident population for the appropriate group. This report used bridged-race population estimates developed by the National Center for Health Statistics and the U.S. Census Bureau, unless otherwise specified. The bridged-race data are available at http://www.cdc.gov/nchs/nvss/bridged_ race/data_documentation.htm. All rates were per 100,000 U.S. residents. Homicide estimates in this report were based on homicides with known attributes and have been rounded to the nearest 5, unless otherwise indicated. The National Archive of Criminal Justice Data (NACJD) stores the data from which the analyses in this report are based. Annual SHR data files are available from NACJD at www.icpsr. umich.edu/icpsrweb/NACJD. Weighting The SHR data were weighted to compensate for the average annual 10% of homicides that were not reported to the SHR. The development of the set of annual weights is a three-step process. Each year the FBI’s annual Crime in the United States report presents a national estimate of murder victims in the United States and estimates of the number of murder victims in each of the 50 states and the District of Columbia. The first stage weight uses the FBI’s annual estimates of murder victims in each state and the number of murder victims from that state found in the annual SHR database. Specifically, the first stage weight for victims in state S in year Y is— FBI’s estimate of murder victims in state S(Year Y) Number of murder victims in the SHR file from state S(Year Y) For complete reporting states, this first stage weight is equal to 1. For partial reporting states, this weight is greater than 1. For states with a first stage weight greater than 2—that is, the state reported SHR data for less than half of the FBI’s estimated number of murder victims in the state—the first stage weight is set to 1. H O M I C I D E I N T H E U. S . K N O W N TO L AW E N F O R C E M E N T, 2011 | D E C E M B E R 2013 15 P at terns & T rends The second stage weight uses the FBI’s annual national estimates of murder victims in the United States and the sum of the first stage weights for each state. The second stage weight for victims in all states in year Y is— FBI’s estimate of murder victims in the United States (Year Y) Sum of the first stage weights of all states(Year Y) The third step in the process is to calculate the final annual victim-level SHR weight. The weight used to develop national estimates of the attributes of murder victims is— SHR weight(Year Y) = (first stage weight(Year Y)) X (second stage weight(Year Y)) Conceptually, the first stage weight uses a state’s own reported SHR records to represent all murder victims in that state, as long as at least 50% of the estimated number of murder victims in that state has a record in the SHR. The sum of the first stage weights then equals the sum of the total number of all murder victims in states with at least 50% SHR coverage and the simple count of those victims from the other reporting states. The second stage weight is used to inflate the first stage weights so that the weight derived from the product of the first and second stage weights represents all murder victims in that year in the United States. The difference between the sum of the first stage weights and the FBI’s annual national estimate of murder victims is the unreported murder victims in states with less than 50% SHR coverage and the murder victims in states that report no data to the SHR in that year. The second stage weight compensates for this difference by assuming that the attributes of the nonreported victims are similar to the attributes of weighted murder victims in that year’s SHR database. The weighting procedure outlined above assumes that the characteristics of unreported homicide incidents are similar to the characteristics of reported incidents. There is no comprehensive way to assess the validity of this assumption. Reporting on victim race and ethnicity The Office of Management and Budget (OMB) established standards for federal statistical agencies regarding the reporting of data on race and ethnicity. These standards indicate that data collections should include a minimum of five categories on race (American Indian or Alaska Native; Asian; black or African American; Native Hawaiian or other Pacific Islander; and white) and two categories on ethnicity (Hispanic or Latino, and non-Hispanic or Latino). Data on race submitted to the FBI for the SHR include four categories on race, as the data collection form used by local law enforcement agencies to submit homicide data combines the two categories of Asian and Native Hawaiian or other Pacific Islander into one category. The SHR data collection form allows for the reporting of information on victim ethnicity; however, on average from 1992 to 2011, more than 98% of homicide victims for whom data were reported to the SHR were missing information on ethnicity. Due to the lack of reporting of ethnicity by submitting law enforcement agencies, homicide rates by Hispanic or Latino origin were not calculated. Missing information on victim age, sex, and race In general, SHR data are missing very little information on the age, sex, or race of homicide victims. On average from 1992 to 2011, victim age was missing for 2% of cases, victim sex was missing for less than 1%, and victim race was missing for 1%. An imputation procedure was developed to replace the missing victim information on each SHR record. This procedure used available information to infer the missing victim characteristics for incidents in which the victim and offender demographic characteristics and weapon information were known. Specifically, unknown victim data were imputed based on the profiles in known-victim cases, matched on victim and offender age, sex, and race, and weapon used. Counting multiple-victim homicides Calculating the exact number of murder victims in an incident is not straightforward due to the way in which multiple-victim homicides are reported in the SHR. The FBI’s reporting guidelines permit a maximum of 11 victims and 11 offenders on each individual homicide incident record in the SHR data. In those rare instances where a crime results in more than 11 homicides, FBI reporting guidelines state that homicide victim information should be distributed across more than one incident record, with the offender information repeated on each. However, these guidelines are not always followed. For example, in April 2007, a student at Virginia Polytechnic Institute killed 32 persons. Victim information for this homicide incident in the FBI’s 2007 SHR data file was allocated across four separate incident records. Three of the records held information on 10 victims, and the fourth record held information on two victims. These four records are not linked in the SHR file. Without knowing that these four records represent a single homicide incident, an analysis of the SHR data would conclude that there were three incidents with 10 victims each and one incident with two victims. H O M I C I D E I N T H E U. S . K N O W N TO L AW E N F O R C E M E N T, 2011 | D E C E M B E R 2013 16 P at terns & T rends These reporting patterns make it difficult to accurately calculate the number of multiple homicides or mass murders in the United States in any given year, without extensive knowledge of the specific incidents. Using SHR data and other sources of information, BJS is working to establish a list of mass murders that have occurred since 1980. Once this task is completed, BJS will produce a modified SHR data file that links together records from the same incident so that analysts will be able to document more precisely trends in mass murders in the United States. Additional methodological considerations The methodology used for this report differs slightly from the methodology used in past BJS reports on homicide. Therefore, the data presented in this report should not be considered comparable to prior BJS homicide publications (see the Homicide Trends in the United States series). In addition, due to concerns regarding the representativeness of offender information contained in the SHR data, information on homicide offending rates and homicide offender characteristics have not been included in this report. For more information, see “Missing information on homicide offenders” on page 6. Alternative sources of national homicide statistics In addition to the FBI’s Supplementary Homicide Reports, the Centers for Disease Control and Prevention (CDC) collects data on homicides in the United States, obtained via death certifications, through the National Vital Statistics System (NVSS). The two sources provide somewhat different estimates of the annual number of homicides and their characteristics. Some of these differences can be attributed to differences in the focus of the two collections. For example, currently the SHR captures information on all murders known to law enforcement that occur in the United States, including homicide involving victims who were not U.S. residents, while the NVSS collects information from death certificates on the homicides of all U.S. residents, including deaths of U.S. residents that occurred in other countries. These and other coverage differences help to explain the differences found in statistics generated from the two data sources. For additional information on the two sources of national data on homicide, see page 2 of this report. Furthermore, many of the variables examined in this report may be related to one another and to other variables not included in the analyses. Complex relationships among variables were not fully explored in this report and warrant more extensive analysis. Readers are cautioned not to draw causal inferences based on the results presented. H O M I C I D E I N T H E U. S . K N O W N TO L AW E N F O R C E M E N T, 2011 | D E C E M B E R 2013 17 The Bureau of Justice Statistics, located in the Office of Justice Programs, U.S. Department of Justice, collects, analyzes, and disseminates statistical information on crime, criminal offenders, victims of crime, and the operation of justice systems at all levels of government. William J. Sabol is acting director. This report was written by Erica L. Smith and Alexia Cooper. Ann Carson and Jennifer Truman provided statistical review and Sheri Simmons provided verification of the report. Jill Thomas and Morgan Young edited the report, and Tina Dorsey, Barbara Quinn, and Morgan Young produced the report. December 2013, NCJ 243035 Office of Justice Programs Innovation • Partnerships • Safer Neighborhoods www.ojp.usdoj.gov


