

Jails in Indian Country, 2021 and the Impact of Covid-19, Aug. 2022
Download original document:
Document text
Document text
This text is machine-read, and may contain errors. Check the original document to verify accuracy.
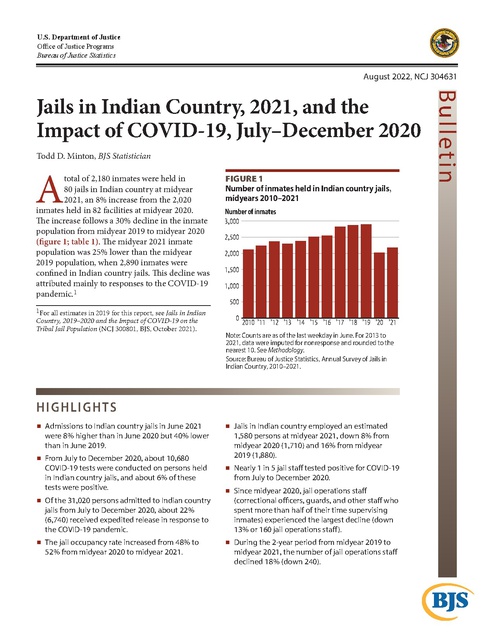
U.S. Department of Justice Office of Justice Programs Bureau of Justice Statistics August 2022, NCJ 304631 Todd D. Minton, BJS Statistician A total of 2,180 inmates were held in 80 jails in Indian country at midyear 2021, an 8% increase from the 2,020 inmates held in 82 facilities at midyear 2020. The increase follows a 30% decline in the inmate population from midyear 2019 to midyear 2020 (figure 1; table 1). The midyear 2021 inmate population was 25% lower than the midyear 2019 population, when 2,890 inmates were confined in Indian country jails. This decline was attributed mainly to responses to the COVID-19 pandemic.1 1For all estimates in 2019 for this report, see Jails in Indian Country, 2019–2020 and the Impact of COVID-19 on the Tribal Jail Population (NCJ 300801, BJS, October 2021). Figure 1 Number of inmates held in Indian country jails, midyears 2010–2021 Number of inmates 3,000 2,500 2,000 1,500 1,000 500 0 2010 ’11 ’12 ’13 ’14 ’15 ’16 ’17 ’18 ’19 ’20 ’21 Note: Counts are as of the last weekday in June. For 2013 to 2021, data were imputed for nonresponse and rounded to the nearest 10. See Methodology. Source: Bureau of Justice Statistics, Annual Survey of Jails in Indian Country, 2010–2021. HIGHLIGHTS Admissions to Indian country jails in June 2021 were 8% higher than in June 2020 but 40% lower than in June 2019. From July to December 2020, about 10,680 COVID-19 tests were conducted on persons held in Indian country jails, and about 6% of these tests were positive. Of the 31,020 persons admitted to Indian country jails from July to December 2020, about 22% (6,740) received expedited release in response to the COVID-19 pandemic. The jail occupancy rate increased from 48% to 52% from midyear 2020 to midyear 2021. Jails in Indian country employed an estimated 1,580 persons at midyear 2021, down 8% from midyear 2020 (1,710) and 16% from midyear 2019 (1,880). Nearly 1 in 5 jail staff tested positive for COVID-19 from July to December 2020. Since midyear 2020, jail operations staff (correctional officers, guards, and other staff who spent more than half of their time supervising inmates) experienced the largest decline (down 13% or 160 jail operations staff ). During the 2-year period from midyear 2019 to midyear 2021, the number of jail operations staff declined 18% (down 240). Bul l etin Jails in Indian Country, 2021, and the Impact of COVID-19, July–December 2020 The pandemic’s impact on Indian country jails began in March 2020, with a 1-month drop of 870 inmates from the end of February to the end of March (figure 2). By the last weekday in December 2020, the number of jail inmates (1,760) had dropped by 1,180 since the end of February 2020. The declines in the inmate population since midyear 2019 resulted from both a reduction in admissions to Indian country jails and expedited releases.2 Findings in this report are based on the Annual Survey of Jails in Indian Country (SJIC) from 2010 to 2021. The 2020 and 2021 surveys included additional questions to measure the impact of the COVID-19 pandemic on Indian country jails. See Methodology. 2All inmates released to limit inmate risk and exposure, or due to coronavirus-related understaffing, court orders, or legislative mandates. Figure 2 Number of inmates held in Indian country jails on the last weekday of each month from January to December 2020 and the last weekday of June 2021 Number of inmates 3,000 2,500 2,000 1,500 1,000 500 0 Jan Feb Mar Apr May June July Aug Sept Oct Nov Dec // June 2020 2021 Note: Data were imputed for nonresponse and rounded to the nearest 10. See Methodology. Source: Bureau of Justice Statistics, Annual Survey of Jails in Indian Country, 2020–2021. Table 1 Inmates held, rated capacity, and percent of rated capacity occupied in Indian country jails in June, 2010 and 2015–2021 Number of inmates Midyeara ADPb Peakc Rated capacityd Percent of capacity occupiede Midyeara ADPb Peakc Number of operating facilities Average number of inmates per operating facilitya 2010 2015 2016 2017 2018 2019 2020 2021 2,119 2,009 2,904 2,951 2,510 2,390 3,230 3,800 2,540 2,480 3,400 4,090 2,820 2,700 3,580 4,200 2,870 2,790 3,580 4,290 2,890 2,820 3,630 4,310 2,020 1,940 2,610 4,230 2,180 2,100 2,630 4,220 71.8% 68.1 98.4 75 66.1% 62.9 85.0 76 62.1% 60.6 83.1 80 67.1% 64.3 85.2 84 66.9% 65.0 83.4 84 67.1% 65.4 84.2 83 47.8% 45.9 61.7 82 51.7% 49.8 62.3 80 28 33 32 34 34 35 25 27 Note: For comparisons over time, data on inmate population and rated capacity were imputed for 7 nonresponding facilities in 2015, 5 in 2016, 8 in 2017, 9 in 2018, 13 in 2019, 5 in 2020, and 3 in 2021, and rounded to the nearest 10. See Methodology. aAs of the last weekday in June. bAverage daily population (ADP) is the sum of the number of inmates held each day in June, divided by 30. cThe number of inmates held on the day in June when the facility’s inmate population was largest. Data were imputed for 1 facility in 2016, 2018, and 2019; 2 in 2020; and 1 in 2021 that responded to the survey but did not report peak population. dThe maximum number of beds or inmates assigned by a rating official to a facility, excluding separate temporary holding areas. Data were imputed for 1 facility in 2019 and 2 in 2020 that responded to the survey but did not report rated capacity. eThe number of inmates in a facility divided by its rated capacity and multiplied by 100. Source: Bureau of Justice Statistics, Annual Survey of Jails in Indian Country, 2010 and 2015–2021. J A I L S I N I N D I A N CO U N T R Y , 2021 , A N D T H E I M PAC T O F CO V I D - 19 , J U LY – D E C E M B E R 2020 | AU G U S T 2022 2 2021 Annual Survey of Jails in Indian Country Special Addendum on Coronavirus (COVID-19) In response to the COVID-19 pandemic, the Bureau of Justice Statistics (BJS) added a special addendum to the 2020 and 2021 Annual Survey of Jails in Indian Country to measure the impact of this public health emergency on Indian country jails. In designing the addendum, BJS solicited comments and suggestions from a correctional health expert, tribal jail administrators, and the Bureau of Indian Affairs regarding data availability and reporting capabilities, question design and order, and estimated burden. COVID-19 tests conducted on inmates from July 1 to December 31, 2020 inmates who tested positive for COVID-19 from July 1 to December 31, 2020 staff who tested positive for COVID-19 from July 1 to December 31, 2020 total, confirmed, and suspected COVID-19 inmate deaths and staff deaths from July 1 to December 31, 2020 Key items from the 2021 addendum asked about the number of— total inmate and staff COVID-19 deaths that were based on a medical examiner or coroner evaluation (such as an autopsy, a postmortem exam, or a review of medical records). inmates on the last weekday of each month from July 1 to December 31, 2020 inmates who received expedited release due to COVID-19 from July 1 to December 31, 2020 For the full questionnaire, see https://bjs.ojp.gov/datacollection/survey-jails-indian-country-sjic#surveys-0. Terms and definitions COVID-19 Confirmed deaths—Deaths where COVID-19 was the cause of death or a significant contributor of death as determined by a positive test for coronavirus before or after death. COVID-19 test—A viral test for coronavirus disease. This is not a serology or antibody test. Expedited releases—All inmates released to limit inmate risk and exposure, or due to coronavirus-related understaffing, court orders, or legislative mandates. Suspected deaths—Deaths where coronavirus was the suspected cause of death or a significant contributor to the death, based on the person having symptoms of COVID-19 but no positive test for coronavirus. General Average daily population (ADP)—The sum of the number of inmates held each day in June, divided by 30. Average length of stay—The ADP divided by the number of June admissions and multiplied by 30. Indian country—The legal term used to describe reservations and other lands set aside for Indian use, such as Indian allotments, and lands held in trust for Indians or Indian tribes (18 U.S.C. § 1151). Jail operations staff—Correctional officers, guards, and other staff who spend more than half of their time supervising inmates. Midyear population—The number of inmates held on the last weekday in June. Peak population—The number of inmates held on the day in June when the facility’s inmate population was the largest. Percent of capacity occupied—The number of inmates in a facility divided by its rated capacity and multiplied by 100. P.L. 280—Under P.L. 83–280 (18 U.S.C. § 1162), some states have jurisdiction to prosecute certain crimes committed by or against American Indians and Alaska Natives. State law enforcement and courts may arrest, investigate, prosecute, and punish offenders. With some exceptions, the law affects Indian country in Alaska, California, Minnesota, Nebraska, Oregon, and Wisconsin. Pursuant to the Tribal Law and Order Act of 2010, tribes are authorized to request that federal authorities reassume concurrent federal jurisdiction. Rated capacity—The maximum number of beds or inmates assigned by a rating official to a facility, excluding separate temporary holding areas. Tribal Law and Order Act (TLOA)—Signed into law in 2010, the act enhanced tribes’ authority to prosecute and sentence criminals. It expanded law enforcement resources and tools, increasing staffing, training, and access to databases of shared criminal information. It authorized new guidelines for handling sexual assaults and domestic violence, and it encouraged development of more effective programs to prevent alcohol and drug abuse. J A I L S I N I N D I A N CO U N T R Y , 2021 , A N D T H E I M PAC T O F CO V I D - 19 , J U LY – D E C E M B E R 2020 | AU G U S T 2022 3 The largest facilities experienced the greatest increase in their midyear populations from 2020 to 2021 The number of inmates in Indian country jails rose nearly 8% (up 160) from midyear 2020 to midyear 2021 (table 2). During this period, the inmate population in facilities rated to hold 50 or more inmates saw the largest increase (up 10% or 130 inmates), followed by facilities rated to hold 25 to 49 inmates (up 5% or 30 inmates). The inmate population in facilities rated to hold fewer than 25 inmates remained relatively stable from midyear 2020 to midyear 2021. Admissions to Indian country jails increased 8% from June 2020 to June 2021 About 5,780 persons were admitted to Indian country jails in June 2021, up 8% from the 5,330 admissions in June 2020 (table 3). Admissions were 40% lower in June 2021 than in June 2019 (not shown in tables). While the largest and smallest facilities (facilities rated to hold 9 or fewer inmates) reported increased admissions, facilities rated to hold 10 to 24 inmates reported 140 fewer admissions in June 2021 than in June 2020. Jails rated to hold 25 or more inmates accounted for most admissions in June 2020 (88%) and June 2021 (92%). Facilities rated to hold nine or fewer inmates accounted for less than 1% of June admissions in 2020 and 2021. The average length of stay (the time in custody from admission to release) for inmates remained stable (11 days) from June 2020 to June 2021. The average length of stay was longer in larger facilities. In June 2021, inmates in facilities rated to hold 49 or fewer inmates spent an average of 6 days in jail from admission to release, similar to June 2020. Inmates in facilities rated to hold 50 or more inmates were held for 18 days on average in June 2021. Table 2 Number of inmates held in Indian country jails, by facility size, midyear 2020 to midyear 2021 Facility sizea Total 9 or fewer 10–24 25–49 50 or more Number of facilities 2020 2021 82 80 4 4 21 18 32 34 25 24 2020 2,020 5 120 580 1,320 Inmatesb 2021 2,180 4 120 610 1,450 Change in inmate population Number Percent 160 7.9% -1 -20.0 0 0.0 30 5.2 130 9.8 Note: Data were imputed for nonresponse. Data were rounded to the nearest 10, except for facilities with a rated capacity of nine or fewer beds or inmates. aBased on the rated capacity, which is the maximum number of beds or inmates assigned by a rating official to a facility, excluding separate temporary holding areas. bAs of the last weekday in June. Source: Bureau of Justice Statistics, Annual Survey of Jails in Indian Country, 2020–2021. Table 3 Average daily population, admissions, and average length of stay in Indian country jails, by facility size, June 2020– June 2021 Facility sizea Total 9 or fewer 10–24 25–49 50 or more 2020 1,940 2 120 550 1,270 ADPb 2021 2,100 1 110 590 1,400 June admissions 2020d 2021e 5,330 5,780 14 22 610 470 2,630 2,900 2,070 2,400 Average length of stayc 2020 2021 10.9 days 10.9 days 4.3 1.4 5.9 7.0 6.3 6.1 18.4 17.5 Note: Data were imputed for nonresponse. Data were rounded to the nearest 10, except for facilities with a rated capacity of nine or fewer beds or inmates. aBased on the rated capacity, which is the maximum number of beds or inmates assigned by a rating official to a facility, excluding separate temporary holding areas. bAverage daily population (ADP) is the sum of the number of inmates held each day in June, divided by 30. cThe ADP divided by the number of June admissions and multiplied by 30. See Methodology. dData were imputed for 5 nonresponding facilities in 2020 (130 admissions combined). eData were imputed for 3 nonresponding facilities in 2021 (552 admissions combined). Source: Bureau of Justice Statistics, Annual Survey of Jails in Indian Country, 2020–2021. J A I L S I N I N D I A N CO U N T R Y , 2021 , A N D T H E I M PAC T O F CO V I D - 19 , J U LY – D E C E M B E R 2020 | AU G U S T 2022 4 About half of jail beds in Indian country were occupied at midyear 2021 While the inmate population increased about 8% from midyear 2020 to midyear 2021, the rated capacity remained relatively stable (table 4). As a result, the jail occupancy rate increased from 48% at midyear 2020 to 52% at midyear 2021. At midyear 2021, about 36% of beds in facilities rated to hold fewer than 25 inmates were occupied, and more than half (53%) were occupied in facilities rated to hold 25 or more inmates. Six facilities were operating above their rated capacity at midyear 2021 (table 5). This was an increase from 4 facilities at midyear 2020 and a decrease from 10 facilities operating above their rated capacity at midyear 2019 (not shown in tables). Eleven facilities were operating above their rated capacity on the most crowded day in June 2021, down from 13 facilities in June 2020. By comparison, 28 facilities were operating above their rated capacity on the most crowded day in June 2019 (not shown in tables). More inmates were held for violent (up 6%) and nonviolent (up 10%) offenses at midyear 2021 than at midyear 2020 The number of inmates held for violent offenses increased 6%, from 850 at midyear 2020 to 900 inmates at midyear 2021 (table 6). During this period, the number of inmates held for domestic violence increased by 40 (from 340 to 380 inmates) and the number held for other unspecified violent offenses increased by 30 (from 110 to 140 inmates). The number held for aggravated or simple assault declined by 20 (from 360 to 340 inmates), and the number held for rape or sexual assault did not change. At midyear 2021, inmates held for violent offenses accounted for 41% of all inmates held in Indian country jails, similar to 2020 (42%), but well above the 2010–2019 midyear average of about 30% of all inmates held.3 The percentage of all inmates held for domestic violence increased from 13% at midyear 2019 to 17% at midyear 2020 and 18% at midyear 2021. The percentage of all inmates who were held at midyear 2021 for aggravated or simple assault (16%) represented a slight decline from midyear 2020 (18%), although larger than the percentage at midyear 2019 (10%). 3For midyears 2011 through 2014, see Jails in Indian Country, 2016 (NCJ 250981, BJS, December 2019). For midyears 2016 through 2018, see Jails in Indian Country, 2017–2018 (NCJ 252155, BJS, October 2020). Table 5 Number of Indian country jails, by population measures and percent of rated capacity occupied, June 2021 Percent of rated capacity occupieda 24% or less 25%–49% 50%–74% 75%–100% 101% or more Midyearb 25 23 15 11 6 ADPc 27 22 16 8 7 Peakd 16 23 16 14 11 aThe number of inmates in a facility divided by its rated capacity and multiplied by 100. Rated capacity is the maximum number of beds or inmates assigned by a rating official to a facility, excluding separate temporary holding areas. bAs of the last weekday in June. cAverage daily population (ADP) is the sum of the number of inmates held each day in June, divided by 30. dThe number of inmates held on the day in June when the facility’s inmate population was largest. Source: Bureau of Justice Statistics, Annual Survey of Jails in Indian Country, 2021. Table 4 Capacity of Indian country jails, by facility size, midyear 2020 to midyear 2021 Facility sizea Total 9 or fewer 10–24 25–49 50 or more Rated capacityb 2020 2021 4,230 4,220 28 20 350 320 1,190 1,260 2,670 2,630 Percent of capacity occupied at midyearc 2020 2021 47.8% 51.7% 17.9 20.0 34.3 37.5 48.7 48.4 49.4 55.1 Percentage point changed 3.9 2.1 3.2 -0.3 5.7 Note: Data were imputed for nonresponse. Data were rounded to the nearest 10, except for facilities with a rated capacity of nine or fewer beds or inmates. aBased on the rated capacity (see note b). bThe maximum number of beds or inmates assigned by a rating official to a facility, excluding separate temporary holding areas. cThe number of inmates in a facility on the last weekday in June, divided by its rated capacity and multiplied by 100. dThe numerical difference between two percentages. Source: Bureau of Justice Statistics, Annual Survey of Jails in Indian Country, 2020–2021. J A I L S I N I N D I A N CO U N T R Y , 2021 , A N D T H E I M PAC T O F CO V I D - 19 , J U LY – D E C E M B E R 2020 | AU G U S T 2022 5 Table 6 Inmates held in Indian country jails, by demographic and criminal justice characteristics, midyears 2010, 2015, and 2019–2021 Characteristic Totala Sex Male Female Age group Juvenileb Male Female Adult Male Female 18–24 25–34 35–44 45–54 55–64 65 or older Conviction status Convicted Unconvicted Most serious offense Violent offense Domestic violence Aggravated/simple assault Rape/sexual assault Other violent Nonviolent Burglary Larceny-theftc Public intoxicationd DWI/DUIe Drug Other unspecifiedf 2010 2,119 2015 2,510 Number 2019 2,890 2020 2,020 2021 2,180 2010 100% 2015 100% Percent 2019 100% 2020 100% 2021 100% 1,640 480 1,870 640 2,190 710 1,540 480 1,600 580 77% 23 75% 25 76% 24 76% 24 73% 27 250 160 90 1,870 1,480 390 ... ... ... ... ... ... 210 140 70 2,300 1,730 570 ... ... ... ... ... ... 160 100 60 2,740 2,090 650 ... ... ... ... ... ... 140 90 50 1,880 1,450 430 : : : : : : 140 90 50 2,040 1,510 530 400 850 520 190 70 10 12% 8 4 88 70 18 ... ... ... ... ... ... 8% 6 3 92 69 23 ... ... ... ... ... ... 6% 3 2 94 72 22 ... ... ... ... ... ... 7% 4 2 93 72 21 : : : : : : 6% 4 2 94 69 24 18 39 24 9 3 <1 1,240 880 1,380 1,130 1,490 1,400 1,070 950 1,030 1,150 59% 41 55% 45 52% 48 53% 47 47% 53 660 280 230 40 110 1,470 ... ... ... 220 100 1,150 760 330 240 40 150 1,760 50 30 440 180 140 920 790 360 280 40 110 2,090 40 60 510 160 280 1,040 850 340 360 40 110 1,160 30 20 230 100 220 560 900 380 340 40 140 1,280 30 30 220 150 270 570 31% 13 11 2 5 69 ... ... ... 10 4 54 30% 13 10 2 6 70 2 1 17 7 6 37 27% 13 10 1 4 73 1 2 18 6 10 36 42% 17 18 2 5 58 1 1 11 5 11 28 41% 18 16 2 6 59 1 1 10 7 12 26 Note: Data are as of the last weekday in June. Some counts were imputed for nonresponse or rounded to the nearest 10. Details may not sum to totals due to rounding. Data may differ from previously published statistics in the Jails in Indian Country series due to imputation and rounding. See appendix table 4 for details on imputations. ...Not collected. :Collected but not calculated in 2020. aTotal midyear populations for 2015, 2019, 2020, and 2021 were imputed for nonresponse and rounded to the nearest 10. bPersons age 17 or younger. cExcludes motor vehicle theft. dIncludes drunk and disorderly conduct. eDriving while intoxicated or driving under the influence of alcohol or drugs. fBJS began collecting data on burglary, larceny or theft, and public intoxication in 2013. As a result, other unspecified offenses in prior years are not comparable to 2013 through 2021. Other unspecified may include motor vehicle theft and other property crimes, public order offenses, civil infractions, and other unspecified offenses. Source: Bureau of Justice Statistics, Annual Survey of Jails in Indian Country, 2010, 2015, and 2019–2021. J A I L S I N I N D I A N CO U N T R Y , 2021 , A N D T H E I M PAC T O F CO V I D - 19 , J U LY – D E C E M B E R 2020 | AU G U S T 2022 6 The number of inmates held in Indian country jails for a nonviolent offense increased 10% (or 120 inmates) from midyear 2020 (1,160) to midyear 2021 (1,280). During this period, the number of inmates held for larceny or theft increased by 10 (from 20 to 30 inmates) and the number held for DWI/DUI increased by 50 (from 100 to 150 inmates). The number held for drug offenses increased by 50 (from 220 to 270 inmates), and the number held for other unspecified nonviolent offenses increased by 10 (from 560 to 570 inmates). The number held for public intoxication declined by 10 (from 230 to 220 inmates), and the number held for burglary did not change. The percentage of all inmates who were held for a nonviolent offense remained relatively stable from midyear 2020 (58%) to midyear 2021 (59%) but was below the midyear 2010–2019 average of about 70%. From midyear 2020 to midyear 2021, slight increases were observed in the share of inmates held for a drug offense (from 11% to 12%) or DWI/DUI (from 5% to 7%) and slight decreases in the share held for public intoxication (from 11% to 10%) or other unspecified nonviolent offenses (from 28% to 26%). The percentage of all inmates who were held for burglary (1%) or for larceny or theft (1%) remained stable during the same period. The number of unconvicted inmates increased 21% from midyear 2020 to midyear 2021, and the convicted inmate population declined 4%. As a result, the percentage of all inmates who were unconvicted increased from 47% at midyear 2020 to 53% at midyear 2021. The number of female inmates (up 100) increased more than the number of male inmates (up 60) from midyear 2020 to midyear 2021. As a result, the percentage of inmates held in Indian country jails who were female increased to 27% at midyear 2021, accounting for the largest share of female inmates since 2016 (also 27%). Adult inmates accounted for 94% of all inmates held in Indian country jails at midyear 2021. At midyear 2021, most (81%) inmates were ages 18 to 44, followed by those ages 45 to 64 (12%) and age 65 or older (less than 1%). The number of persons age 17 or younger held in Indian country jails remained stable from midyear 2020 to midyear 2021 at 140, though this was 20 fewer than at midyear 2019. The percentage of those held at midyear who were age 17 or younger has remained between 6% and 8% of all inmates since 2015. Indian country jails reported one death during the 12 months ending June 30, 2021 One inmate died and 27 attempted suicide in Indian country jails during the 12 months ending on June 30, 2021, based on reports from facilities holding about 95% of the midyear inmate population (not shown in tables).4 Altogether, jails reported 21 deaths in custody from midyear 2010 to midyear 2021. About 6% of COVID-19 tests conducted on inmates from July to December 2020 were positive During the 6-month period from July 1 to December 31, 2020, about 31,020 persons were admitted to Indian country jails (table 7). More than a third (34% as a 4Counts are based on death data from 77 of the 80 facilities operating as of June 30, 2021 and suicide data from 76. Facilities that did not respond to the survey or the question on inmate deaths were excluded. Details on the one death were unavailable from the facility. No COVID19-related inmate deaths were reported. Table 7 COVID-19 testing and positive cases among inmates in Indian country jails, by facility size, July 1–December 31, 2020 Facility sizea Total 9 or fewer 10–24 25–49 50 or more Admissionsb 31,020 68 2,030 17,260 11,660 Number of tests conductedc 10,680 27 230 2,310 8,120 COVID-19 tests conducted on inmates Tests as a percent of admissions Number of positive testsc 34.4% 600 39.9 0 11.3 10 13.4 190 69.6 400 Percent of positive tests 5.6% 0.0 4.3 8.2 4.9 Note: Data were imputed for nonresponse and rounded to the nearest 10, except for the facilities with a rated capacity of nine or fewer beds or inmates. aBased on the rated capacity, which is the maximum number of beds or inmates assigned by a rating official to a facility, excluding separate temporary holding areas. bAdmissions from July 2020 to December 2020 were estimated based on admissions in June 2021 and on the confined population on the last weekday in July 2020 to December 2020. See Methodology. cInmates may be tested more than once and may account for multiple positive tests. See Methodology. Source: Bureau of Justice Statistics, Annual Survey of Jails in Indian Country, 2021. J A I L S I N I N D I A N CO U N T R Y , 2021 , A N D T H E I M PAC T O F CO V I D - 19 , J U LY – D E C E M B E R 2020 | AU G U S T 2022 7 percentage of admissions) were tested for COVID-19, up from 10% tested from March 1 to June 30, 2020.5 (See appendix table 1.) From July 1 to December 31, 2020, about 10,680 COVID-19 tests were conducted on persons held in Indian county jails. About 6% of the tests were positive. In facilities rated to hold 50 or more inmates, 8,120 tests were administered and 5% of the tests were positive. About 8% of the 2,310 tests in facilities rated to hold 25 to 49 inmates were positive, compared to a test positivity rate of 5% or less in facilities of other sizes. From July to December 2020, about 1 in 5 inmates received expedited release in response to the COVID-19 pandemic About 22% of the 31,020 persons admitted to Indian country jails from July 1 to December 31, 2020 were released on an expedited basis to limit inmate risk and exposure to COVID-19 or due to coronavirus-related understaffing, court orders, or legislative mandates (table 8). This was double the 11% of 21,190 persons admitted from March 1 to June 30, 2020 who received expedited release.6 (See appendix table 2.) Table 8 Admissions to and expedited releases from Indian county jails, by facility size, July 1–December 31, 2020 Facility sizea Total 9 or fewer 10–24 25–49 50 or more Admissionsb 31,020 68 2,030 17,260 11,660 Expedited releasesc As a percent Number of admissions 6,740 21.7% 41 60.6 1,650 81.3 4,850 28.1 200 1.7 Note: Data were imputed for nonresponse. Data were rounded to the nearest 10, except for facilities with a rated capacity of nine or fewer beds or inmates. aBased on the rated capacity, which is the maximum number of beds or inmates assigned by a rating official to a facility, excluding separate temporary holding areas. bEstimated based on admissions in June 2021 and on the confined population on the last weekday of each month from July to December 2020. See Methodology. cExpedited releases were granted to limit inmate risk and exposure or due to coronavirus-related understaffing, court orders, or legislative mandates. See Methodology. Source: Bureau of Justice Statistics, Annual Survey of Jails in Indian Country, 2021. About 81% of persons admitted to jails rated to hold 10 to 24 inmates from July to December 2020 received expedited release, compared to about 2% of persons admitted to facilities rated for 50 or more inmates. 5Monthly admissions were used to estimate the number of jail inmates who could have been tested for COVID-19 during the same period. 6The number of admissions from March to December 2020 was used to estimate the number of jail inmates who could have received expedited release. J A I L S I N I N D I A N CO U N T R Y , 2021 , A N D T H E I M PAC T O F CO V I D - 19 , J U LY – D E C E M B E R 2020 | AU G U S T 2022 8 Most positive staff tests during this period occurred in jails rated to hold 50 or more inmates (58%) or 25 to 49 inmates (34%), similar to the March–June 2020 period. No staff deaths due to COVID-19 were reported from July to December 2020.8 The number of staff in Indian country jails continued to decline Jails in Indian country employed an estimated 1,580 persons at midyear 2021, down nearly 8% from the 1,710 at midyear 2020 and 16% from the 1,880 at midyear 2019 (table 9). The number of jail operations staff (correctional officers, guards, and other staff who spent more than half of their time supervising inmates) declined 13% (down 160) from midyear 2020 to midyear 2021, the largest decrease among staff measured. During the 2-year period from midyear 2019 to midyear 2021, the number of jail operations staff declined 18% (down 240). Jails held 2.0 inmates per jail operations staff at midyear 2021, up from the ratio of 1.6 to 1 at midyear 2020, due to an increase in inmates and decline in jail operations staff. 8Staff deaths were not estimated for jails that did not respond to the survey or the question on COVID-19-related staff deaths. Table 10 COVID-19 positive cases among staff in Indian country jails, by facility size, July 1–December 31, 2020 Facilities Staff at Facility sizea at midyear midyearb Total 9 or fewer 10–24 25–49 50 or more Nearly 1 in 5 jail staff tested positive for COVID-19 from July to December 2020 80 4 18 34 24 1,582 10 189 561 822 Number of positive testsc 295 1 22 100 172 Percent of staff who tested positive 18.6% 10.0 11.4 17.8 20.9 Note: Data were imputed for nonresponse and unrounded. aBased on the rated capacity, which is the maximum number of beds or inmates assigned by a rating official to a facility, excluding separate temporary holding areas. bIncludes correctional officers, guards, and other staff who spend more than half of their time supervising inmates; and jail administrators, assistants, and other personnel who work in an administrative capacity more than half of the time. cMultiple positive results for the same employee were counted only once. The survey collected the number of staff who reported a positive test for COVID-19 but did not capture the total number of staff who were tested for COVID-19 due to potential difficulties in measuring employee testing practices (i.e., tests conducted in jail or on employees’ personal time). See Methodology. Source: Bureau of Justice Statistics, Annual Survey of Jails in Indian Country, 2021. About 19% of the approximately 1,580 staff in Indian country jails had a positive test for COVID-19 from July to December 2020, based on the total staff count at midyear 2021 (table 10).7 This was nearly four times the positive rate from March to June 2020 (5% of the 1,710 staff at midyear 2020). (See appendix table 3.) 7The survey collected the number of staff who reported a positive test for COVID-19 but did not capture the total number of staff who were tested for COVID-19 due to potential difficulties in measuring employee testing practices (i.e., tests conducted in jail or on employees’ personal time). Table 9 Persons employed in Indian country jails, by job function, midyears 2010, 2015, and 2019–2021 Job function 2010a Total 1,469 Administrativec 157 Jail operationsd 1,010 Educational 27 Technical/professional 56 Clerical/maintenance/food service 186 Other unspecified 33 Number of inmates per jail operations employee 2.1 2015b 1,690 150 1,200 30 70 210 40 2.1 Number 2019b 1,880 190 1,340 40 80 220 10 2.2 2020b 1,710 170 1,260 30 40 200 10 2021b 1,580 200 1,100 40 50 180 10 1.6 2.0 2010 100% 10.7 68.8 1.8 3.8 12.7 2.2 2015 100% 8.9 71.0 1.8 4.1 12.4 2.4 Percent 2019 100% 10.1 71.3 2.1 4.3 11.7 0.5 2020 100% 9.9 73.7 1.8 2.3 11.7 0.6 2021 100% 12.7 69.6 2.5 3.2 11.4 0.6 ~ ~ ~ ~ ~ Note: Details may not sum to totals due to rounding. ~Not applicable. aData were not rounded because the response rate was 100%. bData were imputed for nonresponse and rounded to the nearest 10, except for job functions with five or fewer employees. See appendix table 5 for details on imputations. cIncludes jail administrators, assistants, and other personnel who work in an administrative capacity more than half of the time. dIncludes correctional officers, guards, and other staff who spend more than half of their time supervising inmates. Source: Bureau of Justice Statistics, Annual Survey of Jails in Indian Country, 2010, 2015, and 2019–2021. J A I L S I N I N D I A N CO U N T R Y , 2021 , A N D T H E I M PAC T O F CO V I D - 19 , J U LY – D E C E M B E R 2020 | AU G U S T 2022 9 Methodology The Annual Survey of Jails in Indian Country (SJIC) includes all correctional facilities in Indian country that are operated by tribal authorities or the U.S. Department of the Interior’s Bureau of Indian Affairs. The Bureau of Justice Statistics (BJS) has conducted the SJIC annually since 1998, excluding 2005 and 2006. Through a cooperative agreement with BJS, Westat has conducted the SJIC since 2007, which is designed to cover all adult and juvenile jail facilities and detention centers in Indian country. The reference dates are the last weekday in June for the annual SJIC, January to June 2020 for the 2020 SJIC COVID-19 Addendum, and July to December 2020 for the 2021 SJIC COVID-19 Addendum. The survey collects data about the number of inmates and the percentage of capacity occupied in Indian country jails. Capacity occupied is based on the June average daily population (ADP), midyear population, and peak population in facilities in June. The ADP is the sum of the number of inmates held each day in June, divided by 30. The midyear count is the number of inmates held on the last weekday in June, and the peak population is the number of inmates held on the day in June when the facility’s custody population was largest. Percent of capacity occupied in 2021 Using a rated capacity of 4,220 inmates for all Indian country jails, the percent of capacity occupied was calculated based on— ADP = 49.8% (2,100 ÷ 4,220) Midyear population = 51.7% (2,180 ÷ 4,220) Peak population = 62.3% (2,630 ÷ 4,220). Estimates of capacity occupied were affected by widespread jail releases in 2020 due to COVID-19. BJS added a special addendum to the 2020 and 2021 SJIC to gather data on these pandemic-related releases. (For details, see 2020 Annual Survey of Jails in Indian Country Special Addendum on Coronavirus (COVID-19).) BJS met with the Office of Management and Budget in June 2020 to finalize the addendum questionnaire and received approval on June 19, 2020. Survey universe BJS updates its roster of jails in Indian country each year by faxing or emailing questionnaires to jail administrators and making follow-up phone calls. As part of the 2021 SJIC, BJS pilot-tested the web-based data collection in nine facilities. All nine submitted their survey. The survey universe and response rates have changed over time. Some facilities closed or merged, new facilities were constructed, and existing facilities became operational and newly eligible for the survey (table 11). One respondent in 2010 that included one adult and one juvenile facility was treated as two facilities in 2011. Two facilities in 2018 merged into one facility in 2019. One facility in 2021 was reclassified from one mixed adult and juvenile facility into two separate adult and juvenile facilities. A total of 77 of 80 eligible facilities responded to the 2021 survey. For facilities that did not respond to the survey or reported incomplete data, BJS used the most recent prior year’s data to impute the midyear and peak populations, ADP, and admissions. BJS imputed data on inmate populations for 7 nonresponding facilities in 2015 (which accounted for 15% of all inmates held at midyear), 5 in 2016 (9%), 8 in 2017 (14%), 9 in 2018 (15%), 13 in 2019 Table 11 Survey universe and response rates of Indian country jails, 2010 and 2015–2021 2010 Original roster of facilitiesc Number of facilities 86 Nonoperational/ out-of-scoped Pre-survey fielding 7 Post-survey fielding 4 Added facilitiese 0 Active survey universef 75 Number of respondents 75 Number of nonrespondents 0 Response rate 100% 2015 2016 2017 2018 2019a 2020 2021b 90 90 91 96 96 97 95 7 8 7 12 13 10 12 7 0 3 1 5 5 0 0 0 1 5 0 4 1 76 80 84 84 83 82 80 69 75 76 75 70 77 77 7 5 8 9 13 5 3 91% 94% 90% 89% 84% 94% 96% Note: The survey was not conducted in 2005 and 2006. See the Jails in Indian Country series on the BJS website for the survey universes in 1998 to 2009 and 2011 to 2014. aTwo facilities merged into one facility, resulting in a final universe of 83 facilities. bOne facility was reclassified from one mixed adult and juvenile facility into two separate adult and juvenile facilities, resulting in a final universe of 80 facilities. cIncludes the number of facilities expected to be surveyed. dIncludes the number of facilities determined to be closed or out of the survey’s scope, either prior to the fielding of the survey or during data collection. eIncludes the number of facilities that were newly constructed, new to the data collection, or reopened after being temporarily closed. fIncludes the final number of facilities in the survey universe after removing nonoperational and out-of-scope facilities. Source: Bureau of Justice Statistics, Annual Survey of Jails in Indian Country, 2010 and 2015–2021. J A I L S I N I N D I A N CO U N T R Y , 2021 , A N D T H E I M PAC T O F CO V I D - 19 , J U LY – D E C E M B E R 2020 | AU G U S T 2022 10 (16%), 5 in 2020 (6%), and 3 in 2021 (5%). All operating facilities responded to the 2010 survey.9 For this report, Indian country includes reservations, pueblos, rancherias, and other appropriate areas (18 U.S.C. § 1151). Indian country is a statutory term that includes all lands within an Indian reservation, dependent Indian communities, and Indian trust allotments (18 U.S.C. § 1151). Courts interpret Section 1151 to include all lands held in trust for tribes or their members. (See United States v. Roberts, 185 F.3d 1125 (10th Cir. 1999).) Prior to July 29, 2010, tribal authority to imprison American Indian or Alaska Native offenders had been limited by statute (25 U.S.C. § 1302) to 1 year, a $5,000 fine, or both per offense. On July 29, 2010, the Tribal Law and Order Act of 2010 was signed into law, expanding the sentencing authority of tribal courts. As a result, offenders may serve potentially longer sentences (up to 3 years per offense and up to 9 years per multioffense case) in correctional facilities in Indian country (P.L. 111–211, H.R. 725, 124 Stat. 2258). Tribal law enforcement agencies respond to both felony and misdemeanor crimes. For most of Indian country, the federal government provides felony law enforcement concerning crimes by or against American Indians and Alaska Natives. Certain areas of Indian country are under P.L. 83–280, as amended (commonly referred to as P.L. 280). P.L. 280 conferred jurisdiction over Indian country to certain states and suspended enforcement of the General Crimes Act (18 U.S.C. § 1152) and Major Crimes Act (18 U.S.C. § 1153) in these areas. Tribes retain concurrent jurisdiction to enforce laws in Indian country where P.L. 280 applies. Average length of stay for 2021 The stock-to-flow ratio method was used to measure the average length of stay for inmates held in June 2021. Stock—ADP in June 2021= 2,100 Flow—inmate admissions in June 2021 = 5,780 COVID-19-related item estimation and imputation Number of inmates held on the last weekday of each month from July 1 to December 31, 2020 (figure 2) The number of inmates held on the last weekday of July and August 2020 were imputed for three nonresponding facilities and for one facility that responded to the survey but did not report inmate population. The number of inmates held on the last weekday of each month from September to December 2020 were imputed for three nonresponding facilities and for two facilities that responded to the survey but did not report the inmate population. Nonresponse estimates were calculated by multiplying the estimated confined population on the last weekday in June 2021 by the known percentage change in population between the comparison month and the last weekday in June 2021 (calculated based on facility size category). Number of inmates held on the last weekday in July 2020 (example based on facilities rated to hold 10 to 24 inmates) Number of inmates held on the last weekday in June 2021 for facilities reporting the number of inmates held on the last weekday in July 2020 = 103 Reported number of inmates held on the last weekday in July 2020 = 76 Known percentage change in population between the reported last weekday in July 2020 and the reported last weekday in June 2021 = 0.3553 ((103 – 76) ÷ 76) Number of inmates held on the last weekday in June 2021 for a facility not reporting its population on the last weekday in July 2020 = 13 Estimated number of inmates held on the last weekday in July 2020 for a facility not reporting its population on the last weekday in July 2020 = 9.6 (13 ÷ (0.3553 + 1)) Total estimated number of inmates held on the last weekday in July 2020 = 86 (9.6 + 76). Stock-to-flow ratio in June 2021 = 0.3633 (2,100 ÷ 5,780) Average length of stay (average number of days held in custody from admission to release) = 10.9 days (0.3633 × 30 days). 9For more information on the SJIC universe and survey participation from 2011 to 2014 and in earlier years, see the Jails in Indian Country series on the BJS website. J A I L S I N I N D I A N CO U N T R Y , 2021 , A N D T H E I M PAC T O F CO V I D - 19 , J U LY – D E C E M B E R 2020 | AU G U S T 2022 11 Admissions from July 1 to December 31, 2020 (tables 7 and 8) COVID-19 tests conducted on inmates (example based on facilities rated to hold 10 to 24 inmates) The SJIC did not collect data on the number of jail admissions from July 1 to December 31, 2020. Estimated admissions during this period were calculated by multiplying the number of estimated inmates held on the last weekday of each month from July 1 to December 31, 2020 by the ratio of estimated admissions in June 2021 to the number of estimated inmates held on the last weekday in June 2021. Total number of admissions from July 1 to December 31, 2020 = 2,028 Ratio and estimates for each facility Number of inmates held on the last weekday of each month from July 1 to December 31, 2020 for the example facility = 15 in July, 34 in August, 22 in September, 21 in October, 31 in November, and 37 in December Reported number of COVID-19 tests conducted on inmates from July 1 to December 31, 2020 = 227.0 Admissions in facilities reporting the number of COVID-19 tests conducted on inmates = 2,018 Known ratio of COVID-19 tests conducted on inmates to inmate admissions in facilities reporting the number of COVID-19 tests conducted on inmates = 0.1125 (227.0 ÷ 2,018) Admissions in the facility not reporting on the number of COVID-19 tests conducted on inmates = 10 Number of inmates held on the last weekday in June 2021 for the example facility = 39 Estimated number of COVID-19 tests conducted on inmates = 228.1 ((10 × 0.1125) + 227). Number of admissions in June 2021 for the example facility = 308 The number of positive COVID-19 cases among inmates was imputed for three nonresponding facilities and for two facilities that responded to the survey but did not report positive cases. Nonresponse estimates for positive cases among inmates were calculated by multiplying the total number of COVID-19 tests conducted on inmates from July 1 to December 31, 2020 by the known ratio of positive COVID-19 cases among inmates to COVID-19 tests conducted on inmates. Because ratios varied across facilities, the testing and positive case estimates were calculated based on the total ratio for the facility size category. Ratio of estimated admissions in June 2021 to the number of estimated inmates held on the last weekday in June 2021 for the example facility = 7.9 to 1 (308 ÷ 39) Estimated admission each month from July 1 to December 31, 2020 for the example facility: July = 118 (15 × 7.90) August = 269 (34 × 7.90) September = 174 (22 × 7.90) October = 166 (21 × 7.90) November =245 (31 × 7.90) December = 292 (37 × 7.90) Positive COVID-19 cases among inmates (example based on facilities rated to hold 10 to 24 inmates) Reported number of COVID-19 tests conducted on inmates = 227.0 Total = 1,264. Estimated number of COVID-19 tests conducted on inmates = 228.1 COVID-19 testing and positive cases among inmates from July 1 to December 31, 2020 (table 7) Reported number of positive COVID-19 cases among inmates from July 1 to December 31, 2020 = 14.0 The number of COVID-19 tests conducted on inmates from July 1 to December 31, 2020 were imputed for three nonresponding facilities and for six facilities that responded to the survey but did not report inmate tests. Nonresponse estimates for inmate tests were calculated by multiplying the total number of admissions from July 1 to December 31, 2020 by the known ratio of COVID-19 tests conducted on inmates to inmate admissions. Known ratio of positive COVID-19 cases among inmates to COVID-19 tests conducted on inmates = 0.0617 (14 ÷ 227) Estimated number of COVID-19 tests conducted on inmates in the facility not reporting COVID-19 tests = 1.14 Estimated number of positive COVID-19 cases among inmates = 14.07 ((1.14 × 0.0617) + 14). J A I L S I N I N D I A N CO U N T R Y , 2021 , A N D T H E I M PAC T O F CO V I D - 19 , J U LY – D E C E M B E R 2020 | AU G U S T 2022 12 Expedited releases from Indian country jails from July 1 to December 31, 2020 (table 8) The number of expedited releases of inmates from July 1 to December 31, 2020 were imputed for three nonresponding facilities and for four facilities that responded to the survey but did not report expedited releases. Nonresponse estimates for expedited releases were based on the reported average expedited releases by facility size category. were calculated by multiplying the total number of staff on the last weekday in June 2021 by the known ratio of positive COVID-19 cases among staff to the total number of staff on the last weekday in June. Because ratios varied across facilities, the estimates were calculated based on the total ratio for the facility size category. Positive COVID-19 cases among staff (example based on facilities rated to hold 10 to 24 inmates) Expedited releases (example based on facilities rated to hold 10 to 24 inmates) Number of staff on the last weekday in June 2021 for facilities that reported the number of positive COVID-19 cases among staff from July 1 to December 31, 2020 = 166 Reported number of expedited releases = 1,468 Number of staff in the nonresponding facility = 23 Total number of admissions from July 1 to December 31, 2020 = 1,996 Reported number of positive COVID-19 cases among staff from July 1 to December 31, 2020 = 19 Average expedited releases for reported facilities = 91.75 (1,468 ÷ 16 facilities) Number of nonresponding facilities = 2 Known ratio of positive COVID-19 cases among staff to the total number of staff on the last weekday in June = 0.1145 (19 ÷ 166) Estimated number of expedited releases = 1,652 ((91.75 × 2) + 1,468). Estimated number of positive COVID-19 cases among staff in the nonresponding facility = 2.63 (23 × 0.1145) Positive COVID-19 cases among staff from July 1 to December 31, 2020 (table 10) The number of positive COVID-19 cases among jail staff from July 1 to December 31, 2020 were imputed for three nonresponding facilities and for three facilities that responded to the survey but did not report positive cases. Nonresponse estimates for positive cases among staff Total estimated number of positive COVID-19 cases among staff = 22 (2.63 + 19). For COVID-19-related item estimation and imputation procedures for the first 6 months of 2020, see Jails in Indian Country, 2019–2020 and the Impact of COVID-19 on the Tribal Jail Population (NCJ 300801, BJS, October 2021) at https://bjs.ojp.gov/content/pub/pdf/ jic1920ictjp.pdf. J A I L S I N I N D I A N CO U N T R Y , 2021 , A N D T H E I M PAC T O F CO V I D - 19 , J U LY – D E C E M B E R 2020 | AU G U S T 2022 13 A Facility sizea Total 9 or fewer 10–24 25–49 50 or more Admissionsb 21,190 28 3,040 10,080 8,040 Number of tests conductedc 2,130 11 100 670 1,340 COVID-19 tests conducted on inmates Tests as a percent of admissions Number of positive testsc 10.1% 190 39.3 0 3.3 0 6.6 60 16.7 130 Percent of positive tests 8.9% 0.0 0.0 9.0 9.7 Note: Data were imputed for nonresponse and rounded to the nearest 10, except for the facilities with a rated capacity of nine or fewer beds or inmates. aBased on the rated capacity, which is the maximum number of beds or inmates assigned by a rating official to a facility, excluding separate temporary holding areas. bAdmissions from March 2020 to June 2020 were estimated based on admissions in June 2020 and on the confined population on the last weekday in each month March 2020 to June 2020. See Methodology in Jails in Indian Country, 2019–2020 and the Impact of COVID-19 on the Tribal Jail Population (NCJ 300801, BJS, October 2021). cInmates may be tested more than once and may account for multiple positive tests. See Methodology in Jails in Indian Country, 2019–2020 and the Impact of COVID-19 on the Tribal Jail Population (NCJ 300801, BJS, October 2021). Source: Bureau of Justice Statistics, Annual Survey of Jails in Indian Country, 2020. A Facility sizea Total 9 or fewer 10–24 25–49 50 or more Admissionsb 21,190 28 3,040 10,080 8,040 Expedited releasesc As a percent Number of admissions 2,300 10.9% 6 21.4 210 6.9 1,470 14.6 610 7.6 Note: Data were imputed for nonresponse. Data were rounded to the nearest 10, except for facilities with a rated capacity of nine or fewer beds or inmates. Data were updated from the 2020 report based on a request to facilities in 2021 to revise their expedited release counts from March to June 2020. aBased on the rated capacity, which is the maximum number of beds or inmates assigned by a rating official to a facility, excluding separate temporary holding areas. bEstimated based on admissions in June 2020 and on the confined population on the last weekday of each month from March to May 2020. See Methodology in Jails in Indian Country, 2019–2020 and the Impact of COVID-19 on the Tribal Jail Population (NCJ 300801, BJS, October 2021). cExpedited releases were granted to limit inmate risk and exposure or due to coronavirus-related understaffing, court orders, or legislative mandates. See Methodology in Jails in Indian Country, 2019–2020 and the Impact of COVID-19 on the Tribal Jail Population (NCJ 300801, BJS, October 2021). Source: Bureau of Justice Statistics, Annual Survey of Jails in Indian Country, 2020. A Facility sizea Total 9 or fewer 10–24 25–49 50 or more Facilities at midyear 82 4 21 32 25 Staff at midyearb 1,710 11 240 604 855 Percent of Number of staff who c positive tests tested positive 85 5.0% 0 0.0 6 2.5 31 5.1 48 5.6 Note: Data were imputed for nonresponse and unrounded. aBased on the rated capacity, which is the maximum number of beds or inmates assigned by a rating official to a facility, excluding separate temporary holding areas. bIncludes correctional officers, guards, and other staff who spend more than half of their time supervising inmates, and jail administrators, assistants, and other personnel who work in an administrative capacity more than half of the time. cMultiple positive tests for the same employee were counted only once. The survey collected the number of staff who reported a positive test for COVID-19 but did not capture the total number of staff who were tested for COVID-19 due to potential difficulties in measuring employee testing practices (i.e., tests conducted in jail or on employees’ personal time). See Methodology in Jails in Indian Country, 2019–2020 and the Impact of COVID-19 on the Tribal Jail Population (NCJ 300801, BJS, October 2021). Source: Bureau of Justice Statistics, Annual Survey of Jails in Indian Country, 2020. J A I L S I N I N D I A N CO U N T R Y , 2021 , A N D T H E I M PAC T O F CO V I D - 19 , J U LY – D E C E M B E R 2020 | AU G U S T 2022 14 A Characteristic and year Procedure Sex/age group 2010 No imputed data. 2015 Imputation for 2 facilities was based on their 2014 data. Imputation for 4 facilities was based on their 2013 data. Imputation for 1 facility was based on its 2012 data. 2019 Imputation for 6 facilities was based on their 2018 data. Imputation for 3 facilities was based on their 2017 data. Imputation for 2 facilities was based on their 2013 data. Imputation for 1 facility was based on its 2012 data. Imputation for 1 facility was based on the ratio of the total number of its inmates at midyear 2019 to the reported number of inmates by sex in 2019. Imputation for 1 newly eligible facility was based on the average ratio of the total number of inmates by sex in two other facilities under the same tribal authority, to the reported number of inmates at midyear 2019. 2020 Imputation for 3 facilities was based on their 2019 data. Imputation for 1 facility was based on its 2017 data. Imputation for 1 facility was based on its 2012 data. 2021 Imputation for 1 facility was based on its 2020 data. Imputation for 1 facility was based on its 2017 data. Imputation for 1 facility was based on its 2012 data. Adult age breakout 2021 Imputation for 1 facility was based on the ratio of the total number of its inmates at midyear 2021 to the reported average 2021 adult age breakout for the facility size category. Imputation for 3 facilities was based on the ratio of the total number of their inmates at midyear 2021 to the reported number of inmates by adult age breakout in 2020. Imputation for 3 facilities was based on their 2020 data. Conviction status 2010 Imputation for 14 facilities was based on the ratio of the total number of their inmates at midyear 2010 to the reported number of inmates by conviction status in 2010. 2015 Imputation for 2 facilities was based on their 2014 data. Imputation for 4 facilities was based on their 2013 data. Imputation for 1 facility was based on its 2012 data. 2019 Imputation for 7 facilities was based on their 2018 data. Imputation for 3 facilities was based on their 2017 data. Imputation for 2 facilities was based on their 2013 data. Imputation for 1 facility was based on its 2012 data. Imputation for 1 facility was based on the ratio of the total number of its inmates at midyear 2019 to the reported number of inmates by conviction status in 2019. Imputation for 1 newly eligible facility was based on the average ratio of the total number of inmates by convictions in two other facilities under the same tribal authority, to the reported number of inmates at midyear 2019. 2020 Imputation for 3 facilities was based on their 2019 data. Imputation for 1 facility was based on its 2017 data. Imputation for 1 facility was based on its 2012 data. Imputation for 1 facility was based on the ratio of the total number of its inmates at midyear 2020 to the reported number of inmates by conviction status in 2020. 2021 Imputation for 1 facility was based on its 2020 data. Imputation for 1 facility was based on its 2017 data. Imputation for 1 facility was based on its 2012 data. Most serious offense 2010 Imputation for 3 facilities was based on the ratio of the total number of their inmates at midyear 2010 to the reported number of inmates by offense type in 2010. 2015 Imputation for 2 facilities was based on their 2014 data. Imputation for 4 facilities was based on their 2013 data. Imputation for 1 facility was based on its 2011 data. Imputation for 1 facility was based on the ratio of the total number of its inmates at midyear 2015 to the reported number of inmates by offense type in 2015. Continued on next page J A I L S I N I N D I A N CO U N T R Y , 2021 , A N D T H E I M PAC T O F CO V I D - 19 , J U LY – D E C E M B E R 2020 | AU G U S T 2022 15 appendix Table 4 (continued) Imputation for inmate characteristics in table 6: Inmates held in Indian country jails, by demographic and criminal justice characteristics, midyears 2010, 2015, and 2019–2021 Characteristic and year Procedure 2019 Imputation for 11 facilities was based on their 2018 data. Imputation for 3 facilities was based on their 2017 data. Imputation for 2 facilities was based on their 2013 data. Imputation for 1 facility was based on its 2011 data. Imputation for 7 facilities was based on the ratio of the total number of their inmates at midyear 2019 to the reported number of inmates by offense type in 2019. Imputation for 1 newly eligible facility was based on the average ratio of the total number of inmates by most serious offense in two other facilities under the same tribal authority, to the reported number of inmates at midyear 2019. 2020 Imputation for 3 facilities was based on their 2019 data. Imputation for 1 facility was based on its 2017 data. Imputation for 1 facility was based on its 2011 data. Imputation for 2 facilities was based on the ratio of the total number of their inmates at midyear 2020 to the reported number of inmates by offense type in 2020. Imputation for 2 facilities was based on the ratio of the total number of their inmates at midyear 2020 to the reported number of inmates by offense type in 2019. Imputation for 2 facilities was based on the ratio of the total number of their inmates at midyear 2020 to the reported number of inmates by offense in 2018. 2021 Imputation for 1 facility was based on its 2020 data. Imputation for 1 facility was based on its 2017 data. Imputation for 1 facility was based on its 2012 data. Imputation for 5 facilities was based on the ratio of the total number of their inmates at midyear 2021 to the reported number of inmates by offense in 2021. Note: Imputations were based on the latest data available. Source: Bureau of Justice Statistics, Annual Survey of Jails in Indian Country, 2010, 2015, and 2019–2021. appendix Table 5 Imputation for staff in table 9: Persons employed in Indian country jails, by job function, midyears 2010, 2015, and 2019–2021 Year 2010 2015 2019 2020 2021 Procedure No imputed data. Imputation for 2 facilities was based on their 2014 data. Imputation for 5 facilities was based on their 2012 data. Imputation for 1 facility was based on the ratio of the total number of its staff at midyear 2015 to the reported job function in 2014. Imputation for 7 facilities was based on their 2018 data. Imputation for 3 facilities was based on their 2017 data. Imputation for 1 facility was based on its 2016 data. Imputation for 3 facilities was based on their 2012 data. Imputation for 2 facilities (one adult and one juvenile) was calculated by adjusting the reported 2019 staff to the 2016 adult-tojuvenile staffing ratio. Imputation for 1 newly eligible facility was based on its 2020 data. Imputation for 3 facilities was based on their 2019 data. Imputation for 1 facility was based on its 2017 data. Imputation for 1 facility was based on its 2012 data. Imputation for 2 facilities (one adult and one juvenile) was calculated by adjusting the reported 2020 staff to the 2016 adult-tojuvenile staffing ratio. Imputation for 1 facility was based on its 2020 data. Imputation for 1 facility was based on its 2017 data. Imputation for 1 facility was based on its 2012 data. Source: Bureau of Justice Statistics, Annual Survey of Jails in Indian Country, 2010, 2015, and 2019–2021. J A I L S I N I N D I A N CO U N T R Y , 2021 , A N D T H E I M PAC T O F CO V I D - 19 , J U LY – D E C E M B E R 2020 | AU G U S T 2022 16 The Bureau of Justice Statistics of the U.S. Department of Justice is the principal federal agency responsible for measuring crime, criminal victimization, criminal offenders, victims of crime, correlates of crime, and the operation of criminal and civil justice systems at the federal, state, tribal, and local levels. BJS collects, analyzes, and disseminates reliable statistics on crime and justice systems in the United States, supports improvements to state and local criminal justice information systems, and participates with national and international organizations to develop and recommend national standards for justice statistics. Alexis R. Piquero is the director. This report was written by Todd D. Minton. E. Ann Carson, Ph.D. and Michael B. Field verified the report. David Fialkoff edited the report. Carrie Epps-Carey produced the report. August 2022, NCJ 304631 111111111111111 IIIIII II Ill Ill II Ill NCJ 304631 Office of Justice Programs Building Solutions • Supporting Communities • Advancing Justice www.ojp.gov


