

PEW Infographic on Imprisonment and Crime Rates, 2014
Download original document:
Document text
Document text
This text is machine-read, and may contain errors. Check the original document to verify accuracy.
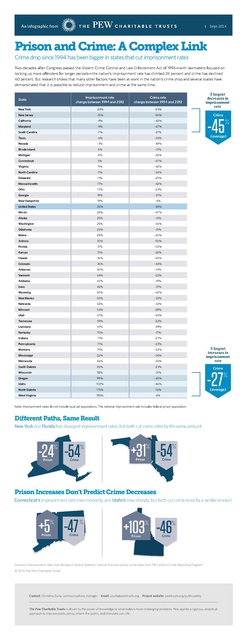
An infographic from

Prison and Crime: A Complex Link
Crime drop since 1994 has been bigger in states that cut imprisonment rates

Two decades after Congress passed the Violent Crime Control and Law Enforcement Act of 1994—with lawmakers focused on
locking up more offenders for longer periods—the nation’s imprisonment rate has climbed 24 percent and crime has declined
40 percent. But research shows that many other factors have been at work in the nation’s crime drop and several states have
demonstrated that it is possible to reduce imprisonment and crime at the same time.
Imprisonment rate
change between 1994 and 2012

State

5 largest
decreases in
imprisonment
rate

Crime rate
change between 1994 and 2012

New York

-24%

-54%

New Jersey

-15%

-50%

California

-9%

-48%

Maryland

-9%

-47%

South Carolina

-7%

-27%

Texas

-6%

-36%

Nevada

-3%

-49%

Rhode Island

4%

-31%

Michigan

4%

-45%

Connecticut

5%

-47%

Virginia

11%

-42%

North Carolina

11%

-34%

Delaware

13%

-20%

Massachusetts

17%

-42%

Ohio

17%

-23%

Georgia

19%

-37%

New Hampshire

19%

-8%

United States

24%

-40%

Illinois

24%

-47%

Alaska

25%

-41%

Washington

25%

-34%

Oklahoma

28%

-31%

Maine

29%

-20%

Arizona

30%

-50%

Florida

31%

-54%

Kansas

31%

-28%

Hawaii

36%

-50%

Colorado

36%

-44%

Arkansas

40%

-14%

Vermont

44%

-22%

Alabama

45%

-19%

Iowa

48%

-31%

Wyoming

50%

-42%

New Mexico

50%

-33%

Nebraska

52%

-32%

Missouri

54%

-29%

Utah

57%

-40%

Tennessee

59%

-22%

Louisiana

61%

-39%

Kentucky

70%

-17%

Indiana

71%

-27%

Pennsylvania

71%

-23%

Montana

75%

-43%

Mississippi

82%

-36%

Minnesota

86%

-36%

South Dakota

86%

-23%

Wisconsin

92%

-31%

Oregon

99%

-45%

Idaho

103%

-46%

North Dakota

175%

-18%

West Virginia

195%

6%

Crime

-45

%

(average)

5 largest
increases in
imprisonment
rate
Crime

-27

%

(average)

Note: Imprisonment rates do not include local jail populations. The national imprisonment rate includes federal prison population.

Different Paths, Same Result
New York and Florida had divergent imprisonment rates, but both cut crime rates by the same amount

54

%

Crime

-24 -54
%

Prison

%

Crime

+31 -54
%

Prison

%

Crime

-24 -54
%

Prison

%

Crime

Prison Increases Don’t Predict Crime Decreases
Connecticut’s imprisonment rate rose modestly, and Idaho’s rose sharply, but both cut crime rates by a similar amount

6

me

Sept 2014

%

+5 -47
%

Prison

Crime

%

+103 -46
%%

Prison

%

Crime

+5 -47
%

Prison

Sources: Imprisonment rates from Bureau of Justice Statistics’ annual Prisoners series; crime rates from FBI Uniform Crime Reporting Program
© 2014 The Pew Charitable Trusts

Contact: Christina Zurla, communications manager  Email: czurla@pewtrusts.org  Project website: pewtrusts.org/publicsafety

The Pew Charitable Trusts is driven by the power of knowledge to solve today’s most challenging problems. Pew applies a rigorous, analytical
approach to improve public policy, inform the public, and stimulate civic life.

Crime

%

