

Piecp Cumulative Data 1979 4th Qtr 10 01-12 31 2007
Download original document:
Document text
Document text
This text is machine-read, and may contain errors. Check the original document to verify accuracy.
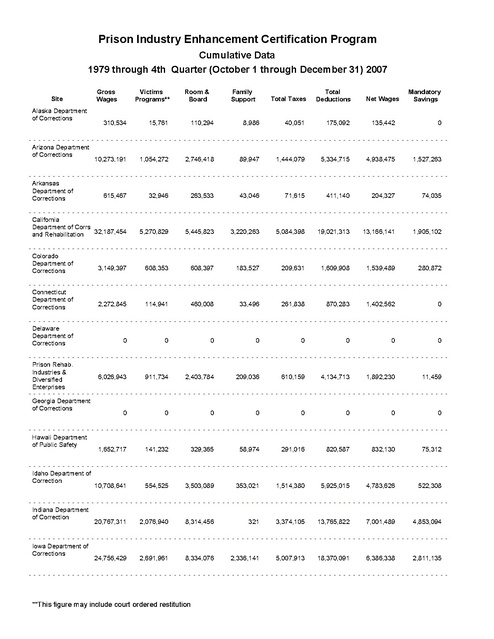
Prison Industry Enhancement Certification Program
Cumulative Data
1979 through 4th Quarter (October 1 through December 31) 2007
Site
Alaska Department
of Corrections

Gross
Wages

Victims
Programs**

Room &
Board

Family
Support

Total Taxes

Total
Deductions

Net Wages

Mandatory
Savings

310,534

15,761

110,294

8,986

40,051

175,092

135,442

0

10,273,191

1,054,272

2,746,418

89,947

1,444,079

5,334,715

4,938,475

1,527,263

615,467

32,946

263,533

43,046

71,615

411,140

204,327

74,035

California
Department of Corrs
32,187,454
and Rehabilitation

5,270,829

5,445,823

3,220,263

5,084,398

19,021,313

13,166,141

1,905,102

Arizona Department
of Corrections

Arkansas
Department of
Corrections

Colorado
Department of
Corrections

3,149,397

608,353

608,397

183,527

209,631

1,609,908

1,539,489

280,872

Connecticut
Department of
Corrections

2,272,845

114,941

460,008

33,496

261,838

870,283

1,402,562

0

Delaware
Department of
Corrections

0

0

0

0

0

0

0

0

6,026,943

911,734

2,403,784

209,036

610,159

4,134,713

1,892,230

11,459

0

0

0

0

0

0

0

0

1,652,717

141,232

329,365

58,974

291,016

820,587

832,130

75,312

10,708,641

554,525

3,503,089

353,021

1,514,380

5,925,015

4,783,626

522,308

20,767,311

2,076,940

8,314,456

321

3,374,105

13,765,822

7,001,489

4,853,094

24,756,429

2,691,961

8,334,076

2,336,141

5,007,913

18,370,091

6,386,338

2,811,135

Prison Rehab.
Industries &
Diversified
Enterprises
Georgia Department
of Corrections

Hawaii Department
of Public Safety

Idaho Department of
Correction

Indiana Department
of Correction

Iowa Department of
Corrections

**This figure may include court ordered restitution

Prison Industry Enhancement Certification Program
Cumulative Data
1979 through 4th Quarter (October 1 through December 31) 2007
Total Taxes

Total
Deductions

209,816

8,461,152

22,940,154

27,588,909

1,617,764

403,088

0

234,038

771,535

736,235

134,170

46,903

183,395

23,580

46,568

300,446

638,240

0

583,519

57,668

175,059

8,458

35,530

276,715

306,804

0

545,465

0

231,877

13,646

4,140

249,663

295,802

0

30,585,429

2,058,003

12,327,656

1,488,175

2,776,455

18,650,289

11,935,140

0

316,405

39,105

106,216

25

25

145,371

171,034

0

785,341

39,267

196,338

59,229

91,963

386,797

398,544

0

313,139

33,462

116,533

22,001

35,574

207,570

105,569

6,111

Nebraska
Department of
Correctional Services 14,026,695

707,496

3,221,059

1,985,684

1,857,896

7,772,135

6,254,560

751,679

21,216,464

1,056,796

5,681,135

417,668

1,897,908

9,053,507

12,162,957

96,550

New Hampshire,
Belknap County
Dept of Corrs

121,555

5,811

41,317

906

15,922

63,957

57,598

0

New Hampshire,
Strafford County
Dept of Corrs

1,276,290

63,676

716,275

1,554

12,389

793,895

482,395

24,699

Site
Kansas Department
of Corrections

Louisiana
Department of
Public Safety and
Corrs
Maine Department
of Corrections

Maryland Division of
Correction

Hennepin County
Adult Correctional
Facility
Minnesota
Department of
Corrections
Mississipi Prison
Industries Corp

Missouri Department
of Corrections

Montana
Department of
Corrections

Nevada Department
of Corrections

Gross
Wages

Victims
Programs**

Room &
Board

50,529,063

2,284,759

11,984,427

1,507,770

134,409

938,687

**This figure may include court ordered restitution

Family
Support

Net Wages

Mandatory
Savings

Prison Industry Enhancement Certification Program
Cumulative Data
1979 through 4th Quarter (October 1 through December 31) 2007
Site
New Mexico
Corrections
Department

Gross
Wages

Victims
Programs**

Room &
Board

Family
Support

Total Taxes

Total
Deductions

Net Wages

Mandatory
Savings

64,358

10,203

0

2,696

5,381

18,280

46,078

0

North Carolina
Department of
Correction

9,146,144

485,573

2,440,346

418,562

1,608,082

4,952,563

4,193,581

0

North Dakota Dept
of Corrs and
Rehabilitation

1,127,354

56,435

495,857

181,638

119,590

853,520

273,834

39,866

83,075

16,598

21,786

93

15,432

53,909

29,166

0

3,793,451

176,301

1,015,911

188,543

561,393

1,942,148

1,851,303

747

10,401,963

515,096

6,098,578

515,489

1,121,028

8,250,191

2,151,773

0

South Carolina
Department of
Corrections

72,551,881

12,359,503

10,289,474

8,480,427

9,454,057

40,583,462

31,968,418

5,363,943

South Dakota
Department of
Corrections

5,685,951

340,945

1,693,574

340,945

862,276

3,237,741

2,448,210

0

5,466,354

274,499

2,818,427

0

30,164

3,123,091

2,343,263

187,998

43,565

2,178

7,908

4,726

7,909

22,721

20,844

0

38,216,022

3,847,000

14,917,432

5,122,080

4,982,631

28,869,143

9,346,878

502,025

5,019,062

261,472

3,257,173

0

496,435

4,015,080

1,003,982

410,461

17,512,188

1,473,364

7,242,742

136,245

306,098

9,158,450

8,353,738

11,246

Ohio Department of
Rehabilitation and
Corrections
Oklahoma
Department of
Corrections
Oregon Department
of Corrections

Tennessee
Rehabilitative
Initiative In Corr.
Board
Texas Red River
County Corrections
Department
Texas Oversight
Authority Board

Utah County
Sheriff's Office

Utah Department of
Corrections

**This figure may include court ordered restitution

Prison Industry Enhancement Certification Program
Cumulative Data
1979 through 4th Quarter (October 1 through December 31) 2007
Gross
Wages

Site
Vermont Department
of Corrections

Victims
Programs**

Room &
Board

Family
Support

Total Taxes

Total
Deductions

Net Wages

Mandatory
Savings

695,017

136,000

211,447

119,494

72,949

539,889

155,128

0

701,344

69,325

344,581

8,288

78,345

500,539

200,805

0

0

0

0

0

0

0

0

0

Washington
Department of
Corrections

35,859,750

2,827,609

7,405,345

1,843,743

5,525,641

17,602,338

18,257,412

465,207

Wisconsin
Department of
Corrections

2,833,676

148,362

1,410,446

99,665

223,980

1,882,453

951,223

0

Wyoming
Department of
Corrections

907,757

78,680

295,332

94,084

114,161

582,256

325,500

122,281

Virginia Department
of Corrections

Washington State
Jail Industries Board

Total

445,575,659

43,079,993

127,869,979

**This figure may include court ordered restitution

28,324,218

58,964,295

258,238,486

187,337,173

21,795,328


