

Is Proposition 47 to Blame for California's 2015 Increase in Urban Crime, CJCJ, 2016
Download original document:
Document text
Document text
This text is machine-read, and may contain errors. Check the original document to verify accuracy.
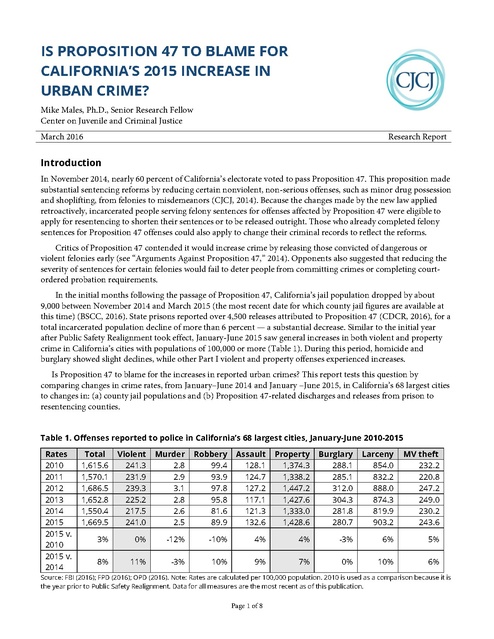
IS PROPOSITION 47 TO BLAME FOR
CALIFORNIA’S 2015 INCREASE IN
URBAN CRIME?
Mike Males, Ph.D., Senior Research Fellow
Center on Juvenile and Criminal Justice
March 2016

Research Report

Introduction
In November 2014, nearly 60 percent of California’s electorate voted to pass Proposition 47. This proposition made
substantial sentencing reforms by reducing certain nonviolent, non-serious offenses, such as minor drug possession
and shoplifting, from felonies to misdemeanors (CJCJ, 2014). Because the changes made by the new law applied
retroactively, incarcerated people serving felony sentences for offenses affected by Proposition 47 were eligible to
apply for resentencing to shorten their sentences or to be released outright. Those who already completed felony
sentences for Proposition 47 offenses could also apply to change their criminal records to reflect the reforms.
Critics of Proposition 47 contended it would increase crime by releasing those convicted of dangerous or
violent felonies early (see “Arguments Against Proposition 47,” 2014). Opponents also suggested that reducing the
severity of sentences for certain felonies would fail to deter people from committing crimes or completing courtordered probation requirements.
In the initial months following the passage of Proposition 47, California’s jail population dropped by about
9,000 between November 2014 and March 2015 (the most recent date for which county jail figures are available at
this time) (BSCC, 2016). State prisons reported over 4,500 releases attributed to Proposition 47 (CDCR, 2016), for a
total incarcerated population decline of more than 6 percent — a substantial decrease. Similar to the initial year
after Public Safety Realignment took effect, January-June 2015 saw general increases in both violent and property
crime in California’s cities with populations of 100,000 or more (Table 1). During this period, homicide and
burglary showed slight declines, while other Part I violent and property offenses experienced increases.
Is Proposition 47 to blame for the increases in reported urban crimes? This report tests this question by
comparing changes in crime rates, from January–June 2014 and January –June 2015, in California’s 68 largest cities
to changes in: (a) county jail populations and (b) Proposition 47-related discharges and releases from prison to
resentencing counties.
Table 1. Offenses reported to police in California’s 68 largest cities, January-June 2010-2015
Rates
2010
2011
2012
2013
2014
2015
2015 v.
2010
2015 v.
2014

Total
1,615.6
1,570.1
1,686.5
1,652.8
1,550.4
1,669.5

Violent
241.3
231.9
239.3
225.2
217.5
241.0

Murder
2.8
2.9
3.1
2.8
2.6
2.5

Robbery
99.4
93.9
97.8
95.8
81.6
89.9

Assault
128.1
124.7
127.2
117.1
121.3
132.6

Property
1,374.3
1,338.2
1,447.2
1,427.6
1,333.0
1,428.6

Burglary
288.1
285.1
312.0
304.3
281.8
280.7

Larceny
854.0
832.2
888.0
874.3
819.9
903.2

MV theft
232.2
220.8
247.2
249.0
230.2
243.6

3%

0%

-12%

-10%

4%

4%

-3%

6%

5%

8%

11%

-3%

10%

9%

7%

0%

10%

6%

Source: FBI (2016); FPD (2016); OPD (2016). Note: Rates are calculated per 100,000 population. 2010 is used as a comparison because it is
the year prior to Public Safety Realignment. Data for all measures are the most recent as of this publication.

Page 1 of 8

Method
This report analyzes several data sources for three separate time periods.
1. Uniform Crime Reports provide urban crime information for January-June of 2014 and 2015, which is
provided to the Federal Bureau of Investigation (FBI) for 66 of California’s cities with populations of
100,000 or more (FBI, 2016). Crime reports for two additional cities (Fresno and Oakland) for the same
period are obtained from city police reports (FPD, OPD, 2016). The reported crime totals for these 68 cities
are divided by the population of each city provided by the Department of Finance (DOF) to produce crime
rates per 100,000 population for January-June of 2014 and 2015.
2. The total 68 cities are located in 22 counties. The Board of State and Community Corrections (BSCC, 2016)
provides figures for Average Daily Population (ADP) in local jails for the 22 relevant counties by offense
type and month through March 2015.
3. The California Department of Corrections and Rehabilitation (CDCR, 2016) provides prison discharges
and releases as a result of Proposition 47 by resentencing county for the November 5, 20141-December 31,
2015 period.

Results
If the reduction in local jail populations after Proposition 47 passed in November 2014 is responsible for the urban
crime increase in early 2015, as some sources are arguing, then cities in counties with the largest reductions in jail
populations in 2015 would show the biggest increases in crime. However, the data suggest this is not the case (Table
2).
In fact, the cities in 11 counties with the largest decreases in both total jail populations and felony jail
populations showed equivalent changes in violent crime, and smaller increases in property and total crime, than the
cities in 10 counties with the smallest decreases in jail populations. In these 11 counties (total urban population 7.4
million) with larger jail population decreases (total average jail ADPs decreased 15 percent, average felony ADPs
dropped 18 percent), the overall crime rate increased by only 1 percent. In the 10 counties (urban population 5.3
million) with smaller jail population decreases (total average jail ADP decreased 7 percent, average felony ADPs
dropped 11 percent), overall crime increased by 6 percent. Both sets of counties experienced violent crime increases
of 9 percent, while the 11 large jail population decrease counties saw no increase in property crime. Significantly,
the 10 smaller jail population decrease counties experienced a six percent increase in property crime. Los Angeles
County (shown separately due to the unreliability of its 2014 crime statistics) had a lesser decrease in total jail ADP
and an average decrease in felony jail ADP, while the city of Los Angeles saw more unfavorable crime trends than
the state as a whole.


1

Proposition 47 took effect on November 4, 2014.
Page 2 of 8

Table 2. Counties ranked by change in jail average daily population (ADP), March 2015 v. March 2014,
and changes in urban crime rates, January-June 2015 v. January-June 2014
Change in Jail ADP
March 2015 v. March 2014

Change in Urban Crime Rates
Jan-June 2015 v. Jan-June 2014

County
Total Felony
Total
Overall average jail population decrease
-11%
-14%
4%
(21 counties, 54 cities)
Smaller than overall average jail population decrease (10 counties)
Riverside (5 cities)
0%
-5%
6%
Sonoma (1 city)
-6%
-11%
8%
Sacramento (2 cities)
-7%
-7%
7%
Fresno (1 city)
-7%
-9%
0%
Solano (2 cities)
-8%
-12%
-3%
Placer (1 city)
-8%
-5%
7%
Ventura (4 cities)
-8%
-22%
7%
San Bernardino (6 cities)
-8%
-8%
6%
Kern (1 city)
-9%
-19%
1%
San Francisco (1 city)
-10%
-10%
22%
Average (10 counties)
-7%
-11%
6%

Larger than overall average jail population decrease (11 counties)
Monterey (1 city)
-12%
n.a.
-8%
Santa Clara (3 cities)
-12%
-20%
5%
Contra Costa (2 cities)
-13%
-11%
-7%
Stanislaus (1 city)
-13%
-17%
5%
Santa Barbara (1 city)
-13%
n.a.
-11%
San Joaquin (1 city)
-15%
-17%
-5%
Tulare (1 city)
-16%
-18%
1%
San Diego (6 cities)
-16%
-18%
0%
San Mateo (2 cities)
-18%
-18%
8%
Orange (8 cities)
-19%
-25%
24%
Alameda (4 cities)
-21%
-18%
1%
Average (11 counties)
-15%
-18%
1%
Los Angeles (14 cities)
-8%
-14%
11%

Violent

Property

9%

3%

7%
2%
23%
12%
-7%
21%
14%
12%
1%
4%
9%

6%
8%
4%
-1%
-2%
6%
6%
5%
1%
25%
6%

25%
3%
-2%
12%
-6%
0%
21%
5%
20%
19%
3%
9%
18%

-14%
5%
-8%
4%
-11%
-7%
-1%
0%
6%
25%
1%
0%
10%

Sources: FBI (2016); BSCC (2016); FPD (2016); OPD (2016). Note: Rates are calculated per populations of 100,000. Los Angeles County is
listed separately due to potential unreliability of 2014 crime statistics. Data for all measures are the most recent as of this publication.

Table 3 compares the rates of discharges and releases from state prisons caused by Proposition 47 by resentencing
county, to changes in urban crime rates in the first half of 2015 for each of the 22 counties. In total, 4,533 people
(over 3 percent of the entire prison population) were either discharged from their sentences (1,120) or released to
parole (3,413) through December 31, 2015, as a result of the proposition, with widely varying numbers of people
returning to each resentencing county. While the resentencing county (which is the same as the original sentencing
county) may not be the county to which a discharged or released person may ultimately go, the assumption is that
most individuals sentenced by a county would return to that county.

Page 3 of 8

The results shown in Table 3 suggest, much like in Table 2, that, at this time, available data does not show a
correlation between Proposition 47 and the total 2015 crime increase. The 10 resentencing counties with the most
per capita discharges/releases as a result of Proposition 47 (averaging 17 prison discharges/releases per 100,000
population) showed much lower increases in their cities’ total Part I crime rates than did those counties less
impacted by Proposition 47 (4.2 discharges/releases). While violent crime did increase in counties with larger than
average Proposition 47-related discharges/releases, overall the experiences of individual cities and counties were too
variable to draw conclusions regarding patterns or causality.
Table 3. Proposition 47 related discharges/releases from state prisons v. change in per-capita urban
crime rates, January-June 2015 v. January-June 2014
Resentencing County (Ranked by Prop.
47 Discharges/Releases

Rate of County’s Prop. 47
Discharges/Releases
Nov. 2014 – Dec. 2015

Absolute Change in County’s
Urban Crime Rates
Jan-June 2015 v. Jan-June 2014
Total
Violent
Property

Overall Average Prop. 47- related
10.3
52.5
discharges/releases
(21 counties, 54 cities)
Smaller than average Prop. 47-related discharges/releases (11 counties)
San Francisco (1 city)
0.7
653.9
Contra Costa (2 cities)
1.4
-157
Alameda (4 cities)
1.5
25.4
San Mateo (2 cities)
2.8
74.8
Sonoma (1 city)
3.2
107.7
Santa Clara (3 cities)
3.7
63.5
Orange (8 cities)
4.7
266
Solano (2 cities)
5.6
-62.9
San Diego (6 cities)
6.8
5.9
Ventura (4 cities)
7.6
87.9
Monterey (1 city)
7.8
-169.4
Average (11 counties)
4.2
81.5

17.7

34.8

15.6
-6.6
11.6
19.8
3.6
4.0
22.0
-23.2
8.9
17.2
76.5
13.6

638.3
-150.4
13.8
55.0
104.1
59.5
244.0
-39.8
-3.0
70.7
-245.8
67.9

Larger than average Prop. 47-related discharges/releases (10 counties)
Placer (1)
8.6
92.3
Santa Barbara (1)
10.3
-195.9
Sacramento (2)
10.5
119.7
San Joaquin (1)
10.7
-158.2
Fresno (1)
15.7
0.5
San Bernardino (6)
15.7
103.1
Tulare (1)
18.5
16.3
Riverside (5)
21.8
80.5
Stanislaus (1)
29.4
130.6
Kern (1 cities)
29.7
17.4
Average (10 counties)
17.0
31.9
Los Angeles (14)
16.0
144.3

16.4
-12.3
63.3
0.1
25.8
27.7
38.0
8.4
51.9
2.3
23.6
38.1

75.9
-183.6
56.4
-158.2
-25.3
75.4
-21.7
72.2
78.7
15.1
8.3
106.2

Source: CDCR (2016); FBI (2016); FPD (2016); OPD (2016). Note: Per-capita rates are calculated per 100,000 population in cities and in
counties. Los Angeles County is listed separately due to potential unreliability of 2014 crime statistics. Data for all measures are the most
recent as of this publication.

Page 4 of 8

Conclusion
There are no obvious effects associated with Proposition 47 that would be expected if the reform had a significant
and consistent impact on crime. In fact, many cities in counties that experienced larger declines in local and state
incarcerated populations after Proposition 47 took effect had more favorable crime trends.
It is too early to conclusively measure the effects of Proposition 47 on crime rates just one year after the law
took effect. The urban crime increase in the first half of 2015 could be a normal fluctuation, such as those that
occurred from 1999 to 2001 or from 2005 to 2006 (CJSC, 2016). Initial trends are often reversed later. In the case of
Realignment, implemented in 2011, crime initially increased in 2012, but later declined sharply in 2013 and 2014.
Finally, the counties that show the largest jail and prison population decreases as well as more favorable
municipal crime trends (such as in Contra Costa, San Joaquin, and Santa Barbara) can be further examined for
potential model practices. While more data are necessary to determine the impacts of Proposition 47, close analysis
of the variability in local experiences over a longer time period will yield valuable information as to what works in
reducing both incarcerated populations and crime.

References
Board of State and Community Corrections (BSCC). (2016). Jail profile survey – online querying. At:
https://app.bscc.ca.gov/joq//jps/QuerySelection.asp
California Department of Corrections and Rehabilitation (CDCR). (2016). Prop. 47 summary tracking exits from
prison by county from November 5, 2014 to December 31, 2015. Special data request provided by CDCR to
Californians for Safety and Justice.
Center on Juvenile and Criminal Justice (CJCJ). (2014). Proposition 47: Estimating Local Savings And Jail
Population Reductions. At: http://www.cjcj.org/uploads/cjcj/documents/proposition_47 _county_estimates.pdf
Criminal Justice Statistics Center (CJSC)(2016). CJSC statistics: Crimes and clearances. California Department of
Justice. At:	https://oag.ca.gov/crime/cjsc/stats/crimes-clearances
Federal Bureau of Investigation (FBI). (2016). Preliminary semiannual uniform crime report. January-June 2015.
At: https://www.fbi.gov/about-us/cjis/ucr/crime-in-the-u.s/2015/preliminary-semiannual-uniform-crimereport-januaryjune-2015/home
Fresno Police Department (FPD). (2016). Uniform Crime Reports. At: http://www.fresno.gov/Government/
DepartmentDirectory/Police/AboutFresnoPD/CrimeReportsandStatistics/MonthlyCrimeStatistics.htm and by
special request to the Fresno Police Department.
Oakland Police Department (OPD). (2016). Uniform Crime Reports. At: http://www2.oaklandnet.com/
Government/o/OPD/s/Statistics/
Official Voter Information Guide, California Secretary of State (SOS). (2014). Arguments Against Proposition 47.
At: https://www.post.ca.gov/Data/Sites/1/post_docs/resources/Prop47/OfficialVoterInformation
GuideCaliforniaSecretaryofState.pdf

Please note: Jurisdictions submit their data to the official statewide or national databases maintained by appointed
governmental bodies. While every effort is made to review data for accuracy and to correct information upon revision, CJCJ
cannot be responsible for data reporting errors made at the county, state, or national level.
Contact: For more information about this topic or to schedule an interview, please contact CJCJ Communications at (415) 6215661 x 121 or cjcjmedia@cjcj.org.

Page 5 of 8

Appendix
Of the 68 reporting cities, 48 showed increases, three showed no change, and 17 showed decreases in reported crime
rates.
Appendix 1. Changes in reported crime rates in California’s 68 largest cities, January-June 2015 v.
January-June 2014
Change
City
All Cities

County

Berkeley

Alameda

Fremont
Hayward
Oakland**

--

Total

Violent

Jan-June 2015
Property

Total

Jan-June 2014

Violent

Property

Total

Violent

Property

8%

11%

7%

1,669.5

241.0

1,428.6

1,550.4

217.5

1,333.0

22%

49%

20%

2,675.5

226.5

2,449.1

2,189.4

152.5

2,036.9

Alameda

4%

24%

3%

1,022.3

63.6

958.7

985.2

51.3

933.9

Alameda

-2%

1%

-3%

1,721.5

192.3

1,529.2

1,761.7

191.3

1,570.4

-2%

0%

-3%

3,771.5

761.8

3,009.7

3,862.4

764.8

3,097.6

-10%

-9%

-11%

2,140.4

357.3

1,783.0

2,390.1

392.7

1,997.4

-4%

10%

-5%

2,068.7

191.2

1,877.5

2,146.8

173.6

1,973.2

Fresno**

Alameda
Contra
Costa
Contra
Costa
Fresno

0%

12%

-1%

2,284.1

249.3

2,034.8

2,283.6

223.6

2,060.1

Bakersfield

Kern

1%

1%

1%

2,334.7

237.9

2,096.9

2,317.3

235.6

2,081.8

Burbank

Los Angeles

1%

-2%

1%

1,273.5

65.0

1,208.5

1,263.3

66.3

1,197.0

Downey*

Los Angeles

-6%

2%

-6%

1,322.2

131.7

1,190.5

1,401.9

128.7

1,273.2

El Monte*

Los Angeles

1%

11%

-1%

1,081.4

168.4

913.0

1,074.5

151.1

923.4

Glendale*

Los Angeles

6%

9%

6%

897.7

47.7

850.0

845.8

43.9

801.9

Inglewood*

Los Angeles

-5%

-3%

-6%

1,450.2

308.9

1,141.2

1,531.6

319.2

1,212.4

Lancaster

Los Angeles

3%

4%

2%

1,360.8

299.2

1,061.7

1,324.1

287.0

1,037.2

Long Beach

Los Angeles

12%

19%

11%

1,718.6

277.5

1,441.1

1,534.0

232.9

1,301.1

Los Angeles

Los Angeles

15%

23%

13%

1,419.7

273.3

1,146.4

1,236.5

222.3

1,014.3

Norwalk

Los Angeles

-3%

13%

-6%

1,060.0

181.0

879.0

1,093.9

160.3

933.6

Palmdale

Los Angeles

2%

-2%

3%

1,271.3

258.6

1,012.7

1,241.9

262.6

979.2

Pasadena*

Los Angeles

11%

17%

10%

1,522.9

144.2

1,378.7

1,377.1

123.4

1,253.6

Pomona*

Los Angeles

4%

0%

5%

1,785.2

262.4

1,522.8

1,712.3

263.5

1,448.8

Torrance*
West
Covina
Salinas

Los Angeles

18%

62%

16%

1,025.4

70.1

955.4

867.5

43.3

824.2

5%

14%

5%

1,458.5

111.6

1,346.9

1,386.7

98.3

1,288.5

Monterey

-8%

25%

-14%

1,906.7

380.7

1,526.0

2,076.0

304.2

1,771.8

Anaheim*

Orange

18%

16%

18%

1,606.6

178.7

1,427.9

1,361.5

154.1

1,207.3

Costa Mesa

Orange

39%

45%

38%

2,231.7

164.8

2,066.9

1,611.3

113.6

1,497.7

Fullerton*
Garden
Grove*
Huntington
Beach

Orange

17%

18%

17%

1,501.0

136.8

1,364.1

1,285.3

116.3

1,169.0

40%

26%

42%

1,410.4

152.8

1,257.6

1,006.7

121.3

885.4

10%

-8%

11%

1,293.4

89.7

1,203.7

1,179.0

97.4

1,081.6

Irvine*

Orange

25%

1%

26%

800.8

22.4

778.4

638.3

22.3

616.0

Orange*

Orange

33%

24%

34%

1,140.7

68.5

1,072.1

856.6

55.3

801.3

Santa Ana*

Orange

28%

24%

28%

1,309.7

230.6

1,079.1

1,026.5

186.2

840.3

Roseville

Placer

7%

21%

6%

1,358.4

95.8

1,262.6

1,266.2

79.4

1,186.8

Corona
Moreno
Valley
Murrieta

Riverside

3%

3%

3%

1,177.3

58.0

1,119.2

1,145.1

56.6

1,088.6

0%

13%

-1%

1,687.8

140.5

1,547.3

1,692.3

124.5

1,567.8

Riverside

34%

98%

32%

953.6

39.2

914.4

710.6

19.7

690.8

Riverside

Riverside

5%

2%

5%

1,773.7

214.0

1,559.7

1,691.5

209.4

1,482.1

Antioch
Concord

Los Angeles

Orange
Orange

Riverside

Page 6 of 8

Change
City
Temecula

County

Elk Grove

Sacramento

Sacramento

Carlsbad

Sacramento
San
Bernardino
San
Bernardino
San
Bernardino
San
Bernardino
San
Bernardino
San
Bernardino
San Diego

Chula Vista

San Diego

El Cajon

Jan-June 2015

Property

1,281.8

41.4

1,240.4

1,083.9

196.0

887.9

1,678.0

1,912.7

306.8

1,605.9

187.9

1,055.7

1,083.6

181.2

902.4

1,662.0

155.8

1,506.1

1,457.8

138.1

1,319.7

1%

1,150.7

55.7

1,095.0

1,159.3

75.5

1,083.8

27%

-12%

1,201.9

202.8

999.1

1,293.8

159.9

1,133.9

11%

15%

10%

2,932.2

571.7

2,360.6

2,642.2

497.7

2,144.6

-7%

20%

-10%

1,867.7

307.0

1,560.6

1,997.8

254.8

1,743.0

11%

-13%

14%

1,008.6

79.5

929.0

905.4

91.9

813.5

-5%

8%

-7%

979.9

123.3

856.6

1,033.7

114.2

919.5

San Diego

-7%

-16%

-5%

1,257.8

155.8

1,102.1

1,351.4

186.1

1,165.3

Escondido

San Diego

1%

10%

0%

1,294.0

183.3

1,110.7

1,276.4

167.0

1,109.4

Oceanside

San Diego

9%

-8%

11%

1,438.1

182.3

1,255.8

1,324.4

197.9

1,126.5

San Diego
San
Francisco
Stockton

San Diego
San
Francisco
San Joaquin

0%

8%

-1%

1,214.9

208.0

1,007.0

1,212.9

192.2

1,020.7

22%

4%

25%

3,601.5

408.3

3,193.1

2,947.5

392.7

2,554.8

-5%

0%

-7%

2,742.0

657.7

2,084.4

2,900.2

657.6

2,242.6

Daly City

San Mateo

19%

31%

17%

1,036.8

124.8

912.0

872.2

95.1

777.1

San Mateo

-2%

9%

-3%

1,079.6

116.3

963.2

1,099.1

106.8

992.3

-11%

-6%

-11%

1,645.7

209.6

1,436.0

1,841.5

221.9

1,619.6

San Jose

San Mateo
Santa
Barbara
Santa Clara

4%

3%

4%

1,418.3

167.2

1,251.1

1,365.1

162.5

1,202.6

Santa Clara

Santa Clara

11%

3%

12%

1,592.9

65.3

1,527.6

1,430.4

63.7

1,366.8

Sunnyvale

Santa Clara

6%

-1%

7%

884.3

52.7

831.6

832.2

53.2

779.0

Fairfield

Solano

-8%

-12%

-8%

1,774.9

220.8

1,554.2

1,931.4

250.3

1,681.1

Vallejo
Santa
Rosa*
Modesto

Solano

1%

-4%

2%

2,465.7

419.4

2,046.2

2,439.5

436.0

2,003.4

8%

2%

8%

1,516.7

180.3

1,336.4

1,409.0

176.6

1,232.4

Stanislaus

5%

12%

4%

2,791.8

469.9

2,321.9

2,661.2

418.0

2,243.1

Visalia

Tulare

1%

21%

-1%

1,718.5

218.0

1,500.5

1,702.2

179.9

1,522.2

Oxnard

Ventura

9%

-2%

10%

1,823.0

216.3

1,606.6

1,678.3

219.7

1,458.7

Simi Valley*
Thousand
Oaks
Ventura

Ventura

7%

66%

3%

698.9

65.6

633.3

656.0

39.6

616.4

3%

-6%

4%

691.9

50.3

641.7

669.3

53.5

615.8

5%

61%

2%

1,958.1

179.3

1,778.9

1,857.1

111.1

1,745.9

Fontana
Ontario
Rancho
Cucamonga
Rialto
San
Bernardino
Victorville

Santa Maria

Sonoma

Ventura
Ventura

Violent

Property

11%

13%

11%

4%

-7%

6%

8%

24%

15%

Total

Jan-June 2014
Violent

Riverside

Total

Violent

Property

1,426.7

46.8

1,379.9

1,126.5

181.7

944.8

4%

2,059.1

381.2

4%

17%

1,243.7

14%

13%

14%

-1%

-26%

-7%

Total

Source: FBI (2016); FPD (2016) OPD (2016). Note: Rape is not included. Due to expanded definition of rape in 2014, the California
Department of Justice has recommended that rape comparisons should not be drawn at this time. Cities marked with a “*” did not report
rape in both old and new definitions, preventing year-to-year comparison. Cities marked with “**” were not included in the FBI Unified
Crime Reports; information above was obtained through city police reports. Rates are calculated per 100,000 populations. Data for all
measures are the most recent as of this publication.

Page 7 of 8

Appendix 2. Counties listed alphabetically including data over all three time periods
County

Change in Jail ADP
March 2015 v. March 2014
Total

Alameda
(4 cities)
Contra Costa
(2 cities)
Fresno
(1 city)
Kern
(1 city)
Los Angeles
(14 cities)
Monterey
(1 city)
Orange
(8 cities)
Placer
(1 city)
Riverside
(5 cities)
Sacramento
(2 cities)
San
Bernardino
(6 cities)
San Diego
(6 cities)
San Francisco
(1 city)
San Joaquin
(1 city)
San Mateo
(2 cities)
Santa
Barbara
(1 city)
Santa Clara
(3 cities)
Solano
(2 cities)
Sonoma
(1 city)
Stanislaus
(1 city)
Tulare
(1 city)
Ventura
(4 cities)

Felony

Rate of County’s
Prop. 47 Discharges/Releases
Nov. 2014 – Dec. 2015

Change in Urban Crime Rates
January-June, 2015 v.2014
Total

Violent

Property

-21%

-18%

1.5

1%

3%

1%

-13%

-11%

1.4

-7%

-2%

-8%

-7%

-9%

15.7

0%

12%

-1%

-9%

-19%

29.7

1%

1%

1%

-8%

-14%

16

11%

18%

10%

-12%

n.a.

7.8

-8%

25%

-14%

-19%

-25%

4.7

24%

19%

25%

-8%

-5%

8.6

7%

21%

6%

0%

-5%

21.8

6%

7%

6%

-7%

-7%

10.5

7%

23%

4%

-8%

-8%

15.7

6%

12%

5%

-16%

-18%

6.8

0%

5%

0%

-10%

-10%

0.7

22%

4%

25%

-15%

-17%

10.7

-5%

0%

-7%

-18%

-18%

2.8

8%

20%

6%

-13%

n.a.

10.3

-11%

-6%

-11%

-12%

-20%

3.7

5%

3%

5%

-8%

-12%

5.6

-3%

-7%

-2%

-6%

-11%

3.2

8%

2%

8%

-13%

-17%

29.4

5%

12%

4%

-16%

-18%

18.5

1%

21%

-1%

-8%

-22%

7.6

7%

14%

6%

Source: BSCC (2016); CDCR (2016); FBI (2016); FPD (2016) OPD (2016). Note: Rates are calculated per 100,000 population. Data for all
measures are the most recent as of this publication.

Page 8 of 8


