

Publicly Funded Forensic Crime Laboratories - Resources and Services 2014, DOJ BJS, 2016
Download original document:
Document text
Document text
This text is machine-read, and may contain errors. Check the original document to verify accuracy.
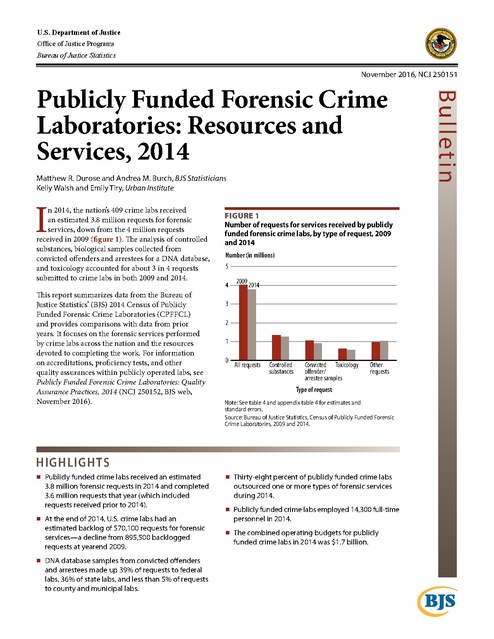
U.S. Department of Justice Office of Justice Programs Bureau of Justice Statistics November 2016, NCJ 250151 Matthew R. Durose and Andrea M. Burch, BJS Statisticians Kelly Walsh and Emily Tiry, Urban Institute I n 2014, the nation’s 409 crime labs received an estimated 3.8 million requests for forensic services, down from the 4 million requests received in 2009 (figure 1). The analysis of controlled substances, biological samples collected from convicted offenders and arrestees for a DNA database, and toxicology accounted for about 3 in 4 requests submitted to crime labs in both 2009 and 2014. This report summarizes data from the Bureau of Justice Statistics’ (BJS) 2014 Census of Publicly Funded Forensic Crime Laboratories (CPFFCL) and provides comparisons with data from prior years. It focuses on the forensic services performed by crime labs across the nation and the resources devoted to completing the work. For information on accreditations, proficiency tests, and other quality assurances within publicly operated labs, see Publicly Funded Forensic Crime Laboratories: Quality Assurance Practices, 2014 (NCJ 250152, BJS web, November 2016). Figure 1 Number of requests for services received by publicly funded forensic crime labs, by type of request, 2009 and 2014 Number (in millions) 5 4 2009 2014 3 2 1 0 All requests Controlled substances Convicted Toxicology offender/ arrestee samples Other requests Type of request Note: See table 4 and appendix table 4 for estimates and standard errors. Source: Bureau of Justice Statistics, Census of Publicly Funded Forensic Crime Laboratories, 2009 and 2014. HIGHLIGHTS Publicly funded crime labs received an estimated 3.8 million forensic requests in 2014 and completed 3.6 million requests that year (which included requests received prior to 2014). At the end of 2014, U.S. crime labs had an estimated backlog of 570,100 requests for forensic services—a decline from 895,500 backlogged requests at yearend 2009. DNA database samples from convicted offenders and arrestees made up 39% of requests to federal labs, 36% of state labs, and less than 5% of requests to county and municipal labs. Thirty-eight percent of publicly funded crime labs outsourced one or more types of forensic services during 2014. Publicly funded crime labs employed 14,300 full-time personnel in 2014. The combined operating budgets for publicly funded crime labs in 2014 was $1.7 billion. Bul l etin Publicly Funded Forensic Crime Laboratories: Resources and Services, 2014 Publicly funded forensic crime labs examine and report on physical evidence collected during criminal investigations for federal, state, and local jurisdictions. Crime labs perform a variety of forensic analyses and receive requests for these services from criminal justice agencies, such as police departments, prosecutors offices, courts, and correctional facilities. The ability of a lab to handle its forensic workload depends on many factors, including the complexity of the procedures and the availability of analysts and other resources. Most crime labs provided forensic services in multiple disciplines Publicly funded crime labs provided an average of five different forensic functions in 2014 (not shown) (See Methodology for definitions of forensic functions.) Since 2002, crime labs most commonly performed analyses of controlled substances. Eighty-one percent of crime labs handled the identification of illegal drugs and other controlled substances in 2014 (table 1). Among crime labs that processed controlled substances, 9 in 10 analyzed synthetic cannabinoids (e.g., Spice or K2) and synthetic cathinones (e.g., bath salts) in 2014 (not shown). Sixty-two percent of crime labs analyzed biological samples, such as blood and saliva, during 2014. Sixty-one percent analyzed forensic biology collected during criminal casework from crime scenes, victims, or suspects, and 16% analyzed biological samples collected from convicted offenders and arrestees for inclusion in a local, state, or national DNA database (not shown). Crime labs enter DNA profiles from criminal casework, convicted offenders, and arrestees into the FBI’s Combined DNA Index System (CODIS). CODIS software allows crime labs to compare biological evidence collected from criminal investigations to DNA profiles stored in a database for the purpose of linking serial crimes together and identifying suspects. All 50 states, the District of Columbia, and the federal government require offenders convicted of certain crimes to provide DNA samples. Some jurisdictions Table 1 Functions performed by publicly funded forensic crime labs, 2002, 2005, 2009, and 2014 Forensic function Controlled substances Crime scene Digital evidence Firearms/toolmarks Forensic biology* Impressions Latent prints Questioned documents Toxicology Trace evidence Number of labs 2002 89% 60 12 60 65 … 59 24 46 56 351 2005 89% 39 15 57 61 50 57 20 50 54 389 2009 81% 52 19 54 59 44 60 16 42 50 411 2014 81% 52 22 55 62 40 63 14 43 48 409 Note: See appendix table 1 for standard errors. …Not available. *Includes forensic biology from either criminal casework or convicted offenders and arrestees for a DNA database. Source: Bureau of Justice Statistics, Census of Publicly Funded Forensic Crime Laboratories, 2002, 2005, 2009, and 2014. must also collect DNA from certain arrestees. In 2014, state labs (25%) were more likely than county (9%) and municipal (4%) labs to analyze biological samples collected from convicted offenders and arrestees for a DNA database (table 2). Among crime labs that handled forensic biology requests in 2014, 15% conducted familial searching of a DNA database for the purpose of identifying close biological relatives to an unknown DNA profile collected from a crime scene (not shown). Three percent of crime labs that performed forensic biology services in 2014 reported using a Rapid DNA instrument, which provided a fully automated method to develop a DNA profile for a database. The majority (63%) of crime labs analyzed latent (or hidden) fingerprints recovered from crime scenes. About 8 in 10 (82%) of these labs used the FBI’s Integrated Automated Fingerprint Identification System to perform latent fingerprint comparisons in 2014 (not shown). Overall, nearly half (48%) of crime labs examined trace evidence in 2014. Among these crime labs, 70% performed fire debris analysis, 44% conducted hair examinations, and 38% analyzed gunshot residue (table 3). Table 2 Functions performed by publicly funded forensic crime labs, by type of jurisdiction, 2014 Forensic function Controlled substances Crime scene Digital evidence Firearms/toolmarks Forensic biology casework Forensic biology from convicted offender/arrestee samples Impressions Latent prints Questioned documents Toxicology Trace evidence Number of labs Federal 55% 42 54 27 27 12 26 67 34 9 57 39 State 87% 48 10 58 71 25 43 53 12 48 53 193 County Municipal 86% 71% 51 75 20 36 60 58 68 42 9 46 62 12 52 50 98 4 35 88 14 36 29 79 Note: See appendix table 2 for standard errors. Source: Bureau of Justice Statistics, Census of Publicly Funded Forensic Crime Laboratories, 2014. Table 3 Percent of publicly funded forensic crime labs that examined trace evidence, by type of examination, 2009 and 2014 Trace evidence Explosives analysis Fiber examination Fire debris analysis Gunshot residue Hair examination Paint analysis Unknown chemical Number of labs that examined trace evidence 2009 32% 60 72 36 50 59 62 204 2014 32% 52 70 38 44 52 63 197 Note: Percentages based on labs that examined trace evidence. See appendix table 3 for standard errors. Source: Bureau of Justice Statistics, Census of Publicly Funded Forensic Crime Laboratories, 2009 and 2014. P U B L I C LY F U N D E D F O R E N S I C C R I M E L A B O R ATO R I E S : R E S O U R C E S A N D S E R V I C E S , 2014 | N O V E M B E R 2016 2 Crime labs received nearly 4 million requests for forensic services in 2014 More than half of all requests for forensic services were sent to state labs Crime labs play a critical role in the justice system, analyzing millions of pieces of evidence from criminal investigations each year. A criminal case may generate more than one type of request to process or analyze evidence. For example, a crime lab may receive fingerprints and DNA evidence from the same case, which requires two separate requests for analysis by different sections of the lab. In 2014, more than half (2.2 million) of the estimated 3.8 million requests for forensic services received by publicly funded crime labs nationwide were submitted to state labs (table 5). Labs serving county and municipal jurisdictions received 1.4 million forensic requests in 2014. Table 5 Percent of requests for services received by publicly funded forensic crime labs, by type of jurisdiction, 2014 The CPFFCL asked labs to provide the total number of requests received and completed within their facility for each forensic service. Completed requests included those received prior to and during 2014. Submitting agencies sometimes canceled requests before labs completed them because services were no longer needed (e.g., law enforcement solved or closed the case). The CPFFCL defined a pending forensic request as backlogged if it was not completed within 30 days. Type of request Federal All requests 100% Controlled substances 27 Crime scene -Digital evidence 2 Firearms/toolmarks -Forensic biology casework 2 Forensic biology from convicted offender/arrestee samples 39 Impressions -Latent prints 24 Questioned documents 1 Toxicology 4 Trace evidence 1 Total requests received* 254,000 In 2014, the nation’s 409 crime labs received an estimated 3.8 million new requests for forensic services and completed 3.6 million requests (table 4). About three-quarters of requests received in 2014 were for either analysis of controlled substances (33%), biological samples collected from convicted offenders and arrestees for a database of DNA profiles (24%), and toxicology (15%). Forensic biology casework accounted for a larger proportion of the overall number of requests received in 2014 (9%) than in 2009 (6%). State 100% 33 --3 9 County 100% 40 9 -5 9 Municipal 100% 31 17 3 10 13 36 -4 -14 1 2,164,000 1 -10 -25 2 775,000 4 -12 -9 1 589,000 Note: Detail does not sum to total due to rounding. See appendix table 5 for standard errors. --Less than 0.5%. *Rounded to the nearest thousand. Source: Bureau of Justice Statistics, Census of Publicly Funded Forensic Crime Laboratories, 2014. Table 4 Requests for services received and completed by publicly funded forensic crime labs, by type of request, 2009 and 2014 Received 2009 Type of request All requests Controlled substances Crime scene Digital evidence Firearms/toolmarks Forensic biology casework Forensic biology from convicted offender/arrestee samples Impressions Latent prints Questioned documents Toxicology Trace evidence Completed 2014 Number 4,020,000 1,358,000 188,000 33,000 147,000 260,000 Percent 100% 34 5 1 4 6 1,053,000 11,000 270,000 13,000 629,000 58,000 26 -7 -16 1 Number 3,783,000 1,265,000 171,000 25,000 154,000 333,000 908,000 7,000 295,000 9,000 566,000 49,000 2009 2014 Percent 100% 33 5 1 4 9 Number 3,830,000 1,261,000 188,000 33,000 132,000 239,000 Percent 100% 33 5 1 3 6 Number 3,646,000 1,197,000 170,000 24,000 142,000 296,000 Percent 100% 33 5 1 4 8 24 -8 -15 1 1,027,000 11,000 274,000 12,000 606,000 47,000 27 -7 -16 1 904,000 7,000 301,000 9,000 554,000 41,000 25 -8 -15 1 Note: Totals exclude requests outsourced to other labs. The number of requests completed in 2009 and 2014 exceeded the number of requests received during that year for certain disciplines because the completed requests included some requests received prior to that year. Numbers are rounded to the nearest thousand. Detail does not sum to total due to rounding. See appendix table 4 for standard errors. --Less than 0.5%. Source: Bureau of Justice Statistics, Census of Publicly Funded Forensic Crime Laboratories, 2009 and 2014. P U B L I C LY F U N D E D F O R E N S I C C R I M E L A B O R ATO R I E S : R E S O U R C E S A N D S E R V I C E S , 2014 | N O V E M B E R 2016 3 The composition of the forensic work handled by U.S. crime labs during 2014 varied among those serving federal, state, county, and municipal jurisdictions. Toxicology requests accounted for 25% of the requests received by county labs, compared to less than 10% received by federal and municipal labs. In comparison, biological samples collected from convicted offenders and arrestees for a database of DNA profiles comprised 39% of requests made to federal labs and 36% of requests to state labs, compared to less than 5% of requests to county (1%) and municipal (4%) labs. Crime scene investigations accounted for 17% of requests made to municipal labs, compared to 9% of requests to county labs and less than 1% of requests to state and federal labs. Publicly funded crime labs had a backlog of 570,100 requests for forensic services at yearend 2014, down from 895,500 backlogged requests at yearend 2009 (table 6). Biological samples collected from convicted offenders or arrestees for a DNA database that were backlogged decreased from 502,500 at yearend 2009 to 64,800 at yearend 2014. The FBI crime lab reported the majority of these backlogged requests in 2009 because of an increase in the collection of DNA samples as mandated by federal legislation. Since 2009, the FBI crime lab has reduced its backlog of requests for DNA samples taken from convicted offenders and arrestees. The overall reduction in DNA samples led to a decline in the overall number of backlogged requests within U.S. crime labs observed at yearend 2009. The DNA samples collected from convicted offenders and arrestees for a database of DNA profiles made up 11% of all backlogged requests at yearend 2014. Forensic biology casework samples accounted for 19% of the overall backlog at yearend 2014. The CPFFCL asked labs about requests to process forensic biology from sexual assault cases. Not all labs that handled forensic biology requests were able to separately report how Table 6 Requests for services backlogged in publicly funded forensic crime labs, by type of request, yearend 2009 and 2014 2009 Number Percent 895,500 100% 139,200 16 1,600 -48,300 5 103,500 12 Type of request All requests Controlled substances Digital evidence Firearms/toolmarks Forensic biology casework Forensic biology from convicted offender/arrestee samples 502,500 Impressions 6,100 Latent prints 49,500 Questioned documents 2,600 Toxicology 27,600 Trace evidence 14,700 56 1 6 -3 2 2014 Number Percent 570,100 100% 213,700 37 7,800 1 51,100 9 107,800 19 64,800 2,400 69,400 800 40,000 12,200 11 -12 -7 2 Note: A request is classified as backlogged if it was not examined and reported to the submitting agency within 30 days of submission. Totals exclude requests outsourced to other labs. Numbers are rounded to the nearest hundred. Detail does not sum to total due to rounding. See appendix table 6 for standard errors. --Less than 0.5%. Source: Bureau of Justice Statistics, Census of Publicly Funded Forensic Crime Laboratories, 2009 and 2014. many received, completed, or backlogged requests were from sexual assault cases. In the 2014 CPFFCL, 135 labs reported receiving an estimated 45,000 requests to process sexual assault evidence during 2014 and completed about 43,000 of these types of requests that year (not shown). The requests completed in 2014 included evidence collected before and during 2014. At yearend 2014, 128 crime labs reported approximately 9,000 backlogged requests to process sexual assault evidence. About 4 in 10 labs outsourced some forensic work in 2014 To address the demands for forensic services, some publicly funded crime labs outsourced work to private labs or other public facilities. Thirty-eight percent of publicly funded crime labs outsourced one or more types of forensic services in 2014, up from 28% in 2009 (table 7). During 2014, municipal labs (60%) were more likely than federal (28%) and state (23%) labs to outsource requests for services. Publicly funded crime labs that outsourced requests to private or other public labs in 2014 were most likely to outsource toxicology analysis (68%) and forensic biology casework (55%) (table 8). Table 7 Percent of publicly funded forensic crime labs that outsourced requests for services, by type of jurisdiction, 2002, 2005, 2009, and 2014 Type of jurisdiction All labs Federal State County Municipal Number of labs 2002 40% 17 31 61 64 351 2005* 47% ^ 39 68 57 389 2009 28% 20 23 40 32 411 2014 38% 28 23 54 60 409 Note: See appendix table 7 for standard errors. ^Too few cases to provide a reliable estimate. *Total includes federal labs, not shown separately. Source: Bureau of Justice Statistics, Census of Publicly Funded Forensic Crime Laboratories, 2002, 2005, 2009, and 2014. Table 8 Percent of publicly funded crime labs that outsourced requests for services, by type of service, 2014 Type of request Controlled substances Digital evidence Firearms/toolmarks Forensic biology casework Forensic biology from convicted offender/arrestee samples Impressions Latent prints Questioned documents Toxicology Trace evidence Number of labs that outsourced requests Percent 19% 15 25 55 37 16 10 24 68 37 155 Note: Percentages based on labs that performed the forensic service and outsourced requests. See appendix table 8 for standard errors. Source: Bureau of Justice Statistics, Census of Publicly Funded Forensic Crime Laboratories, 2014. P U B L I C LY F U N D E D F O R E N S I C C R I M E L A B O R ATO R I E S : R E S O U R C E S A N D S E R V I C E S , 2014 | N O V E M B E R 2016 4 More than 14,000 full-time employees worked in crime labs in 2014 Overall, the combined operating budgets for the 409 crime labs in 2014 was $1.7 billion (table 9). Labs serving state jurisdictions accounted for nearly half ($796 million) of the overall budget in 2014. Labs with 25 or more employees accounted for more than 80% of the total combined budget nationwide. Typical expenditures among crime labs include personnel (salaries and fringe benefits), supplies, equipment, and construction costs. In addition to their budgets, crime labs received funding from other sources, such as grants and fees. In 2014, about 4 in 10 crime labs charged the submitting agencies fees for completing the forensic services (not shown). Table 9 Annual operating budget for publicly funded forensic crime labs, by type of jurisdiction and number of full-time employees, 2014 All labs Type of jurisdiction Federal State County Municipal Number of full-time employees* 100 or more 50–99 25–49 10–24 9 or fewer Number of labs 409 Annual operating budget (in millions) $1,680 39 193 98 79 $302 796 306 277 27 51 90 134 107 $568 416 378 262 56 Note: Numbers are rounded to the nearest million. Detail does not sum to total due to rounding. See appendix table 9 for standard errors. *Includes both full-time and part-time employees, with a weight of 0.5 assigned to part-time employees. Source: Bureau of Justice Statistics, Census of Publicly Funded Forensic Crime Laboratories, 2014. Publicly funded crime labs employed 14,300 full-time personnel in 2014, an increase from 11,000 in the 351 labs operating in 2002 (table 10). Nearly half (6,600) of these employees in 2014 worked in state-operated labs. In 2014, the majority (59%) of crime labs had 24 or fewer employees (not shown). The mean number of full-time lab employees was 35, and the median number was 20 employees per lab. Twenty-six percent of federal labs, 19% of state labs, and 18% of county and municipal labs had 100 or more employees in 2014. In 2014, more than half (60%) of crime lab employees were analysts or examiners who prepared and analyzed evidence and reported on their conclusions (table 11). The majority of analysts were intermediate- or senior-level employees. Municipal and county labs were more likely than state and federal labs to employ crime scene technicians, who record and collect evidence from crime scenes and submit that evidence to a crime lab for analysis. Table 10 Number of full-time employees in publicly funded forensic crime labs, by type of jurisdiction, 2002, 2005, 2009, and 2014 Type of jurisdiction All labs Federal State County Municipal Number of labs 2002 11,000 2,000 5,300 1,900 1,900 351 2005 12,200 2,400 5,600 2,200 2,000 389 2009 13,100 2,300 6,100 2,500 2,200 411 2014 14,300 2,100 6,600 2,900 2,700 409 Note: Estimates include both full-time and part-time employees, with a weight of 0.5 assigned to part-time employees. Numbers are rounded to nearest hundred. Detail does not sum to total due to rounding. See appendix table 10 for standard errors. Source: Bureau of Justice Statistics, Census of Publicly Funded Forensic Crime Laboratories, 2002, 2005, 2009, and 2014. Table 11 Positions of full-time employees in publicly funded forensic crime labs, by type of jurisdiction, 2014 Type of position All full-time employees Analyst/examiner Entry level Intermediate/senior level Technical support Manager Clerical support Crime scene technician Other* Total 100% 60% 12 48 7% 13% 9% 6% 5% Federal 100% 52% 2 51 13% 16% 10% -15% State 100% 66% 16 50 8% 12% 8% 1% 3% County 100% 56% 11 45 7% 12% 8% 12% 4% Municipal 100% 55% 11 44 4% 12% 10% 15% 2% Note: Detail does not sum to total due to rounding. See appendix table 11 for standard errors. --Less than 0.5%. *Includes other positions in labs, such as building maintenance, photographers, and polygraph examiners. Source: Bureau of Justice Statistics, Census of Publicly Funded Forensic Crime Laboratories, 2014. P U B L I C LY F U N D E D F O R E N S I C C R I M E L A B O R ATO R I E S : R E S O U R C E S A N D S E R V I C E S , 2014 | N O V E M B E R 2016 5 Methodology Overview The Bureau of Justice Statistics (BJS) periodically conducts the Census of Publicly Funded Forensic Crime Laboratories (CPFFCL) to collect data on crime lab services, budgets, staffing, workload, outsourcing, and quality assurance practices. The data collection is directed to federal, state, county, and municipal crime labs that are funded solely by the government or whose parent organization is a government agency. The CPFFCL includes agencies that employ one or more full-time scientists (1) with a minimum of a bachelor’s degree in chemistry, physics, biology, criminalistics, or a closely related forensic science field, and (2) whose principal function is examining physical evidence in criminal matters and providing reports and testimony to courts of law regarding such evidence. About half of the crime labs included in the CPFFCL were part of a multi-lab system (two or more physically separate facilities that were overseen by a single organization). The CPFFCL attempted to collect information from each lab in multi-lab systems. The CPFFCL did not include operations that engage exclusively in evidence collection and documentation, such as fingerprint recovery and development, crime scene response, and photography. In addition, the census did not collect data on the forensic services performed by police identification units outside of the crime lab, and it also did not include privately operated crime labs. Data collection and response rate BJS conducted its fourth CPFFCL to collect detailed information on the workload and operations of the nation’s 409 crime labs during 2014 and to examine changes since the previous censuses conducted in 2002, 2005, and 2009. The CPFFCL population frame and questionnaire were developed by BJS and the Urban Institute with input from the American Society of Crime Laboratory Directors and researchers and practitioners in the forensic science field. BJS pretested the CPFFCL questionnaire on a small sample of labs representing facilities of different sizes and governmental affiliations. In April 2015, the Urban Institute initiated the data collection on behalf of BJS through a web-based data collection interface and mailed questionnaire. Follow-up emails and phone calls were made to nonrespondents and labs that submitted incomplete questionnaires. Of the 409 eligible crime labs that received the questionnaire, 360 (88%) provided responses to at least some of the items (table 12).* Of the 360 respondents, 351 (98%) completed the questionnaire through the automated web system. The 2014 CPFFCL response rate ranged from 72% for federal labs to 94% for state labs. Methods for producing national estimates To generate national estimates for this report, BJS used several imputation methods to account for missing data among labs that did not respond to either the entire CPFFCL questionnaire (unit-level response) or certain questions (item-level response). Because the CPFFCL data collection was a census with no sampling, each crime lab was initially self-representing and had a design weight of 1. BJS developed weighting class adjustments for the 2002, 2005, 2009, and 2014 CPFFCL data to compensate for unit nonresponse and reduce nonresponse bias. Sixteen subpopulations of labs were stratified into groups by crossing four categories of jurisdiction (federal, state, county, and municipal) and four categories of staff size (9 or fewer, 10 to 24, 25 to 49, and 50 or more). A seventeenth stratum was assigned to the FBI crime laboratory, given its unique size of more than 500 employees. Within each of the subgroups, statistical weights were applied to the data from the crime labs that responded to the census to allow their responses to represent the labs that did not respond. In addition to adjusting for unit nonresponse through the use of weighting class adjustments, BJS also imputed for item nonresponse. BJS measured staff size by full-time equivalent employees and included both full-time and part-time employees with part-time employees weighted by 0.5. For the labs that responded to the CPFFCL but did not report employee data, imputations were made for the count- and percentage-based measures using their employee data reported in the other CPFFCL data collections. If that information was not available, BJS used the median staff size in 2014 among labs of similar jurisdiction. Among the 360 labs that responded to the 2014 CPFFCL, 339 reported their 2014 employee total. For the 22 labs that did not report their 2014 staff total, the previous reported staff total was used. Estimates for the 2002, 2005, and 2009 CPFFCL were generated using similar imputation methods. When employee totals from other CPFFCL data collections were not available to account for item nonresponse, the median staff size of labs of similar jurisdiction was used. Table 12 Publicly funded forensic crime labs, by type of jurisdiction, 2014 Type of jurisdiction All labs Federal State County Municipal All labs in CPFFCL 409 39 193 98 79 Labs responding to CPFFCL 360 28 182 87 63 Response rate 88% 72 94 89 80 Source: Bureau of Justice Statistics, Census of Publicly Funded Forensic Crime Laboratories (CPFFCL), 2014. *Of the 351 crime labs in the 2002 CPFFCL, 306 (87%) provided responses to the 2002 questionnaire. Of the 389 crime labs in the 2005 CPFFCL, 351 (90%) provided responses to the questionnaire. Of the 411 crime labs surveyed in the 2009 CPFFCL, 397 (97%) provided responses to that data collection. P U B L I C LY F U N D E D F O R E N S I C C R I M E L A B O R ATO R I E S : R E S O U R C E S A N D S E R V I C E S , 2014 | N O V E M B E R 2016 6 When a crime lab responded to the CPFFCL questionnaire but was unable to provide budget data, imputations were made for the count- and percentage-based measures using their budget data from the other CPFFCL data collections. If that information was unavailable, the lab’s staff size was multiplied by the median ratio of budgets per employee for labs of similar jurisdiction and size. Among the 360 labs that responded to the 2014 CPFFCL, 331 reported their 2014 budget. Twenty-four labs did not report their 2014 budget and the previous reported budget was used. Five labs did not report their 2014 or previous budget and the median ratio of budgets per employee was used. When a crime lab responded to the CPFFCL questionnaire but did not provide data on the number and types of requests received, completed, and backlogged, data imputations were made for the count- and percentage-based measures within each category of a forensic function they performed that year. Depending on the availability of data, imputations for requests received and completed were based on either information provided in the other CPFFCL data collections or on the median number of requests among labs of similar size and jurisdiction. Depending on the availability of information, imputations for backlogs were made using the number of pending requests in 2014, the number of backlogged requests reported in the other CPFFCL data collections, or the median backlog among labs of similar size and jurisdiction. When a crime lab responded to the CPFFCL questionnaire but could not provide data on outsourcing requests for services, BJS used sequential hot-deck imputation procedures to impute the missing responses for 2002, 2005, 2009, and 2014. Sequential hot-deck imputation replaces a missing value with a response provided by a crime lab with similar characteristics. Data on outsourcing were reported by 93% of the 360 labs responding to the 2014 CPFFCL, 98% of the 397 labs responding to the 2009 CPFFCL, 76% of the 351 labs responding to the 2005 CPFFCL, and 88% of the 306 labs responding to the 2002 CPFFCL. BJS grouped both respondents and nonrespondents into the strata previously described and then sorted within each stratum by the number of forensic functions each lab performed. Once the list of crime labs was sorted within strata, the respondents provided donor responses for nonrespondents using the nearest neighbor method. This method identifies and replaces a missing value with the response donated from the lab listed immediately prior to the lab with missing data. If the donor listed immediately prior to the lab with missing data also had a missing response, BJS imputed a response from a donor listed immediately after the lab with the missing value. BJS repeated the process of going backwards and forwards to obtain donated responses from neighbors until all missing values were imputed. Comparability to prior reports Except for count-based estimates for staff size, budget, and workload, data presented in the 2002, 2005, and 2009 CPFFCL reports were not adjusted for unit or item nonresponse. Estimates presented in this report may be different from previously presented data because some adjustments for unit or item nonresponse were made. For example, Census of Publicly Funded Forensic Crime Laboratories, 2009 (NCJ 238252, BJS web, August 2012) reported that 31% of municipal crime labs outsourced forensic services in 2009. However, this publication reported that 32% of municipal crime labs outsourced forensic services in 2009. In the August 2012 report, data on outsourcing were based on 389 crime labs (of the 397 labs that responded to the 2009 CPFFCL). In this report, 2009 data have been adjusted to account for nonresponse and represent all 411 crime labs in the 2009 CPFFCL. In addition to the revisions to the workload estimates based on the new imputation procedures, the overall number of requests received, completed, and backlogged in 2009 for forensic biology casework reported in Census of Publicly Funded Forensic Crime Laboratories, 2009 were adjusted because of a revision in the information collected from the FBI crime lab. Conducting tests of statistical significance BJS conducted tests to determine whether differences in the estimates were statistically significant. All differences discussed in this report are statistically significant at or above the 95% confidence interval. Standard errors were generated using SPSS statistical software that estimates variance for complex survey designs. The standard errors for the tables and figures are presented in appendix tables. These standard error estimates may be used to construct confidence intervals around percentages in this report. For example, the 95% confidence interval around the percentage of crime labs that outsourced requests for services in 2014 is 38% ± 1.96 × 0.9% (or approximately 1.8%), where 38% is the point estimate in table 6 and 0.9% is the standard error in appendix table 7. The standard errors may also be used to test the significance of the difference between two statistics by pooling the standard errors of the two estimates. For example, the standard error of the difference between state and county crime labs that outsourced requests for services in 2014 is 3.9% (or the square root of the sum of the squared standard errors for each group). The 95% confidence interval around the difference is 1.96 × 2% (or 3.9%). Because the observed difference of 31% (54% minus 23%) is greater than 3.9%, the difference is considered statistically significant. P U B L I C LY F U N D E D F O R E N S I C C R I M E L A B O R ATO R I E S : R E S O U R C E S A N D S E R V I C E S , 2014 | N O V E M B E R 2016 7 Pilot study of digital evidence laboratories BJS expanded the 2014 CPFFCL from previous data collections to include a pilot study of agencies that solely analyze digital and multimedia evidence in support of criminal investigations and prosecutions. Law enforcement agencies obtain digital evidence in various formats, including audio, video, and graphical images from computers, cell phones, cameras, and other electronic devices. The traditional CPFFCL definition of a crime lab limited the information collected about digital evidence. Some crime labs only handle this type of evidence and employ forensic experts with training in computer science or information technology as opposed to natural sciences. The expanded scope of the 2014 CPFFCL included additional questions related to the analysis of digital evidence. BJS will use the results of this pilot study to inform future data collections directed toward criminal justice agencies that process forensic evidence. Definitions Analyst/examiner—an investigator who inspects, analyzes, and interprets physical evidence, writes reports, and delivers testimony in court about the evidence. Backlogged request—a request that has been submitted to a specialized area of the crime laboratory and is not completed within 30 days. Controlled substance analysis—the identification of drugs and other substances whose possession or use, in either legal or illicit dosages, is restricted by the government. Crime scene analysis—the identification, documentation, collection, and interpretation of physical evidence at a location external to a laboratory facility and where a suspected crime has occurred. Digital evidence—the investigation of various types of analog or multimedia evidence, such as the recovery, extraction, and analysis of computer files, film, tape, and magnetic and optical media. Firearms analysis—the examination and comparison of evidence resulting from the discharge or use of firearms. Impressions analysis—the identification, documentation, collection, and interpretation of two- and three-dimensional impressions and imprints found at crime scenes (including shoes and tires). Latent prints analysis—the development or comparison of finger or palm print impressions. Municipal—cities, towns, villages, and boroughs. Questioned documents analysis—the examination of printed, typed, or written material for the purpose of identifying the source or determining alterations, or other means of gaining information about the item or the circumstances surrounding its production. Request—the submission of physical evidence from a case to a single specialized area of a crime laboratory. Multiple submissions of new evidence from the same case to one or more sections of the laboratory are counted as separate requests. Synthetic cannabinoids—synthetically produced compounds that mimic naturally occurring cannabinoids. These compounds are added to some other substrate, marketed as “spice” or herbal incense products, and are used illicitly for their psycho-active properties. Synthetic cathinones—a cathinone is a compound naturally found in the khat plant. When produced synthetically, these compounds are marketed as bath salts and abused for their stimulant properties. Toolmark analysis—the comparison of marks made by various tools. Toxicology—the analysis of biological samples for the presence of drugs and other potentially toxic materials. Includes antemortem, postmortem, and blood alcohol content. Trace evidence—any analytical procedure using microscopy or chemical and instrumental techniques. Includes the examination of gunshot residue, explosives, hair, fibers, and fire debris. Forensic biology—includes the discipline areas of biology screening and DNA analysis. Biology screening is the examination of evidence for the presence of stains from blood, saliva and other physiological fluids. DNA analysis is the process used to develop a DNA profile from convicted offenders or arrestees as required by federal and state laws or casework samples collected from crime scenes, victims, or suspects. P U B L I C LY F U N D E D F O R E N S I C C R I M E L A B O R ATO R I E S : R E S O U R C E S A N D S E R V I C E S , 2014 | N O V E M B E R 2016 8 Appendix Table 1 Standard errors for table 1: Functions performed by publicly funded forensic crime labs, 2002, 2005, 2009, and 2014 Forensic function Controlled substances Crime scene Digital evidence Firearms/toolmarks Forensic biology Impressions Latent prints Questioned documents Toxicology Trace evidence 2002 0.8% 1.0 0.7 1.0 0.9 … 1.0 0.7 0.9 1.0 2005 0.8% 0.7 0.9 1.0 1.0 1.0 0.8 0.8 0.8 1.0 2009 0.4% 0.5 0.4 0.4 0.4 0.4 0.4 0.3 0.4 0.5 2014 0.9% 0.9 0.8 0.9 0.9 0.9 0.8 0.7 0.8 0.8 Appendix Table 3 Standard errors for table 3: Percent of publicly funded forensic crime labs that examined trace evidence, by type of examination, 2009 and 2014 Trace evidence Explosives analysis Fiber examination Fire debris analysis Gunshot residue Hair examination Paint analysis Unknown chemical 2009 1.9% 2.2 2.0 1.9 2.3 2.1 2.1 2014 2.2% 2.5 2.3 2.2 2.6 2.4 2.4 Source: Bureau of Justice Statistics, Census of Publicly Funded Forensic Crime Laboratories, 2009 and 2014. …Not available. Source: Bureau of Justice Statistics, Census of Publicly Funded Forensic Crime Laboratories, 2002, 2005, 2009, and 2014. Appendix Table 2 Standard errors for table 2: Functions performed by publicly funded forensic crime labs, by type of jurisdiction, 2014 Forensic function Federal Controlled substances 5.0% Crime scene 5.7 Digital evidence 5.1 Firearms/toolmarks 4.6 Forensic biology casework 4.6 Forensic biology from convicted offender/arrestee samples 3.8 Impressions 4.5 Latent prints 5.2 Questioned documents 5.5 Toxicology 2.3 Trace evidence 4.6 State 0.6% 0.8 0.4 0.8 0.7 County 1.5% 1.9 1.4 1.8 1.7 Municipal 2.8% 2.5 2.7 2.8 2.5 0.5 0.7 0.8 0.4 0.8 0.8 1.1 1.8 1.8 0.9 1.9 1.8 1.0 2.6 1.8 1.5 2.7 2.3 …Not available. Source: Bureau of Justice Statistics, Census of Publicly Funded Forensic Crime Laboratories, 2014. Appendix Table 4 Standard errors for table 4: Requests for services received and completed by publicly funded forensic crime labs, by type of request, 2009 and 2014 Received Completed 2009 Type of request All requests Controlled substances Crime scene Digital evidence Firearms/toolmarks Forensic biology casework Forensic biology from convicted offender/ arrestee samples Impressions Latent prints Questioned documents Toxicology Trace evidence 2014 Number 57,609 13,576 3,471 824 1,611 2,088 Percent 57,036 478 2,462 2,103 14,100 1,662 2009 Percent 0.6% 0.1 0.0 0.1 0.1 Number 56,050 22,041 8,804 2,099 4,411 10,699 1.1 0.0 0.1 0.1 0.4 0.0 34,970 366 24,275 774 23,675 2,446 0.8 0.0 0.6 0.0 0.6 0.1 0.5% 0.2 0.1 0.1 0.3 2014 Number 56,623 14,035 3,469 816 1,391 2,074 Percent 56,036 543 2,457 1,801 13,305 1,668 1.1 0.0 0.1 0.0 0.4 0.0 0.6% 0.1 0.0 0.1 0.1 Number 55,354 20,104 8,808 2,140 3,570 4,622 Percent 36,428 381 24,401 821 23,304 1,991 0.8 0.0 0.6 0.0 0.6 0.1 0.5% 0.2 0.1 0.1 0.2 Source: Bureau of Justice Statistics, Census of Publicly Funded Forensic Crime Laboratories, 2009 and 2014. P U B L I C LY F U N D E D F O R E N S I C C R I M E L A B O R ATO R I E S : R E S O U R C E S A N D S E R V I C E S , 2014 | N O V E M B E R 2016 9 Appendix Table 5 Standard errors for table 5: Percent of requests for services received by publicly funded forensic crime labs, by type of jurisdiction, 2014 Appendix Table 7 Standard errors for table 7: Percent of publicly funded forensic crime labs outsourcing requests for services, by type of jurisdiction, 2002, 2005, 2009, and 2014 Type of request Federal State Controlled substances 3.5% 0.6% Crime scene 0.2 0.0 Digital evidence 0.5 0.0 Firearms/toolmarks 0.1 0.1 Forensic biology casework 0.4 0.1 Forensic biology from convicted offender/arrestee samples 6.3 1.0 Impressions 0.0 0.0 Latent prints 7.5 0.1 Questioned documents 0.4 0.0 Toxicology 1.6 0.4 Trace evidence 0.2 0.1 Total requests received 30,898 33,205 Type of jurisdiction All labs Federal State County Municipal County 1.4% 0.5 0.0 0.1 0.4 0.2 0.0 0.6 0.0 2.2 0.2 23,717 Municipal 1.5% 1.4 0.3 0.6 1.5 1.2 0.0 0.8 0.0 0.7 0.1 22,843 Source: Bureau of Justice Statistics, Census of Publicly Funded Forensic Crime Laboratories, 2014. Appendix Table 6 Standard errors for table 6: Requests for services backlogged in publicly funded forensic crime labs, by type of request, yearend 2009 and 2014 2009 Type of request Number Percent All requests 10,124 Controlled substances 2,848 0.3% Digital evidence 97 0.0 Firearms/toolmarks 997 0.1 Forensic biology casework 1,172 0.2 Forensic biology from convicted offender/arrestee samples 8,961 0.5 Impressions 914 0.1 Latent prints 693 0.1 Questioned documents 518 0.1 Toxicology 931 0.1 Trace evidence 153 0.0 2014 Number Percent 12,693 8,147 0.9% 87 0.0 2,532 0.4 3,782 0.6 4,702 110 2,920 62 1,789 282 2002 0.9% 2.8 1.2 1.8 2.3 2005 1.1% ^ 0.4 1.0 2.3 2009 0.4% 1.6 0.4 0.7 1.3 2014 0.9% 4.8 0.6 1.9 2.9 ^Too few cases to provide a reliable estimate. Source: Bureau of Justice Statistics, Census of Publicly Funded Forensic Crime Laboratories, 2002, 2005, 2009, and 2014. Appendix Table 8 Standard errors for table 8: Percent of publicly funded crime labs outsourcing requests for services, by type of service, 2014 Type of request Controlled substances Digital evidence Firearms/toolmarks Forensic biology casework Forensic biology from convicted offender/arrestee samples Impressions Latent prints Questioned documents Toxicology Trace evidence Percent 1.6% 2.0 1.5 1.8 2.4 1.7 1.1 2.5 2.0 2.0 Source: Bureau of Justice Statistics, Census of Publicly Funded Forensic Crime Laboratories, 2014. 0.8 0.0 0.5 0.0 0.3 0.1 Source: Bureau of Justice Statistics, Census of Publicly Funded Forensic Crime Laboratories, 2009 and 2014. P U B L I C LY F U N D E D F O R E N S I C C R I M E L A B O R ATO R I E S : R E S O U R C E S A N D S E R V I C E S , 2014 | N O V E M B E R 2016 10 Appendix Table 9 Standard errors for table 9: Annual operating budget for publicly funded forensic crime labs, by type of jurisdiction and number of full-time employees, 2014 Annual operating budget $27,666,159 All labs Type of jurisdiction Federal State County Municipal Number of full-time employees 100 or more 50–99 25–49 10–24 9 or fewer 23,728,956 8,072,029 4,123,355 10,963,271 Appendix Table 10 Standard errors for table 10: Number of employees in publicly funded forensic crime labs, by type of jurisdiction, 2002, 2005, 2009, and 2014 Type of jurisdiction All labs Federal State County Municipal 2002 102 68 58 48 7 2005 387 376 40 54 61 2009 105 97 39 7 7 2014 123 59 66 17 84 Source: Bureau of Justice Statistics, Census of Publicly Funded Forensic Crime Laboratories, 2002, 2005, 2009, and 2014. 16,019,940 23,976,084 11,263,190 6,679,329 1,816,089 Source: Bureau of Justice Statistics, Census of Publicly Funded Forensic Crime Laboratories, 2014. Appendix Table 11 Standard errors for table 11: Positions of full-time employees in publicly funded forensic crime labs, by type of jurisdiction, 2014 Type of position Analyst/examiner Entry level Intermediate/senior level Technical support Manager Clerical support Crime scene technician Other Total 0.4% 0.4 0.6 0.2% 0.3% 0.2% 0.3% 0.3% Federal 3.0% 0.7 2.8 0.5% 1.0% 0.5% 0.3% 2.3% State 0.4% 0.5 0.6 0.3% 0.2% 0.2% 0.2% 0.2% County 0.9% 0.6 1.0 0.5% 0.3% 0.2% 0.6% 0.4% Municipal 1.0% 0.9 0.8 0.5% 0.5% 1.0% 1.3% 0.3% Source: Bureau of Justice Statistics, Census of Publicly Funded Forensic Crime Laboratories, 2014. P U B L I C LY F U N D E D F O R E N S I C C R I M E L A B O R ATO R I E S : R E S O U R C E S A N D S E R V I C E S , 2014 | N O V E M B E R 2016 11 The Bureau of Justice Statistics of the U.S. Department of Justice is the principal federal agency responsible for measuring crime, criminal victimization, criminal offenders, victims of crime, correlates of crime, and the operation of criminal and civil justice systems at the federal, state, tribal, and local levels. BJS collects, analyzes, and disseminates reliable and valid statistics on crime and justice systems in the United States, supports improvements to state and local criminal justice information systems, and participates with national and international organizations to develop and recommend national standards for justice statistics. Jeri M. Mulrow is acting director. This report was written by Matthew R. Durose and Andrea M. Burch of BJS and Kelly Walsh and Emily Tiry of Urban Institute. Christina Aldada, Samantha Lowry, Eddie Mohr, Elizabeth Pelletier, Jennifer Yahner, and Lilly Yu from the Urban Institute assisted with data collection and processing activities. Anastasios Tsoutis verified the report. Caitlin Scoville and Jill Thomas edited the report. Tina Dorsey and Barbara Quinn produced the report. November 2016, NCJ 250151 NCJ 250151 Office of Justice Programs Innovation • Partnerships • Safer Neighborhoods www.ojp.usdoj.gov


