

Residential Proximity to Schools and Daycare Centers - Influence on Sex Offense Recidivism, IACFP, 2010
Download original document:
Document text
Document text
This text is machine-read, and may contain errors. Check the original document to verify accuracy.
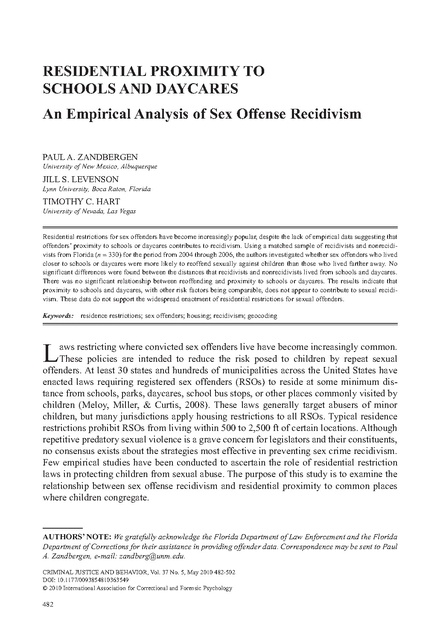
RESIDENTIAL PROXIMITY TO SCHOOLS AND DAYCARES An Empirical Analysis of Sex Offense Recidivism PAUL A. ZANDBERGEN University of New Mexico, Albuquerque JILL S. LEVENSON Lynn University, Boca Raton, Florida TIMOTHY C. HART University of Nevada, Las Vegas Residential restrictions for sex offenders have become increasingly popular, despite the lack of empirical data suggesting that offenders’ proximity to schools or daycares contributes to recidivism. Using a matched sample of recidivists and nonrecidivists from Florida (n = 330) for the period from 2004 through 2006, the authors investigated whether sex offenders who lived closer to schools or daycares were more likely to reoffend sexually against children than those who lived farther away. No significant differences were found between the distances that recidivists and nonrecidivists lived from schools and daycares. There was no significant relationship between reoffending and proximity to schools or daycares. The results indicate that proximity to schools and daycares, with other risk factors being comparable, does not appear to contribute to sexual recidivism. These data do not support the widespread enactment of residential restrictions for sexual offenders. Keywords: residence restrictions; sex offenders; housing; recidivism; geocoding L aws restricting where convicted sex offenders live have become increasingly common. These policies are intended to reduce the risk posed to children by repeat sexual offenders. At least 30 states and hundreds of municipalities across the United States have enacted laws requiring registered sex offenders (RSOs) to reside at some minimum distance from schools, parks, daycares, school bus stops, or other places commonly visited by children (Meloy, Miller, & Curtis, 2008). These laws generally target abusers of minor children, but many jurisdictions apply housing restrictions to all RSOs. Typical residence restrictions prohibit RSOs from living within 500 to 2,500 ft of certain locations. Although repetitive predatory sexual violence is a grave concern for legislators and their constituents, no consensus exists about the strategies most effective in preventing sex crime recidivism. Few empirical studies have been conducted to ascertain the role of residential restriction laws in protecting children from sexual abuse. The purpose of this study is to examine the relationship between sex offense recidivism and residential proximity to common places where children congregate. AUTHORS’ NOTE: We gratefully acknowledge the Florida Department of Law Enforcement and the Florida Department of Corrections for their assistance in providing offender data. Correspondence may be sent to Paul A. Zandbergen, e-mail: zandberg@unm.edu. CRIMINAL No. 5, X, May 20102007 482-502 CRIMINAL JUSTICE JUSTICE AND AND BEHAVIOR, BEHAVIOR, Vol. Vol. 37 XX, No. Month 482-XXX DOI: DOI: 10.1177/0093854810363549 © Association Correctional Forensic Psychology © 2010 2007 International American Association forfor Correctional andand Forensic Psychology 482 Zandbergen et al. / RESIDENTIAL PROXIMITY 483 Little is known about the ways in which the residential locations of sex offenders might influence sex offense recidivism. Routine activities theory (RAT) (Cohen & Felson, 1979) postulates that for crime to occur, three conditions must exist: the presence of a motivated offender, access to a potential victim, and the absence of capable guardians to prevent criminal activity. As applied to sex offender residence restrictions, RAT would suggest that predatory or pedophilic sex offenders are most likely to commit new assaults against children when they have unrestricted or unmonitored access to youngsters. Living in close proximity to a school or other place known to cater to children might, theoretically, increase opportunities for sex offenders to have contact with children or to view children playing, thereby reinforcing their sexually deviant preferences and facilitating child sexual abuse. The impact of residence restrictions laws on recidivism remains largely unknown. The only known investigation to date was conducted by the Iowa Department of Criminal and Juvenile Justice Planning (Blood, Watson, & Stageberg, 2008). Iowa’s statewide 2,000-ft residential restriction law went into effect in August 2005. Researchers compared the number of charges filed for sex offenses with minor victims in the 12 months prior to the enforcement of the law with the number of charges filed within 24 months after implementation. The number of charges steadily increased each year; there were 913 charges filed during the year prior to implementation, 928 filed the subsequent year, and 1,095 filed the following year. The authors concluded that Iowa’s residence law “does not seem to have led to fewer charges or convictions, indicating that there probably have not been fewer child victims” (Blood et al., 2008, p. 10). Mapping technologies provide other opportunities for researchers to study key questions related to proximity and recidivism. In keeping with RAT, one might surmise that pedophiles choose to live within easy access to children and that those living in closer proximity to schools, parks, or bus stops would have higher recidivism rates than offenders living farther away. The empirical data surrounding these assumptions are extremely limited and decidedly mixed. An analysis of the addresses of RSOs in Pulaski County, Arkansas, found that child abusers were more likely than other sex offenders to live near schools, daycares, and parks (Walker, Golden, & VanHouten, 2001). In Newark, New Jersey, however, those who abused children lived significantly farther from schools than did those who offended against adults (Chajewski & Mercado, 2008). However, the Newark sex offenders lived significantly closer (on average 1,094 ft closer) to schools than did other community members (Chajewski & Mercado, 2008); in Camden County, New Jersey, 88% of sex offenders lived within 2,500 ft of schools, parks, daycares, or churches, compared to 80% of households in general (Zgoba, Levenson, & McKee, 2009). RAT might suggest that sex offenders intentionally place themselves in close proximity to potential victims, but an alternative explanation is that economic considerations are the primary factors influencing residential choices (Red Bird, 2009; Tewksbury & Mustaine, 2006; Tewksbury & Mustaine, in press-a). Underemployment is not unusual for those with a felony conviction, and as a result, sex offenders often reside in less affluent communities (Tewksbury & Mustaine, 2006). RSOs are likely to be found in disadvantaged neighborhoods with higher levels of social disorganization (Red Bird, 2009; Tewksbury & Mustaine, 2008). Lower income neighborhoods tend to exist in densely populated urban areas where, consequently, residential dwellings are in closer proximity to schools and other child-oriented sites. Such neighborhoods might be more affordable for criminal offenders, but they are 484 CRIMINAL JUSTICE AND BEHAVIOR also characterized by community neglect and a paucity of resources that make their residents more vulnerable to crime. It is interesting to note that although sex offenses occur more frequently in census tracts with larger proportions of young children, the number of schools is not associated with a greater frequency of sex offenses (Tewksbury, Mustaine, & Stengel, 2008). Moreover, Tewksbury et al. (2008) found that a higher concentration of RSOs in a neighborhood was not significantly correlated with the incidence of sex offenses. Thus far, proximity to schools has not been studied in such a way that can explicitly determine its empirical relationship to sex offense recidivism. In Colorado, sex offenders’ residential proximity to schools and daycares was not specifically analyzed, but mapping allowed the authors to infer that sex offense recidivists resided randomly throughout the geographical area and did not appear to live closer to schools and daycares than nonrecidivists (Colorado Department of Public Safety, 2004). A qualitative analysis of 13 recidivistic sex offenses in Minnesota revealed that only 2 reoffenses took place in parks and none occurred near schools. In both cases, the perpetrators did not live in close proximity to the crime scene and in fact drove a vehicle to commit the offense (Minnesota Department of Corrections, 2003). More recently, researchers in Minnesota analyzed 224 recidivistic sex offenses and concluded that none would have been prevented by a residence restriction law (Duwe, Donnay, & Tewksbury, 2008). The authors did not measure where the offenders lived in relation to places where children congregate, but by using police reports and case files, they were able to determine whether an offender first established contact with a minor victim in or near a location typically restricted by housing laws. Using Google Earth, they calculated the straight-line distance between the offender’s home and the locations of the offense and first victim contact. Most offenders first made contact with victims more than 1 mile from their homes. Predatory assaults that occurred within a mile of the offenders’ residences were most likely to be perpetrated against adult victims; of those involving minor victims, most contact was cultivated within 2,500 ft of the offenders’ homes, but none was facilitated by close proximity to a school, daycare, or park. The sex offenses against children were most likely to be perpetrated by offenders who were well acquainted with their victims, such as parents, caretakers, paramours of the mothers, babysitters, or friends of the family. Only in 3.6% of the cases was the sex offender a neighbor of the victim. The authors concluded that in child sexual abuse cases, social or relationship proximity to victims is a more important factor than residential proximity (Duwe et al., 2008). Although the empirical link between residential proximity and sexual recidivism has yet to be established, emerging evidence indicates that housing availability is greatly diminished by residence restriction policies. In Orange County, Florida, the locations of more than 137,000 residential parcels were analyzed, and 95% were found to be located within 1,000 ft of schools, parks, daycares, or school bus stops (Zandbergen & Hart, 2006). A buffer zone of 2,500 ft resulted in excluding more than 99% of all residential parcels and eliminated all but 37 properties in the entire county (Zandbergen & Hart, 2006). Similarly, in New Jersey, 93% of Newark’s residential territory is located within 2,500 ft of schools, and therefore few addresses would be compliant with a housing restriction of that distance (Chajewski & Mercado, 2008). In four major metropolitan centers in South Carolina, only 9% of the 540,613 properties zoned for residential use were unoccupied or available for rent, and of those, 45% would not be compliant with a 1,000-ft zone around schools or daycares (Barnes, Dukes, Tewksbury, & DeTroye, 2009). Researchers in Colorado concluded that in urban areas, the large number of schools and childcare centers located within residential Zandbergen et al. / RESIDENTIAL PROXIMITY 485 neighborhoods severely limited the areas in which sex offenders could reside if housing restrictions were implemented (Colorado Department of Public Safety, 2004). Residential restrictions can also create obstacles to offender reintegration. Several studies indicate that homelessness and transience have become more problematic for RSOs. In a survey of RSOs in Oklahoma and Kansas, 54% reported that a housing restriction law forced them to relocate (Tewksbury & Mustaine, in press-b). In Indiana, 26% of sex offenders surveyed said that they were unable to return to their homes after incarceration, 37% were not allowed to live with family members, and nearly a third experienced a landlord’s refusal to rent to them or to renew a lease (Levenson & Hern, 2007). Many sex offenders in Florida and Indiana reported that affordable housing is less available due to limits on where they can live and that they are made to live farther away from employment, public transportation, social services, and mental health clinics (Levenson, 2008; Levenson & Cotter, 2005; Levenson & Hern, 2007). Similarly, New Jersey sex offenders indicated that residential restrictions have led to financial hardship and pushed them farther away from employment, treatment, and family support (Mercado, Alvarez, & Levenson, 2008). Escalating problems of homelessness and transience were noted in Broward County, Florida, where 39% of the participants reported spending at least 2 days homeless or living with someone else and 22% said that they were forced to relocate more than twice (Levenson, 2008). Larger buffer zones were correlated with increased transience and homelessness and reduced employment opportunities (Levenson, 2008). Young adults seemed to be especially affected by these laws; age was significantly inversely associated with being unable to live with family and having difficulties securing affordable housing (Levenson, 2008; Levenson & Hern, 2007). Ironically, housing instability is consistently and strongly correlated with increased criminal recidivism and absconding. In a sample of more than 6,000 criminal offenders in Georgia, each time a parolee relocated, the risk of being rearrested increased by 25%, doubling the odds of recidivism by moving three times while on parole (Meredith, Speir, & Johnson, 2007). Residential instability was determined to be the most robust predictor of absconding in a study of more than 4,000 parolees in California (Williams, McShane, & Dolny, 2000), and in a national sample of probationers (N = 2,030), those who moved multiple times during their period of supervision were almost twice as likely as stable probationers to have a disciplinary hearing (Schulenberg, 2007). In a New Zealand study of sex offenders, poor housing accommodation was the aspect of reintegration most strongly linked with sexual recidivism (Willis & Grace, 2008). A subsequent validation study confirmed that poor reintegration planning characterized by unstable housing, unemployment, and a lack of social support predicted recidivism in a sample of 141 sex offenders from New Zealand (Willis & Grace, 2009). Currently, there are more questions than answers regarding the efficacy of residential restriction laws in deterring repetitive sexual predation. Although these policies are assumed to be a commonsense approach to reducing sex offenders’ access to children, their underlying assumption—that keeping sex offenders far from schools and other child-friendly locations will protect children from sexual abuse—has yet to be empirically confirmed. There is no doubt that children deserve to be safeguarded from sexual predators. Clarifying the relationship between recidivism and proximity to venues such as schools will assist lawmakers in their quest to ascertain which strategies are best able to achieve that goal. 486 CRIMINAL JUSTICE AND BEHAVIOR PURPOSE OF THE STUDY The purpose of this study is to investigate the relationship between sex offense recidivism and residential proximity to places where children commonly congregate. Specifically, we sought to determine whether sex offenders who lived closer to schools or daycares were more likely to reoffend sexually than those who lived farther away. The null hypothesis proposes that there will be no significant differences between recidivists and nonrecidivists in their proximity to schools or daycares. In addition, the null hypothesis assumes no statistically significant correlation between proximity and recidivism. This research is important for identifying the role that residential distance from child-oriented venues might play in inhibiting sexual recidivism. Policies informed by scientific data are more likely to successfully accomplish their goals of community protection. METHOD Florida was considered to be an informative state in which to conduct this research. Florida was the first state to enact a residence restriction for RSOs (Meloy et al., 2008). As of 1995, sex offenders on probation in Florida have been prohibited from living within 1,000 ft of schools, parks, playgrounds, daycares, or other places where children congregate (Special Conditions of Sex Offender Probation, 1997). In 2005, school bus stops were added for offenders leaving prison under conditional release programs. In 2005, the nation’s first municipal ordinance was passed in Miami Beach, restricting RSOs with minor victims from residing within 2,500 ft of schools, daycares, parks, and bus stops. Currently, according to the state’s Department of Corrections, Florida has more than 150 local ordinances (typically 2,500-ft zones passed by county and city commissioners) in addition to a statewide 1,000-ft law that now applies to all RSOs. The general approach used in this study to examine the effect of residential proximity on recidivism consisted of (a) determining the recidivist population for the period from 2004 to 2006, (b) selecting a comparable set of nonrecidivists, (c) geocoding the residential addresses of the two groups as well as all the schools and licensed daycares, (d) calculating proximity metrics for both populations, and (e) analyzing any differences in the distributions of proximity metrics between the two groups. These steps will be described in more detail in the sections below. OFFENDER POPULATION Data files on RSOs were obtained from the Florida Department of Law Enforcement (FDLE). The data included demographic information about each offender, a history of offenses, and a history of registered addresses. The database was obtained in 2007 and was considered up to date until December 2006. The publicly available registry of sex offenders for December 2006 was also obtained and matched to the FDLE records to obtain additional information not available in the original FDLE files. The original FDLE files contained information about 17,678 offenders, whereas the registry contained information about 38,084 offenders. This large discrepancy results from the fact that the registry is a cumulative record of all historical entries and contains numerous offenders who are deceased, have been deported, are under INS custody, or have established residency outside of Florida. Zandbergen et al. / RESIDENTIAL PROXIMITY 487 For the purpose of this study, a recidivist was defined as an RSO who had at least one conviction for a sex offense and who was arrested for a new sex offense in the period between January 1, 2004, and December 31, 2006. FDLE prepared the data with recidivists flagged based on this definition, including only those cases in which the original victim or the recidivistic victim was a minor (or both were minors). New arrests were used for our analysis because convictions can take a long time to take place and would create a temporal mismatch. Minor offenses, such as parole violations, were not considered recidivistic, and only sex offenses were counted as recidivistic. For each recidivist, the following variables were determined: age at time of new arrest (based on date of birth and arrest date), sex, race, marital status, number of all offenses prior to arrest date, number of all sex offenses prior to arrest date, victim’s age categories associated with both the original and the recidivistic offense, predator/offender status, and residential address prior to arrest date. The information about the victims’ ages in the databases of offenses and new arrests was incomplete, and no exact ages could be determined. As a result, victim’s age for both the original and the recidivistic offense was coded only as “minor” or “adult.” For new arrests, the victim’s age information was often missing, and therefore the victim’s age category was based on the offense codes at the time of the arrest. Information about the actual age of the victim, the victim’s gender, and the relationship to the victim was not available in the FDLE files. The residential address history was used to obtain the last address prior to the arrest date based on the date ranges for each address. Initially, FDLE flagged a total of 237 recidivists. Processing the data resulted in a final set of 168 recidivists, with 69 records removed for various reasons: 1 record was excluded because the offender was female; 36 records were excluded because the recidivist had no priors for sex offenses; 14 records were excluded because the address prior to the offense was outside of Florida (in most cases, this meant the only address in Florida consisted of a jail); 18 records were excluded because of other address issues—typically, the address history could not be matched reliably to the offense date (e.g., due to incomplete addresses, incomplete dates, lack of logic in address sequence, presence of only jail addresses, etc.). Geocoding of the residential address prior to the offense (described in a later section) caused 3 more records to be removed due to incomplete geocoding, bringing the final set of recidivists to 165. The sample of 165 recidivists contained 147 cases (or 89.1%) wherein the prior conviction was for a sex offense against a minor and the new arrest was for a sex offense against a minor. In 5 cases, the prior conviction was for a sex offense against an adult, and either the new arrest was for a sex offense against a minor or the victim’s age category could not be determined. In 13 cases, the prior conviction was for a sex offense against a minor, and the victim’s age category for the new arrest could not be determined. The data about all offenders in the FDLE files (N = 17,678) were utilized to generate a meaningful sample of nonrecidivists. The offender data were cleaned to obtain only male nonrecidivists who resided at a valid nonjail address and for whom demographic and prior offense data were available. Processing included the following specific steps: (a) removing the sample of 237 recidivists; (b) removing all female offenders; (c) removing all offenders whose status was deceased, incarcerated, under INS custody, deported, or absconded; (d) removing all offenders whose address in December 2006 corresponded to the address of a correctional facility (in many cases, an offender is reported as released or under supervision, but if he or she fails to report a new address, the last known address is still the location of 488 CRIMINAL JUSTICE AND BEHAVIOR TABLE 1: Variables Used to Characterize Offenders Variable Total Predator/offender status Sex priors (convictions) Total priors (convictions) Racial composition Victim age (initial)a Victim age (current)a Marital status Age Category Predator Offender Unknown 1 2 or 3 4 or more 3 or less 4 or more White Non-White Minor Adult Unknown Minor Adult Unknown Other Single Married Divorced/separated/ widowed Younger than 25 25 to 40 41 to 60 Older than 60 Recidivists Matched Nonrecidivists Code n % n % n P O U 1 2 3 3 4 W N M A U — — — O S M D 165 37 120 8 36 75 54 64 101 104 61 160 5 0 150 0 15 25 77 29 34 100.0 22.4 72.7 4.8 21.8 45.5 32.7 38.8 61.2 63.0 37.0 97.0 3.0 0.0 90.9 0.0 9.1 15.2 46.7 17.6 20.6 165 40 125 0 34 75 56 62 103 103 62 157 3 5 — — — 22 82 29 32 100.0 24.2 75.8 0.0 20.6 45.5 33.9 37.6 62.4 62.4 37.6 95.2 1.8 3.0 — — — 13.3 49.7 17.6 19.4 8,434 1,007 7,427 0 3,116 3,525 1,793 5,035 3,399 6,252 2,182 6,605 523 1,306 — — — 988 3,118 2,335 1,993 1 2 3 4 57 70 31 7 34.5 42.4 18.8 4.2 55 72 31 7 33.3 43.6 18.8 4.2 462 3,090 3,673 1,209 Total Nonrecidivists Note. Dashes indicate the variable is not applicable. a. For both recidivists and nonrecidivists, the Victim Age (Initial) variable refers to the age of the victim associated with the original offense, whereas the Victim Age (Current) variable refers to the age of the victim associated with the recidivistic offense. Therefore, this variable is not applicable to the nonrecidivist group and was not used in the matching procedure. the correctional facility); (e) removing all offenders with invalid addresses (missing street number, missing zip code and city, address outside of Florida); and (f) removing all offenders without complete demographic and prior offense data. This process resulted in a total of 8,434 nonrecidivists. For each nonrecidivist, the following variables were determined for December 2006: age, race, marital status, number of prior offenses, number of prior sex offenses, victim’s age category, predator/offender status, and residential address. Next, a sampling strategy was devised to create a comparable sample of nonrecidivists based on age, race, marital status, number of prior offenses, number of prior sex offenses, and victim’s age. For recidivists, the age of the victim associated with the prior sex offense was used. The logic behind this strategy is that such a sample controls for potential risk factors and other demographic variables, allowing for a direct comparison of proximity metrics. To facilitate the matching process, each of the seven variables was recoded according to Table 1. Zandbergen et al. / RESIDENTIAL PROXIMITY 489 The coding in Table 1 was used to create a seven-character code for each recidivist and nonrecidivist. Stratified random sampling using this code was employed to generate a sample of nonrecidivists equal in size (n = 165). In other words, if there were 3 recidivists who were predators who had two or three sex priors, had four or more total priors, were White, victimized minors, were single, and were between 25 and 40, a total of 3 nonrecidivists were selected at random from the total population of nonrecidivists with those exact same characteristics. This process was repeated to get a comparable sample of 165 nonrecidivists. SCHOOLS AND DAYCARES A database of all public and private schools for all of Florida was obtained from the National Center for Education Statistics for the 2005-2006 school year. All grades up to and including Grade 12 were included. The database included fields for the physical address of the school and consisted of 3,713 records for public schools and 1,818 records for private schools. A database of all licensed daycares for Florida was obtained from the Florida Department of Children and Families for 2006. The database included both childcare facilities and home-based family daycares. The database included fields for the physical addresses of the daycares and consisted of 13,564 records. The database of daycares contained records with missing address information, and both databases contained records with post office boxes for the street address. Secondary information from individual school boards and counties was therefore employed to supplement the address information. Although complete address information was obtained for every public school, a substantial number of incomplete records remained for private schools (n = 72) and daycares (n = 4,276). In the case of daycares, the incomplete address information was primarily the results of blank address fields for home-based daycares due to privacy concerns. GEOCODING The addresses for recidivists, nonrecidivists, schools, and daycares were geocoded using a multistage geocoding process. The most accurate way to represent the locations of these addresses within the context of this study is through the use of parcel boundaries. Although street geocoding is the most common method used in the United States to determine the location of addresses, this technique introduces positional error (Zandbergen, 2009), which can lead to substantial misclassification in determining proximity in the context of sex offender residence restrictions (Zandbergen & Hart, 2009). Parcel data, however, are not always available for all areas, and geocoding to parcels is also known for its relatively poor match rates, even when good parcel data are available (Zandbergen, 2008). The multistage geocoding process employed in the study was designed to overcome these limitations and to achieve the highest possible match rate at the parcel level. The geocoding process consisted of a combination of in-house geocoding using available address point, parcel, and street centerline data from local counties and third-party parcel and street geocoding by a commercial firm. For the in-house geocoding, the Geographic Information System and property appraiser departments of all 67 Florida counties were contacted with a request for address point, parcel, and street centerline data. Address point data consist of address locations in point 490 CRIMINAL JUSTICE AND BEHAVIOR format (i.e., a single XY location), typically associated with the Master Address File for a local jurisdiction such as a county. They are the preferred reference data for geocoding because their positional accuracy is excellent (the point is often placed directly on top of the building) and the match rates are very similar to those for street geocoding (Zandbergen, 2008). Parcel geocoding often results in lower match rates due in part to the fact that many addresses can be associated with a single parcel, such as a multiunit property. In the case of address points, these individual addresses are typically captured as individual points, resulting in multiple address points for a single parcel. The primary limitation of address points is their availability because only a selected number of local jurisdictions have developed an address point database. Address point data were obtained for 16 counties, including several of the most populated counties in the state such as Miami-Dade County and Orange County. Parcel data were obtained for all 67 counties, but the address information contained in the parcel data were considered of sufficient quality for geocoding for only 30 counties. Reliable street centerline data were obtained for 23 counties. In-house geocoding using the available reference data was accomplished in ArcGIS 9.2. All reference data were projected to a common Florida Albers coordinate system. Individual address locators were built for every available data set. Geocoding settings included the use of a minimum match score of 80, which effectively means that minor misspellings in the street name are allowed but that the street number has to be a perfect match. Each of the three data sets (offenders, schools, and daycares) was run through the same geocoding sequence. First, addresses were run through the address point geocoding. Any nonmatching records after this first step were run through the parcel geocoding. Any nonmatching records after this second step were run through the street geocoding. This resulted in three sets of points: those from address points (the exact XY location of the building associated with the address), those from parcel polygons (the centroid of the polygons), and those from street segments (the interpolated location along the street segment). Any of the records that did not produce a match using the in-house geocoding were submitted to a commercial firm specializing in parcel geocoding for Florida. This company essentially uses the same information as requested from each individual county but has gone through considerably more effort to acquire the data through licensing agreements. The company reported having complete address point and/or parcel data available for 62 counties and partial data for an additional 3 counties. Counties for which the coverage is lacking or incomplete are some of the least populated areas in Florida, which means that geocoding coverage at the parcel level based on population is greater than 99%. In addition to parcel-level geocoding, the commercial firm employs a secondary street geocoding technique based on local street centerlines. This second phase of the geocoding process resulted in two sets of points: those from parcel polygons (the centroid of the polygons) and those from street segments (the interpolated location along the segment). Table 2 reports the geocoding match rates based on all valid addresses (i.e., after removing all blank address and post office boxes). Results for in-house address points, in-house parcels, and third-party parcels are grouped together as “parcel geocoded” because the locations can be associated with a specific parcel boundary. Results for in-house streets and third-party streets are grouped together as “street geocoded” because these represent interpolated locations along a street segment and cannot be associated with a specific parcel boundary. Table 2 indicates that in-house address points resulted in the largest number of matches in all three databases, followed by in-house parcels. This reflects the fact that address Zandbergen et al. / RESIDENTIAL PROXIMITY 491 TABLE 2: Geocoding Match Rates Parcel geocoded In-house address points In-house parcels Third-party parcels Subtotal Street geocoded In-house streets Third-party streets Subtotal Total Parcel match rate (%) Street match rate (%) Total match rate (%) Offenders (n = 336) Schools (n = 5,419) Daycares (n = 9,288) 123 90 85 298 1,831 1,297 969 4,097 3,301 2,493 1,822 7,616 16 16 32 330 88.7 9.5 98.2 588 616 1,204 5,301 75.6 22.2 97.8 922 554 1,476 9,092 82.0 15.9 97.9 points and/or parcel data were available for many of the most populated counties. The multistage geocoding proved successful in achieving high parcel-level match rates (≈80%) and very high overall match rates (≈98%). In the case of offenders, only 6 records could not be geocoded (3 recidivists and 3 nonrecidivists), resulting in a final sample of 165 in each category for further analysis. Prior to further analysis, all parcel-geocoded locations as identified in Table 2 were spatially matched to the actual property boundary with which they are associated. This resulted in a set of polygons for all parcel-geocoded locations and a set of points for all street-geocoded locations for use in the proximity analysis. PROXIMITY METRICS The location of each recidivist and nonrecidivist was compared to the locations of schools and daycares. Specifically, the following proximity metrics were determined: distance to nearest daycare (in feet), distance to nearest school (in feet), number of daycares within a 1,000-ft buffer, number of daycares within a 2,500-ft buffer, number of schools within a 1,000-ft buffer, and number of schools within a 2,500-ft buffer. Figure 1 illustrates this methodology and includes the residential location of a single offender as well as the locations of one school and one daycare. The lines represent the shortest straight-line distance between the residence of the offender and the property boundaries of the school and daycare. The 1,000- and 2,500-ft buffers around the offender are also shown. In the example shown in Figure 1, the daycare location falls within the 1,000- and 2,500-ft buffers, and the school falls inside the 2,500-ft buffer but outside the 1,000-ft buffer. The two distance values of 1,000 and 2,500 ft were chosen because Florida statutes currently employ a 1,000-ft buffer for residence restrictions and most of the local ordinances employ a 2,500-ft buffer. In determining these proximity measures, euclidean (or straight-line) distance was used. In the case of polygons, the shortest distance to any of the points along the boundary of the polygon was considered. These interpretations are consistent with the wording of the residence restrictions in Florida statutes and many local ordinances. 492 CRIMINAL JUSTICE AND BEHAVIOR Figure 1: Illustration of the Methodology to Obtain Proximity Metrics Note. 1,000- and 2,500-ft buffers are created around each offender’s residence. Within each buffer polygon, a count was produced of the number of schools and daycare locations. A school or daycare is determined as residing within a particular buffer if any part of the parcel boundary falls inside the buffer polygon. Identical results would be produced if buffers were created around schools and daycares and the number of buffers overlapping each offender location were counted. STATISTICAL ANALYSES The distributions of the number of schools and daycares within distance buffers were summarized in tabular form and compared using a chi-square test. The distances to the nearest daycare and school were graphically summarized as cumulative distribution functions. Differences between the distributions were tested using chi-square and parametric and nonparametric tests of means. The predictive power of distance, controlling for certain risk factors, was assessed through a linear regression model. RESULTS Descriptive statistics of the offender population are displayed in Table 3. It is important to remember that this sample was generated by identifying recidivists and then creating a matched sample of nonrecidivists. The sample is therefore not representative of the sex Zandbergen et al. / RESIDENTIAL PROXIMITY 493 TABLE 3: Descriptive Statistics (n = 330) % Mean Median Mode White Minority Currently married Divorced/separated/widowed Never married Priors (all) Priors (sex) Offender Predator Minor victima Offender age Feet to daycare Within 1,000 of daycare Within 1,500 of daycare Within 2,500 of daycare Feet to school Within 1,000 of school Within 1,500 of school Within 2,500 of school Recidivist 63 37 18 34 48 74 23 96 23 42 61 13 26 51 50 5.45 4.00 4 3.35 2.50 2 33.1 30.0 24 5,182 1,780 4,962 2,442 Standard Deviation 4.18 2.78 12.8 9,116 7,740 a. For recidivists, the victim age category is based on prior victim(s) only, not the new arrests. offender population in Florida, and it consists of a more high-risk group than a randomly selected sample would be. The sample (n = 330) had accrued an average of 5.5 prior arrests for any crime (mode = 4) and 3 prior sex crime arrests (mode = 2). They were predominantly White and unmarried, and one quarter were designated as predators. Almost all (96%) had at least one minor victim in their criminal sexual history. The sample lived an average of 5,182 ft from a daycare and 4,962 ft from a school. More than half lived within 2,500 ft of a school or daycare. Figure 2 shows the distribution of the recidivists (n = 165) and nonrecidivists (n = 165) within Florida. Although many offenders are located in large metropolitan areas (e.g., Miami, Tampa, Orlando, Jacksonville), a substantial number are located in smaller communities and rural areas. Some of the least populated counties in Florida, however, had no offenders. The general pattern that emerges from Figure 2 is that both recidivists and nonrecidivists are located throughout the state and not concentrated in a single area. FACILITY COUNTS WITHIN BUFFER DISTANCES Counts of the number of daycares and schools within 1,000-ft and 2,500-ft buffers around offenders are summarized in Table 4. Manual inspection of the distributions suggests very small differences. For example, when considering a buffer of 1,000 ft around offenders, 115 out of 165 recidivists have no daycare within this buffer, and 28 have one daycare, whereas 116 out of 165 nonrecidivists have no daycare and 31 have one daycare. Logically, a larger buffer of 2,500 ft results in more offenders having one or more daycares within this buffer, but the differences between the two populations remain small. Differences between the distributions were tested using chi-square. A total of four tests were carried out, each comparing recidivists and nonrecidivists for one type of facility for 494 CRIMINAL JUSTICE AND BEHAVIOR Figure 2: Residential Locations of Recidivists and Nonrecidivists Within Florida one distance value. Consistent with standard practice in chi-square tests, count categories were combined to ensure no observation counts fell below the minimum of five. Results are shown in Table 5. Three of the four tests indicated no significant differences between the distributions of counts for recidivists and nonrecidivists. The only significant difference was found for the count of schools within a 2,500-ft buffer. Although the chi-square test itself does not reveal any particular direction, visual inspection of the results in Table 4 suggests that nonrecidivists are more likely than recidivists to have at least one school within 2,500 ft. Multiple iterations of the chi-square test using only two categories (count = 0 vs. count > 0, count ≤ 1 vs. count > 1, etc.) indicate that the strongest difference between the two populations occurs when comparing the counts for zero or one school within 2,500 ft (103 vs. 128) and more than one school within 2,500 ft (62 vs. 37). This finding confirms that the only statistically significant difference found is the result of nonrecidivists having more schools in close proximity than recidivists. PROXIMITY AND RECIDIVISM The distances to the nearest daycare and school for both populations are plotted as cumulative distribution functions in Figures 3 and 4, respectively. The results for distance to the nearest daycare indicate that there is very little difference in the two distance curves up 495 Nonrecidivists 116 31 12 5 1 0 0 0 0 0 0 0 165 Count 0 1 2 3 4 5 6 7 8 9 10 >10 Sum 115 28 12 7 1 1 0 0 0 1 0 0 165 Recidivists Number of Daycares Within 1,000 Ft Recidivists 57 35 19 21 15 8 6 1 1 1 1 1 165 Nonrecidivists 65 30 14 17 13 8 7 4 3 1 0 3 165 Number of Daycares Within 2,500 Ft TABLE 4: Counts of Daycares and Schools Within Buffers Around Offenders 123 26 13 2 1 0 0 0 0 0 0 0 165 Nonrecidivists 127 25 10 2 1 0 0 0 0 0 0 0 165 Recidivists Number of Schools Within 1,000 Ft 68 35 35 12 7 7 1 0 0 0 0 0 165 Nonrecidivists 77 51 21 11 3 1 1 0 0 0 0 0 165 Recidivists Number of Schools Within 2,500 Ft 496 CRIMINAL JUSTICE AND BEHAVIOR TABLE 5: Results of Chi-Square Tests for Counts of Daycares and Schools Within Buffers When Comparing Recidivists to Nonrecidivists c2 Test Daycares within 1,000 ft 1.930 Daycares within 2,500 ft 10.581 Schools within 1,000 ft 0.858 Schools within 2,500 ft 35.496 df Two-Tailed p Value 3 6 2 4 .587 .102 .651 <.001 100 90 Non-Recidivists Recidivists Cumulative Frequency (%) 80 70 60 50 40 30 20 10 0 0 2,000 4,000 6,000 8,000 10,000 12,000 14,000 16,000 18,000 20,000 Distance to Nearest Daycare (feet) Figure 3: Cumulative Distribution Function of Distance to Nearest Daycare until approximately 2,000 ft, indicating that recidivists and nonrecidivists are located at very similar distances when considering these shorter distances. At greater distances, the curve for recidivists is above the curve for nonrecidivists, indicating that a larger proportion of recidivists live between approximately 2,500 and 4,000 ft. At greater distances, the difference gets smaller again. The results for the distance to nearest school indicate that the curve for recidivists falls below the curve for nonrecidivists up until approximately 3,500 ft, indicating that a smaller proportion of recidivists is located close to schools at these distances. At greater distances, the curve for recidivists exceeds the curve for nonrecidivists, indicating that a larger proportion of recidivists live between approximately 3,500 and 10,000 ft. The curves become very similar at greater distances. Statistical testing is necessary to determine the significance of the differences between the curves in Figures 3 and 4. A common test for comparing these distributions is the Kolmogorov-Smirnov test. However, the Kolmogorov-Smirnov test determines the maximum differences between the curves, and it is clear from Figures 1 and 2 that this maximum difference occurs at fairly large distance values (approximately 4,000 ft for daycares Zandbergen et al. / RESIDENTIAL PROXIMITY 497 100 90 Non-Recidivists Recidivists Cumulative Frequency (%) 80 70 60 50 40 30 20 10 0 0 2,000 4,000 6,000 8,000 10,000 12,000 14,000 16,000 18,000 20,000 Distance to Nearest School (feet) Figure 4: Cumulative Distribution Function of Distance to Nearest School and 8,000 ft for schools), which fall outside of the values of interest. Therefore, differences were tested using parametric and nonparametric tests of means as well as chi-square tests for specific distance values of interest. To assess whether sex offenders who lived closer to schools or daycares were more likely to reoffend sexually than those who lived farther away, we utilized two-tailed t tests to compare the mean distance that recidivists and nonrecidivists lived from schools and daycares and found no significant differences between the groups (see Table 6). Nonrecidivists lived slightly closer to daycares, and recidivists lived slightly closer to schools, but neither difference was statistically significant, indicating that these differences were not more than would be expected by chance. In other words, sex offenders who lived in closer proximity to schools and daycares were no more likely to reoffend than those who lived farther away. Because the distributions did not conform to all the assumptions of parametric comparisons of means, we performed a Mann-Whitney u test, a nonparametric test used for two samples measured on an ordinal scale (Mann & Whitney, 1947; Vogt, 2005). Again, there were no significant differences between recidivists and nonrecidivists in the distances they lived from schools (p = .485) and daycares (p = .934). We also compared the proportions of recidivists and nonrecidivists who lived within common buffer zones using chi-square analyses (see Table 7). In these analyses, we tested three distances: the 1,000- and 2,500-ft zones used in previous analyses for the reasons stated above, and a distance zone of 1,500 ft—the distance designated in proposed legislation in 2008 in Florida for expanding the statewide buffer zone. Again, no significant differences were found, indicating that recidivists were not more likely to live within 1,000, 1,500, or 2,500 ft of schools or daycares than nonrecidivists. We also examined the bivariate correlations between proximity and recidivism. There was a virtually nonexistent association between reoffending and proximity to schools (r = .004, 498 CRIMINAL JUSTICE AND BEHAVIOR TABLE 6: Mean Distances From Schools and Daycares Standard Standard Recidivist n Mean Deviation Error Mean Feet to daycare Feet to school no yes no yes 165 165 165 165 5144.15 5219.76 5296.75 4627.80 8655.80 9581.04 9029.17 6198.25 t Test (Difference Between Groups) 673.85 745.88 702.92 482.53 –.075 .785 Two-Tailed p Value .940 .433 TABLE 7: Group Comparisons Between Recidivists and Nonrecidivists Based on Distance Percentage of Recidivists Living Proximity Within Within Within Within Within Within 2,500 2,500 1,500 1,500 1,000 1,000 ft ft ft ft ft ft of of of of of of a a a a a a school daycare school daycare school daycare Percentage of Nonrecidivists Living Outside the Buffer Zone Within the Buffer Zone Outside the Buffer Zone 52 38 78 59 90 78 49 62 23 41 10 21 47 39 70 56 85 76 Within the Buffer Zone c2 53 61 30 44 15 24 0.776 0.115 2.687 0.311 1.746 0.431 Two-Tailed p Value .378 .734 .102 .577 .186 .511 Note. df = 1. p = .940) or daycares (r = –.043, p = .433). Keeping in mind that the sample was matched on relevant risk factors (prior offenses, age, marital status, predator status), when the distances to schools and daycares were entered along with risk factors into a logistic regression model with recidivism as the dependent variable, neither distance variable was statistically significant (p = .091 and p = .141, respectively). The overall model was not statistically significant (c2 = 5.767, df = 7, Nagelkerke R2 = .024, p = .567), indicating that proximity to schools and daycares, with other risk factors being comparable, explains virtually none of the variation in sexual recidivism. DISCUSSION This study represents a pioneering effort to determine whether evidence exists to support the widespread enactment of residential restriction laws. The results of this study indicate no empirical association between where a sex offender lives and whether he reoffends sexually against a minor (recidivists who reoffended against adults were not included in the current analysis). Sex offenders who lived in closer proximity to schools and daycares were not more likely to reoffend than those who lived farther away. It is important to recognize that our recidivists were defined as those on the registry who reoffended with a new sex offense arrest date in 2004, 2005, or 2006. Nonrecidivists during the follow-up time frame were matched based on the risk factors of the recidivists, and therefore there was no chance of selecting a nonrecidivist with no priors. In other words, neither group included first-time offenders, but recidivists were defined as those who reoffended Zandbergen et al. / RESIDENTIAL PROXIMITY 499 during the time frame in which we could calculate their proximity to schools and daycares. This sample is, therefore, a more high-risk sample than a randomly selected sample would be and was not intended to represent the general sex offender population in Florida. The sample included offenders living in counties throughout the state. Rural counties have a wider dispersion of schools and daycares compared to metropolitan areas, which increased the average distance these offenders lived from the venues of interest. Mean distances to schools and daycares are likely to be closer for offenders living in urban and suburban communities than the average distances found in this study. Several researchers have indicated that more than 90% of residential dwellings in metropolitan areas are located within 2,500 ft of schools and daycares (Chajewski & Mercado, 2008; Zandbergen & Hart, 2006). Because most of these sex offenders are presumably subject to state laws and local ordinances restricting where they may reside, however, it is not surprising that many of them lived outside common buffer zones. Those living within buffer zones might have established their residence prior to the enactment of local ordinances and thus been grandfathered in. Protection of children from sexual predators is an important policy endeavor. Strategies employed to accomplish that objective should therefore be informed by research to enhance the probability of their success. The current data suggest that the expenditure of resources allocated to the implementation and enforcement of residence restrictions does not appear to be justified and might be better targeted toward other methods of community protection. A glaring irony of residence restrictions is that they regulate only where offenders sleep at night and not where they travel during daytime hours when children are more vulnerable to sexual predation. It is therefore perhaps unsurprising that housing restrictions do little to deter reoffending. As applied to sex offenders’ housing, RAT does not appear to be a viable theoretical foundation for residential restriction policies. Living close to a school or daycare does not appear to increase access to children in a way that facilitates recidivism for known sex offenders. RAT might, however, better explain the risk associated with access to youngsters when sex offenders visit places where children are commonly found and where familiarity, authority, and relationships with children can be cultivated. Child safety zones have been enacted in some jurisdictions as an alternative to policies that regulate living arrangements. Child safety zones prevent sex offenders from loitering in places where children congregate (e.g., schools, parks, arcades, pools, ball fields, etc.) without a legitimate reason and prior approval. Such laws serve the purpose of prohibiting known sex offenders from being able to linger in places where they can engage in grooming practices by becoming familiar to children and their parents and developing relationships by which opportunities for sexual abuse become possible. Residence restriction zones create barriers to reentry and inhibit the factors known to contribute to successful reintegration, such as employment, housing stability, prosocial relationships, and civic engagement (Mayzer, Gray, & Maxwell, 2004; Schulenberg, 2007; Willis & Grace, 2008, 2009). When criminal offenders sustain jobs and social bonds, they are more likely to become invested in conformity and community norms. Housing instability, transience, unemployment, and a lack of support systems are known to increase the likelihood of recidivism for criminal offenders in general and sex offenders specifically. Alternatives to residence restrictions, such as loitering zones, are more likely to manage risk while simultaneously removing obstacles to reintegration and facilitating a better chance of a safe return to community settings. 500 CRIMINAL JUSTICE AND BEHAVIOR LIMITATIONS As with any study, the current investigation is not without certain limitations. In general, these limitations are related to (a) the size of the sample, (b) the sampling strategy, (c) measures of certain variables, (d) the types of restriction locations selected, (e) the geocoding techniques implemented, and (f) the analytic approach employed. Each of these limitations is addressed in detail below. One of the limitations of this study is the relatively small sample size that was employed. Several factors influenced the size of the sample. First, the time period considered was relatively short (2004-2006). Second, only those recidivists with reliable demographic and address information were included. Third, only those recidivists who were arrested for a sex offense against a minor were included. Fourth, incomplete geocoding removed a few more cases. Nonetheless, the sample size was sufficient for regression models with the six covariates and for statistical comparisons between recidivists and nonrecidivists. The second limitation is the design employed in the sampling of the nonrecidivists. By creating a stratified random sampling technique based on risk factors and demographic variables, the nonrecidivist population was nearly identical to the recidivist population. Although this allowed for a direct comparison of the proximity metrics, it prevented an analysis of the interaction between risk factors and proximity. A future research study is planned in which recidivists will be compared to a randomly selected sample of nonrecidivists. A third and related limitation is that inherent in the database provided by FDLE was the paucity of data available to us regarding other potential risk factors for recidivism. Along with the risk factors identified in this study, future research should include additional covariates, such as time at large, a measure of housing instability or transience, the influence of urban versus rural locations, victim’s age and gender, and relationship between the offender and the victim. These covariates could be used to better understand the relationship between proximity and recidivism while controlling for other risk factors. A related limitation is that it is not known where the offenders established contact with the victims. However, the purpose of the study was to determine the relationship between recidivism and residential proximity to daycares and schools, independent of whether the contact occurred at those locations. The fourth limitation is that only daycares and schools were considered facilities of interest. Florida statutes include parks, playgrounds, and public school bus stops (for conditional releasees), and many local ordinances include additional locations such as libraries or recreational facilities. However, daycares and schools are among the most commonly used categories in residence restriction laws across the nation. With the exception of public school bus stops, the volume of the other types of facilities is also much lower than for schools and daycares. School bus stops are so plentiful throughout residential areas that almost every resident (offender or not) lives close to one (Zandbergen and Hart, 2006), making their utility in proximity analyses less meaningful. The fifth limitation is that geocoding techniques introduce some amount of positional error. Street geocoding in general can introduce substantial error, and therefore parcel-level geocoding was employed to the extent possible based on available data. Despite the very high proportion of records matched at the parcel level and the very high overall match rate, some amount of error is introduced as a result of incomplete address information (in particular for home-based daycares) and positional error in the geocoding techniques. Nonetheless, Zandbergen et al. / RESIDENTIAL PROXIMITY 501 there is no indication that these errors introduced any form of bias in the comparison of recidivists and nonrecidivists. The final limitation is that relatively simple proximity metrics were used, including the straight-line distance to nearest facility and number of facilities within discrete buffer zones. Such metrics do not account for more complex interactions, such as visibility (e.g., can the offender see the daycare or school from his residence?) or casual contact (e.g., if the offender walks or drives from his house to the nearest major intersection or to his place of work, does he pass a daycare or school?). The metrics employed, however, reflect the language found in current residence restriction laws. CONCLUSION AND POLICY IMPLICATIONS Given the paucity of data suggesting that sex offender residence restrictions prevent recidivism and the growing body of evidence indicating that housing policies increase transience, homelessness, and unemployment, these laws may be contraindicated. The belief that keeping sex offenders far from schools and other child-friendly locations will protect children from sexual abuse appears to be a well-intentioned but flawed premise. The data from this study do not support the widespread enactment of residential restrictions for sexual offenders. The time that police and probation officers spend addressing sex offender housing issues is likely to divert law enforcement resources away from behaviors that truly threaten our communities. REFERENCES Barnes, J. C., Dukes, T., Tewksbury, R., & DeTroye, T. (2009). Predicting the impact of a statewide residence restriction law on South Carolina sex offenders. Criminal Justice Policy Review, 20, 21-43. Blood, P., Watson, L., & Stageberg, P. (2008). State legislation monitoring report. Des Moines, IA: Criminal and Juvenile Justice Planning. Chajewski, M., & Mercado, C. C. (2008). An analysis of sex offender residency restrictions in Newark, New Jersey. Sex Offender Law Report, 9, 1-6. Cohen, L. E., & Felson, M. (1979). Social change and crime rate trends: A routine activity approach. American Sociological Review, 44, 588-608. Colorado Department of Public Safety. (2004). Report on safety issues raised by living arrangements for and location of sex offenders in the community. Denver, CO: Sex Offender Management Board. Duwe, G., Donnay, W., & Tewksbury, R. (2008). Does residential proximity matter? A geographic analysis of sex offense recidivism. Criminal Justice and Behavior, 35, 484-504. Levenson, J. S. (2008). Collateral consequences of sex offender residence restrictions. Criminal Justice Studies, 21, 153-166. Levenson, J. S., & Cotter, L. P. (2005). The impact of sex offender residence restrictions: 1,000 feet from danger or one step from absurd? International Journal of Offender Therapy and Comparative Criminology, 49, 168-178. Levenson, J. S., & Hern, A. (2007). Sex offender residence restrictions: Unintended consequences and community re-entry. Justice Research and Policy, 9, 59-73. Mann, H. B., & Whitney, D. R. (1947). On a test of whether one of two random variables is stochastically larger than the other. Annals of Mathematical Statistics, 18, 50-60. Mayzer, R., Gray, M. K., & Maxwell, S. R. (2004). Probation absconders: A unique risk group? Journal of Criminal Justice, 32, 137-150. Meloy, M. L., Miller, S. L., & Curtis, K. M. (2008). Making sense out of nonsense: The deconstruction of state-level sex offender residence restrictions. American Journal of Criminal Justice, 33, 209-222. Mercado, C. C., Alvarez, S., & Levenson, J. S. (2008). The impact of specialized sex offender legislation on community re-entry. Sexual Abuse: A Journal of Research & Treatment, 20, 188-205. Meredith, T., Speir, J., & Johnson, S. (2007). Developing and implementing automated risk assessments in parole. Justice Research and Policy, 9, 1-21. 502 CRIMINAL JUSTICE AND BEHAVIOR Minnesota Department of Corrections. (2003). Level three sex offenders residential placement issues. St. Paul: Author. Red Bird, B. (2009). Assessing housing availability under Ohio’s sex offender residency restrictions. Columbus: Ohio State University. Schulenberg, J. L. (2007). Predicting noncompliant behavior: Disparities in the social locations of male and female probationers. Justice Research and Policy, 9, 25-57. Special Conditions of Sex Offender Probation, Florida Statute 948.03 (1997). Tewksbury, R., & Mustaine, E. (2008). Where registered sex offenders live: Community characteristics and proximity to possible victims. Victims and Offenders, 3, 86-98. Tewksbury, R., & Mustaine, E. (in press-a). Collateral consequences and community re-entry for registered sex offenders with child victims: Are the challenges even greater? Journal of Offender Rehabilitation. Tewksbury, R., & Mustaine, E. (in press-b). Stress and collateral consequences for registered sex offenders. Journal of Public Management and Social Policy. Tewksbury, R., Mustaine, E., & Stengel, K. M. (2008). Examining rates of sexual offenses from a routine activities perspective. Victims and Offenders, 3, 75-85. Tewksbury, R., & Mustaine, E. E. (2006). Where to find sex offenders: An examination of residential locations and neighborhood conditions. Criminal Justice Studies, 19, 61-75. Vogt, W. P. (2005). Dictionary of statistics and methodology: A nontechnical guide for the social sciences (3rd ed.). Thousand Oaks, CA: Sage. Walker, J. T., Golden, J. W., & VanHouten, A. C. (2001). The geographic link between sex offenders and potential victims: A routine activities approach. Justice Research and Policy, 3, 15-33. Williams, F. P., McShane, M. D., & Dolny, M. H. (2000). Predicting parole absconders. The Prison Journal, 80, 24-38. Willis, G., & Grace, R. (2009). Assessment of community reintegration planning for sex offenders: Poor planning predicts recidivism. Criminal Justice and Behavior, 36, 494-512. Willis, G. M., & Grace, R. C. (2008). The quality of community reintegration planning for child molesters: Effects on sexual recidivism. Sexual Abuse: A Journal of Research & Treatment, 20, 218-240. Zandbergen, P. A. (2008). A comparison of address point, parcel and street geocoding techniques. Computers, Environment and Urban Systems, 32, 214-232. Zandbergen, P. A. (2009). Geocoding quality and implications for spatial analysis. Geography Compass, 3, 647-680. Zandbergen, P. A., & Hart, T. (2009). Geocoding accuracy considerations in determining residency restrictions for sex offenders. Criminal Justice Policy Review, 20, 62-90. Zandbergen, P. A., & Hart, T. C. (2006). Reducing housing options for convicted sex offenders: Investigating the impact of residency restriction laws using GIS. Justice Research and Policy, 8, 1-24. Zgoba, K., Levenson, J. S., & McKee, T. (2009). Examining the impact of sex offender residence restrictions on housing availability. Criminal Justice Policy Review, 20, 91-110. Paul A. Zandbergen is an associate professor in the Department of Geography at the University of New Mexico in Albuquerque. He is a geographic information scientist with interests in both the fundamentals of geographic information science and the applications of geospatial technologies to several fields, including criminal justice, public health, spatial ecology, and water resources. He has published several previous studies on sex offender residency restrictions. Jill S. Levenson is an associate professor of human services at Lynn University in Boca Raton, Florida. Her numerous publications include studies investigating the selection of sex offenders for civil commitment, the impact and effectiveness of community notification and residence restrictions laws, and the engagement of sex offenders in clinical treatment programs. She has also coauthored three books about the treatment of sex offenders and their families. Timothy C. Hart is an assistant professor in the Department of Criminal Justice at the University of Nevada, Las Vegas. He also serves as the director of the Center for the Analysis of Crime Statistics. His areas of interest include survey research, applied statistics, geographic information systems, and victimization. Prior to joining the faculty at the University of Nevada, Las Vegas, he worked as a statistician for the Bureau of Justice Statistics, a program analyst for the Drug Enforcement Administration, and a research analyst for the Hillsborough County Sheriff’s Office.


