

Wa Office of Financial Management Perceptions of Neighborhood Crime 2008 2009
Download original document:
Document text
Document text
This text is machine-read, and may contain errors. Check the original document to verify accuracy.
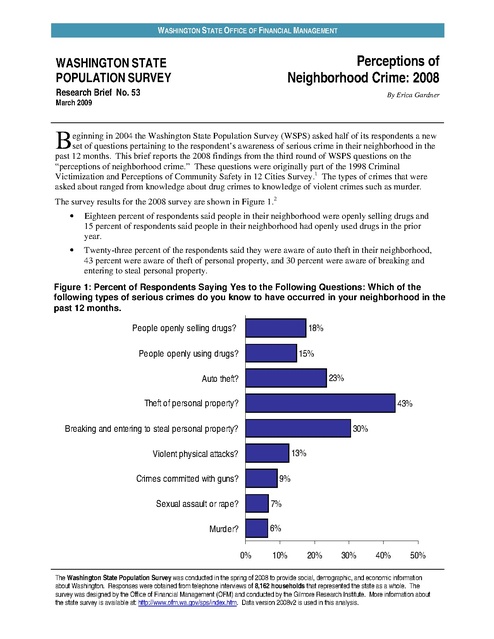
WASHINGTON STATE OFFICE OF FINANCIAL MANAGEMENT

Perceptions of
Neighborhood Crime: 2008

WASHINGTON STATE
POPULATION SURVEY
Research Brief No. 53

By Erica Gardner

March 2009

B

eginning in 2004 the Washington State Population Survey (WSPS) asked half of its respondents a new
set of questions pertaining to the respondent’s awareness of serious crime in their neighborhood in the
past 12 months. This brief reports the 2008 findings from the third round of WSPS questions on the
“perceptions of neighborhood crime.” These questions were originally part of the 1998 Criminal
Victimization and Perceptions of Community Safety in 12 Cities Survey.1 The types of crimes that were
asked about ranged from knowledge about drug crimes to knowledge of violent crimes such as murder.
The survey results for the 2008 survey are shown in Figure 1.2
·

Eighteen percent of respondents said people in their neighborhood were openly selling drugs and
15 percent of respondents said people in their neighborhood had openly used drugs in the prior
year.

·

Twenty-three percent of the respondents said they were aware of auto theft in their neighborhood,
43 percent were aware of theft of personal property, and 30 percent were aware of breaking and
entering to steal personal property.

Figure 1: Percent of Respondents Saying Yes to the Following Questions: Which of the
following types of serious crimes do you know to have occurred in your neighborhood in the
past 12 months.

People openly selling drugs?

18%

People openly using drugs?

15%
23%

Auto theft?
Theft of personal property?

43%

Breaking and entering to steal personal property?

30%
13%

Violent physical attacks?
Crimes committed with guns?

9%

Sexual assault or rape?

7%

Murder?

6%
0%

10%

20%

30%

40%

50%

The Washington State Population Survey was conducted in the spring of 2008 to provide social, demographic, and economic information
about Washington. Responses were obtained from telephone interviews of 8,162 households that represented the state as a whole. The
survey was designed by the Office of Financial Management (OFM) and conducted by the Gilmore Research Institute. More information about
the state survey is available at: http://www.ofm.wa.gov/sps/index.htm. Data version 2008v2 is used in this analysis.

RESEARCH BRIEF NO. 53

·

OFM FORECASTING DIVISION

Thirteen percent of respondents reported violent physical attacks had occurred in their
neighborhood in the prior year, nine percent reported crimes committed with guns, seven percent
reported sexual assault or rape, and six percent reported murder.

Awareness of Crime in Neighborhood by Region
The 2008 WSPS allows analysis by ten regions. The names used for each of those regions and the names
of the counties included in each region are as follows:
·
·
·
·
·
·
·
·
·
·

North Puget (Island, San Juan, Skagit, Whatcom)
West Balance (Clallam, Cowlitz, Grays Harbor, Jefferson, Klickitat, Lewis, Mason, Pacific
Skamania, Wahkiakum)
King County (King)
Puget Metro (Kitsap, Thurston)
Clark County (Clark)
East Balance (Adams, Asotin, Chelan, Columbia, Douglas, Ferry, Garfield, Grant, Kittitas,
Lincoln, Okanogan, Pend Oreille, Stevens, Walla Walla, Whitman)
Spokane County (Spokane)
Yakima-Tri Cities (Benton, Franklin, Yakima)
Snohomish County (Snohomish)
Pierce County (Pierce)

Some regions differed from the state in the percentage of respondents saying that specific crimes have
occurred in their neighborhood (see Table 1). Differences mentioned are statistically different at the five
percent level unless mentioned otherwise.3

Table 1: Percent of Respondents Saying the Following Crimes Have Occurred In Their Neighborhood By
Region
Breaking
and
People People
Sexual
Violent
Theft of
Crimes
entering to
openly openly Auto
assault
physical committed
personal
Region
Murder?
steal
selling using theft?
or
attacks? with guns?
property?
personal
drugs? drugs?
rape?
property?
North Puget
18%
17%
16%
36%
23%
9%
5%
7%
2%
West Balance

22%

18%

15%

37%

27%

9%

4%

5%

4%

King County

16%

14%

31%

47%

35%

15%

11%

7%

8%

Puget Metro

15%

12%

12%

36%

26%

10%

3%

6%

4%

Clark County

15%

10%

17%

38%

22%

8%

5%

6%

3%

East Balance

21%

17%

14%

40%

28%

17%

8%

8%

5%

Spokane County

14%

13%

21%

44%

24%

13%

9%

6%

6%

Yakima-Tri Cities
Snohomish
County
Pierce County

18%

18%

21%

40%

32%

11%

9%

8%

8%

19%

16%

32%

50%

39%

11%

10%

7%

6%

18%

16%

27%

47%

29%

14%

15%

5%

9%

State

18%

15%

23%

43%

30%

13%

9%

7%

6%

2

RESEARCH BRIEF NO. 53

·

·

·

·

·

·

·

·

OFM FORECASTING DIVISION

There was no statistically significant variation between the state and each of the 10 regions in the
perception of people openly selling or using drugs in their neighborhood.
Variation in the perception of auto theft in the neighborhood roughly corresponded with the actual
rate of motor vehicle theft in each region according to the 2007 Uniform Crime Reports (UCR)4
(See Table 1 and Appendix A). Puget Metro, East Balance, West Balance, North Puget and Clark
County were the least likely to report auto theft in their neighborhood and had the lowest rates of
auto theft (per 1,000 population). These five regions’ reports of auto theft in their neighborhood
were significantly lower than the state report of auto theft. Residents of both King and Snohomish
counties were significantly more likely to report auto theft in their neighborhood than residents of
the state overall.
Puget Metro residents were less likely to report personal property theft in their neighborhoods than
Washington State residents overall, and King and Snohomish counties were more likely to report
personal property theft in their neighborhoods.
North Puget, Clark County and Spokane County residents were less likely and King County and
Snohomish County residents were more likely than Washington State residents overall to report
breaking and entering to steal personal property had occurred in their neighborhoods.
There were no statistically significant differences between the state and each of the 10 regions in
respondent reports of violent physical attacks in their neighborhoods.
Residents of West Balance, Puget Metro and Clark County were less likely to report crimes
committed with guns in their neighborhoods compared to Washington State residents overall. King
County and Pierce County residents were more likely to report crimes committed with guns in their
neighborhoods compared to Washington State residents overall.
There were no statistical differences between the state and each of the 10 regions in respondent
reports of sexual assault or rape.
A higher percentage of King County residents reported murder in their neighborhoods compared to
the state overall. (It appears that Pierce County and Yakima-Tri Cities also reported murder in their
neighborhoods at a higher rate, but these results were not statistically different from the
Washington State overall estimate).

Trends in the Perceptions of Crime5
Selling Drugs in Yakima-Tri Cities Region
Over the past six years there have been some changes in the Yakima-Tri Cities region in the perception of
people openly selling drugs. Compared to the 2004 WSPS results, the 2008 results show that a
significantly higher percentage of respondents reported people openly selling drugs in their neighborhood.
But the two year change shows a decline in the reports of people openly selling drugs. The percentage of
respondents who reported people were openly selling drugs in their neighborhoods significantly declined
from 26 percent in 2006 to 18 percent in 2008.

Table 2: Percent of Yakima-Tri Cities Respondents Saying the Following Crimes
Have Occurred In Their Neighborhoods

People openly selling drugs?

WSPS
2004 2006 2008
12% 26% 18%

3

RESEARCH BRIEF NO. 53

OFM FORECASTING DIVISION

Auto Theft
There were statistically significant declines in the percentage of WSPS respondents reporting auto theft in
their neighborhoods between the 2006 and 2008. These declines occurred statewide and in three regions
(see Table 3). The statewide drop in perception of auto theft in the neighborhood was just over three
percentage points. The greatest percentage point drop in reports of neighborhood auto theft was in Clark
county (eight percentage points), followed by West Balance (seven percentage points) and King County
(five percentage points). There were no statistically significant changes between the 2004 and 2008
estimates.
Respondents’ reports of auto theft in their neighborhoods roughly correspond to the trends seen in the
actual number and rate of auto thefts statewide and in these three regions according to the UCR.4 Both the
number and rate of motor vehicle thefts peaked statewide and in both the West Balance and King County
regions in 2005 before declining below the 2003 rates and absolute numbers in 2007. Clark County
experienced a decline in motor vehicle thefts between 2003 and 2006, before leveling off between 2006 and
2007.

Table 3: Percent of Respondents Reporting Auto Theft in their Neighborhoods,
Compared to Number and Rate of Crimes Reported in the UCR
WSPS

Region
State
West Balance
King County
Clark County

2004
24%
20%
32%
21%

Percent
2006
27%
21%
36%
25%

Uniform Crime Reports (UCR)

2008
23%
15%
31%
17%

Number of Crimes
2003 2004 2005 2006 2007
40,351 43,070 49,151 44,967 36,932
1,774 1,688 2,031 1,670 1,421
19,116 19,939 21,883 18,806 13,979
2,010 1,981 1,908 1,612 1,640

Rate (per 1,000)
2003 2004 2005 2006 2007
6.7 7.0
7.9
7.1
5.7
4.1 3.9
4.7
3.8
3.2
10.7 11.0 12.0 10.1 7.4
5.4 5.2
4.9
4.0
4.0

Breaking and Entering to Steal Personal Property
Between 2004 and 2008 in both the North Puget and Spokane County regions there were statistically
significant changes in respondent reports of breaking and entering to steal property in their neighborhoods
(see Table 4). Thirty-six percent of North Puget respondents reported breaking and entering to steal
personal property had occurred in their neighborhoods in 2004 compared to only 23 percent in 2008. A
similar decline occurred in the actual rate of burglaries in the North Puget region. In North Puget, 11.2
burglaries occurred per 1,000 population in 2003 compared to 8.2 burglaries per 1,000 population in 2007.
In Spokane, 33 percent of respondents reported breaking and entering to steal personal property in 2004,
compared to 24 percent in 2008. A similar decline in the rate of burglaries also occurred between 2003 and
2007. In 2003, 11 burglaries occurred per 1,000 population in Spokane compared to 7.4 burglaries in 2007.
(Note: While the percentage of respondents reporting breaking and entering in their neighborhoods
declined between 2006 and 2008, these changes were not statistically significant).

Table 4: Percent of Respondents Reporting Breaking and Entering to Steal Personal Property in
their Neighborhoods, Compared to Number and Rate of Crimes Reported in the UCR
WSPS
Uniform Crime Reports (UCR)
Percent
Number of Crimes
Rate (per 1,000)
Region
2004
2006 2008
2003 2004 2005 2006 2007 2003 2004 2005 2006 2007
31%
23%
North Puget
36%
3,563 3,281 4,069 3,624 3,250 11.2 10.1 10.6 9.3
8.2
Spokane County
33%
29%
24%
4,677 5,323 3,952 3,547 3,343 11.0 12.3 9.1
8.0
7.4
* The UCR comparison data is burglary (the unlawful entry, or attempted entry, of a structure to commit a felony or a
theft).
4

RESEARCH BRIEF NO. 53

OFM FORECASTING DIVISION

Theft of Personal Property
North Puget respondents’ reports of theft of personal property in 2008 were significantly lower than they
were in 2004 (see Table 5). In 2004, 46 percent of North Puget residents reported theft of personal
property in their neighborhoods, compared to only 36 percent in 2008. While the two year change was not
statistically significant (i.e. between 2006 and 2008), the trend is consistent with the change registered
across the four year period. The decline in theft of personal property reports corresponds to the decline in
the rate of theft in the North Puget region between 2004 and 2007. In 2004 there were 41.2 thefts per 1,000
in population in the North Puget region, compared to 31.6 thefts per 1,000 in population in 2007.

Table 5: Percent of Respondents Reporting Theft of Personal Property in their
Neighborhoods, Compared to Number and Rate of Crimes Reported in the UCR
WSPS
Percent

Uniform Crime Reports (UCR)
Number of Crimes
Rate (per 1,000)

Region
2004 2006 2008
2003 2004 2005 2006 2007 2003 2004 2005 2006 2007
North Puget
46% 42% 36% 12,102 13,384 14,963 12,977 12,560 38.0 41.2 39.0 33.2 31.6
* The UCR comparison data is theft (the unlawful taking, carrying, leading, or riding away of property from the
possession or constructive possession of another).

Crimes Committed with Guns
The percentage reporting crimes committed with guns in Clark County was 10 percent in 2006 (see Table
6). The percent reporting crimes committed with guns dropped five percentage points from 10 percent in
2006 to five percent in 2008. The change in the percent of respondents reporting crimes with guns in their
neighborhoods in 2004 and in 2008 was not statistically significant. Unfortunately the UCR data does not
have a similar crime category to compare these findings to actual crime statistics.

Table 6: Percent of Respondents Reporting Crimes Committed with Guns in
their Neighborhoods

Region
Clark County

WSPS
Percent
2004 2006 2008
8% 10% 5%

Murder
Murder is a relatively rare event. North Puget and Clark County regions each had fewer than 13 murders
each year between 2003 and 2007 (see Table 7). According to the UCR for both regions the murder rate
peaked in 2004 and 2005. Respondent reports of murder in their neighborhoods also peaked in 2004 and
2006 for the North Puget region and in 2006 for the Clark County region. There was a significant decline
in the percentage of North Puget residents reporting murder in their neighborhoods between 2004 and 2008
(although reflecting almost the same change in estimates, the decline between 2006 and 2008 was not
significant). There was also a significant decline in the percentage of respondents in Clark County who
reported murder in their neighborhoods between 2006 and 2008. It appears that the perception of murder in
the neighborhood may have returned to 2004 levels even though in 2007 murders had increased by four
from the prior year.

5

RESEARCH BRIEF NO. 53

OFM FORECASTING DIVISION

Table 7: Percent of Respondents Reporting Murder in their Neighborhoods,
Compared to the Number and Rate of Murder Reported in the UCR

Region
North Puget
Clark County

WSPS
Percent
2004 2006 2008
5%
5%
2%
4% 10% 3%

Uniform Crime Reports (UCR)
Number of Crimes
Rate (per 100,000)
2003 2004 2005 2006 2007 2003 2004 2005 2006
4
7
9
3
4
1.3 2.2
2.3
0.8
4
12
12
5
9
1.1 3.1
3.1
1.2

__________________
Notes:
1.
2.
3.
4.
5.

Source: Smith, Steven K., Steadman, Greg W., Minton, Todd D., Townsend, Meg. 1999. “Criminal Victimization and
Perceptions of Community Safety in 12 Cities, 1998.” NCJ 173940, United States Department of Justice, Bureau of
Justice Statistics
The number of respondents answering each question varies from 3,737 to 3,918 due to missing values.
The Rao-Scott Chi-Squared test was used to test whether regional results were significantly different from the state
results.
Uniform Crime Report data was obtained from http://www.ofm.wa.gov/criminaljustice/default.asp on March 3, 2009. The
data was summarized into the WSPS regions for comparison.
The Rao-Scott Chi-Squared test was used to test whether one survey year was significantly different from another.

__________________

Appendix
Table A: 2007 Uniform Crime Reports
Thefts or Attempted Thefts in Washington State by Region

Region
North Puget
West Balance
King County
Puget Metro
Clark County
East Balance
SpokaneCounty
Yakima-Tri Cities
Snohomish County
Pierce County
State

2007 Uniform Crime Reports
Number of
Thefts or
Attempted
Thefts of a
Motor Vehicle
Motor
Theft Rate (Per
Vehicle
1,000 Population)
1,028
2.6
1,421
3.2
13,979
7.4
1,127
2.3
1,640
4.0
1,023
2.1
2,742
6.1
2,457
5.3
4,973
7.4
6,542
8.3
36,932
5.7

_____________________________
To obtain this publication in an alternative format, contact the Washington State
Office of Financial Management at (360) 902-0599.

6

2007
1.0
2.2


