

BJS Prison Population Report, 2012
Download original document:
Document text
Document text
This text is machine-read, and may contain errors. Check the original document to verify accuracy.
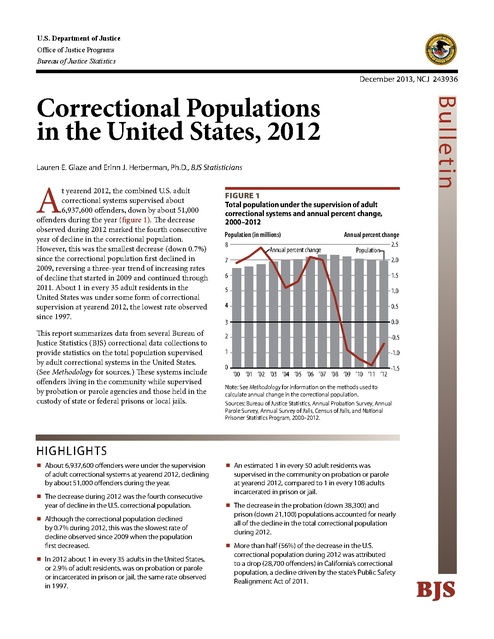
U.S. Department of Justice Office of Justice Programs Bureau of Justice Statistics December 2013, NCJ 243936 Bul l etin Correctional Populations in the United States, 2012 Lauren E. Glaze and Erinn J. Herberman, Ph.D., BJS Statisticians A t yearend 2012, the combined U.S. adult correctional systems supervised about 6,937,600 offenders, down by about 51,000 offenders during the year (figure 1). The decrease observed during 2012 marked the fourth consecutive year of decline in the correctional population. However, this was the smallest decrease (down 0.7%) since the correctional population first declined in 2009, reversing a three-year trend of increasing rates of decline that started in 2009 and continued through 2011. About 1 in every 35 adult residents in the United States was under some form of correctional supervision at yearend 2012, the lowest rate observed since 1997. This report summarizes data from several Bureau of Justice Statistics (BJS) correctional data collections to provide statistics on the total population supervised by adult correctional systems in the United States. (See Methodology for sources.) These systems include offenders living in the community while supervised by probation or parole agencies and those held in the custody of state or federal prisons or local jails. Figure 1 Total population under the supervision of adult correctional systems and annual percent change, 2000–2012 Population (in millions) 8 Annual percent change 7 Annual percent change 2.5 Population 2.0 6 1.5 5 1.0 4 0.5 3 0.0 2 -0.5 1 -1.0 0 ‘00 ‘01 ‘02 ‘03 ‘04 ‘05 ‘06 ‘07 ‘08 ‘09 ‘10 ‘11 ‘12 -1.5 Note: See Methodology for information on the methods used to calculate annual change in the correctional population. Sources: Bureau of Justice Statistics, Annual Probation Survey, Annual Parole Survey, Annual Survey of Jails, Census of Jails, and National Prisoner Statistics Program, 2000–2012. HIGHLIGHTS About 6,937,600 offenders were under the supervision of adult correctional systems at yearend 2012, declining by about 51,000 offenders during the year. The decrease during 2012 was the fourth consecutive year of decline in the U.S. correctional population. Although the correctional population declined by 0.7% during 2012, this was the slowest rate of decline observed since 2009 when the population first decreased. In 2012 about 1 in every 35 adults in the United States, or 2.9% of adult residents, was on probation or parole or incarcerated in prison or jail, the same rate observed in 1997. An estimated 1 in every 50 adult residents was supervised in the community on probation or parole at yearend 2012, compared to 1 in every 108 adults incarcerated in prison or jail. The decrease in the probation (down 38,300) and prison (down 21,100) populations accounted for nearly all of the decline in the total correctional population during 2012. More than half (56%) of the decrease in the U.S. correctional population during 2012 was attributed to a drop (28,700 offenders) in California’s correctional population, a decline driven by the state’s Public Safety Realignment Act of 2011. BJS By yearend 2012, the rate of offenders under correctional supervision dropped below the 2000 level About 2,870 offenders per 100,000 U.S. adult residents (or about 2.9% of adults) were under some form of correctional supervision at yearend 2012 (table 1). The correctional supervision rate dropped below 2,900 per 100,000 adult residents for the first time since 2000, which was similar to the rate last observed in 1997 (2,860 per 100,000) when about 1.2 million fewer offenders were under correctional supervision (5.7 million). After peaking in 2007 at 3,210 offenders per 100,000 adult residents, the rate of correctional supervision declined each year. Slightly more than half (52%) of the decrease from 2007 to 2011 was attributed to the decrease in the number of offenders under correctional supervision during the period. Less than half (48%) of the decline was due to the increase in the number of adult residents in the United States (not shown in table).1 In contrast, from 1See Methodology for information about the method used to decompose the decline in the correctional supervision rate since 2007. 2011 to 2012 the increase in the adult resident population accounted for most (63%) of the decline in the correctional supervision rate, while 37% was due to the decline in the number of offenders under correctional supervision. About 1,980 offenders per 100,000 adult residents were supervised in the community on probation or parole in 2012, a drop from 2,010 per 100,000 in 2011. By yearend 2012, the community supervision rate fell below 2,000 per 100,000 adult residents for the first time since 2000, which was similar to the rate last observed in 1997 (1,990 per Table 1 U.S. adult residents supervised by adult correctional systems, 2000–2012 Year 2000 2001 2002 2003 2004 2005 2006 2007 2008 2009 2010 2011 2012 Total population supervised by adult correctional systemsa Number supervised U.S. adult residents per 100,000 U.S. adult under correctional residentsc supervision— 3,060 1 in 33 3,080 1 in 32 3,120 1 in 32 3,150 1 in 32 3,170 1 in 32 3,160 1 in 32 3,190 1 in 31 3,210 1 in 31 3,160 1 in 32 3,090 1 in 32 2,990 1 in 33 2,920 1 in 34 2,870 1 in 35 Community supervision population Number on probation or parole per 100,000 U.S. adult residents on U.S. adult residentsc probation or parole— 2,160 1 in 46 2,180 1 in 46 2,200 1 in 45 2,220 1 in 45 2,230 1 in 45 2,210 1 in 45 2,230 1 in 45 2,240 1 in 45 2,200 1 in 45 2,150 1 in 47 2,070 1 in 48 2,010 1 in 50 1,980 1 in 50 Incarcerated populationb Number incarcerated in U.S. adult residents prison or jail per 100,000 incarcerated in prison U.S. adult residentsc or jail— 920 1 in 109 920 1 in 109 940 1 in 106 950 1 in 105 970 1 in 103 980 1 in 102 1,000 1 in 100 1,000 1 in 100 1,000 1 in 100 980 1 in 102 960 1 in 104 940 1 in 107 920 1 in 108 Note: Rates were estimated to the nearest 10. Estimates may not be comparable to previously published BJS reports due to updated information or rounding. aIncludes offenders in the community under the authority of probation or parole agencies and those held in the custody of state or federal prisons or local jails. bIncludes inmates held in the custody of state or federal prisons, local jails, or privately operated facilities. cRates were computed using the U.S. adult resident population estimates from the U.S. Census Bureau for January 1 of the following year. Sources: Adult correctional population estimates are based on the Bureau of Justice Statistics' Annual Probation Survey, Annual Parole Survey, Annual Survey of Jails, Census of Jails, and National Prisoner Statistics Program, 2000–2012. The adult resident population estimates are based on the U.S. Census Bureau’s National Intercensal Estimates, 2000–2011, and unpublished adult resident population estimates on January 1, 2012, and January 1, 2013. Official BJS measure of the U.S. prison population BJS’s official measure of the prison population is the count of prisoners under the jurisdiction or legal authority of state or federal adult correctional officials (1,570,400 in 2012), which is reported in Prisoners in the United States, 2012: Trends in Admissions and Releases, 1991-2012, BJS web, NCJ 243920, December 2013. These prisoners may be held in public and privately operated prison or jail facilities, outside of the state, or in the federal prison system. The prison population reported in table 2 and appendix table 1 is the number held in custody or physically housed in state (1,267,000 in 2012) or federal (216,900 in 2012) adult correctional facilities, regardless of which entity has legal authority over the prisoners. The custody population includes state or federal prisoners held in privately operated facilities. The difference between the number of prisoners in custody and the number under jurisdiction is the number of state or federal prisoners held in the custody of local jails, inmates held in other states, inmates out to court, and those in transit from one jurisdiction of legal authority to the custody of a confinement facility outside that jurisdiction. BJS uses the count of the number of prisoners held in custody to avoid double counting prisoners held in local jails. co r r e c t i o n a l p o p u l at i o n s i n t h e u n i t e d s tat e s , 2012 | D e c e m b e r 2013 2 100,000). The incarceration rate also decreased between 2011 (940 inmates per 100,000 adults) and 2012 (920 per 100,000). About 1 in every 108 adults was incarcerated in prison or jail at yearend 2012, compared to about 1 in every 50 under community supervision. During 2012, the community supervision and incarcerated populations had the smallest decreases since 2009 About 4,781,300 offenders were supervised in the community on probation (3,942,800) or parole (851,200) at yearend 2012, representing about 7 in 10 offenders under correctional supervision (table 2).2 In comparison, about 3 in 10 offenders (or 2,228,400) under correctional supervision were in the custody of state or federal prisons (1,483,900) or local jails (744,500).3 2The total community supervision population excludes parolees who were also on probation to avoid double counting offenders. See table 7 and Methodology. The decline of about 40,500 offenders under community supervision during 2012 represented the smallest decrease in this population since it first decline in 2009 (down 46,300). From 2009 (down 0.9%) to 2011 (down 1.5%), the rate of decline in the community supervision population increased. However, during 2012, the community supervision population decreased by about half (down 0.8%) of the rate of decline compared to the previous year. Similar changes occurred in the incarcerated population, as the decrease of 12,100 inmates during 2012 was the smallest decline observed since 2009 (down 16,400) when the population first declined. The rate of decline in the incarcerated population slowed to 0.5% during 2012, reversing a trend of increasing rates of decline from 2009 (down 0.7%) to 2011 (down 1.3%). 3See text box on Official BJS measure of the U.S. Most of the decrease in the community supervision population during 2012 was attributed to the decline in the number of probationers. While the probation population declined by 1.0% (down 38,300 probationers) during 2012, the parole population remained relatively stable (down 0.1% or 500 parolees). During 2012, the decrease in the incarcerated population resulted from the drop in the number of inmates held in the custody of state or federal prisons (down 1.4% or 21,100 prisoners), as the number of inmates held in local jails (up 1.2% or 8,900 inmates) increased. The state prison population (down 1.8% or 23,200 prisoners) decreased during 2012, accounting for the entire decline in the U.S. custody prison population (appendix table 1). The increase in the federal prison population (up 1.0% or 2,100) slightly offset the total decline in the U.S. prison population. prison population, for the difference between the jurisdiction and custody prison population counts. Jurisdiction counts are the official BJS measure of the prison population as reported in Prisoners in the United States, 2012: Trends in Admissions and Releases, 1991-2012, BJS web, NCJ 243920, December 2013. Table 2 Estimated number of persons supervised by adult correctional systems, by correctional status, 2000, 2005, 2010–2012 Year 2000 2005 2010 2011 2012 Average annual percent change, 2000–2011 Percent change, 2011–2012f Total correctional populationa 6,461,000 7,050,400 7,079,500 6,978,500 6,937,600 Totala,c 4,565,100 4,946,800 4,887,900 4,814,200 4,781,300 Community supervision Probation 3,839,500 4,162,500 4,055,500 3,971,300 3,942,800 Parole 725,500 784,400 840,700 853,900 851,200 Total 1,938,500 2,195,000 2,270,100 2,240,600 2,228,400 Incarceratedb Jaild 621,100 747,500 748,700 735,600 744,500 Prisone 1,317,300 1,447,400 1,521,400 1,505,000 1,483,900 0.7% 0.5% 0.3% 1.5% 1.3% 1.5% 1.2% -0.7% -0.8% -1.0% -0.1% -0.5% 1.2% -1.4% Note: Estimates were rounded to the nearest 100 and may not be comparable to previously published BJS reports due to updated information or rounding. Totals include estimates for nonresponding jurisdictions. See Methodology. Total community supervision, probation, parole, and prison custody estimates are for December 31; jail population estimates are for the last weekday in June. aEstimates were adjusted to account for some offenders with multiple correctional statuses. See Methodology. bIncludes local jail inmates and prisoners held in the custody of state or federal prisons or privately operated facilities. cIncludes some offenders held in a prison or jail but who remained under the jurisdiction of a probation or parole agency. dTotals are estimates based on the Annual Survey of Jails, except the total for 2005, which is a complete enumeration based on the Census of Jails Inmates. See appendix table 5 for standard errors and Methodology. eIncludes prisoners held in the custody of state or federal prisons or privately operated facilities. The custody prison population is not comparable to the jurisdiction prison population, which is BJS's official measure of the prison population. See text box on page 2 for a discussion of the differences between the two prison populations. fSee Methodology for information on the methods used to calculate annual change within each correctional population and the total correctional population. Sources: Bureau of Justice Statistics, Annual Probation Survey, Annual Parole Survey, Annual Survey of Jails, Census of Jail Inmates, and National Prisoner Statistics Program, 2000, 2005, and 2010–2012. co r r e c t i o n a l p o p u l at i o n s i n t h e u n i t e d s tat e s , 2012 | D e c e m b e r 2013 3 Decreases in probation and prison populations accounted for nearly all of the decline in the total correctional population during 2012 At yearend 2012, the probation population represented more than half (57%) of all offenders under the supervision of adult correctional systems (table 3). The number of prisoners held in the custody of state or federal prisons represented the next largest component of the correctional population (21%). Parolees conditionally released to supervision in the community (12%) and local jail inmates (11%) represented the smallest components of the correctional population. These findings remained relatively unchanged since 2011. Combined, the probation, parole, and prison populations decreased by 59,900 offenders during 2012. About 38,300 fewer probationers were under supervision at yearend 2012, compared to the beginning of the year, accounting for 64% of the combined total decrease in the correctional population during the year (table 4). Even though the probation population was more than two and half times larger than the custody prison population at yearend 2012, the decline in the prison population (down 21,100) accounted for 35% of the total decrease. The drop of 500 parolees (down 1.0%) between the beginning and end of 2012 had minimal impact on the total decline in the correctional population. After three consecutive years of decline, the jail population increased (up 8,900) during 2012. It was the only correctional population to increase during the year, partially offsetting the overall decline in the correctional population. Most of the increase in the jail population during 2012 occurred in California jails.4 4See California’s Public Safety Realignment Act of 2011 and the U.S. correctional populations in this report, for the size and change in the state’s correctional populations and its impact on the U.S. correctional populations. Table 3 Estimated number of persons supervised by adult correctional systems, by correctional status, 2011-2012 Correctional populations Totala Probationb Paroleb Prisonc Local jaild Offenders with multiple correctional statusese Population 6,978,500 3,971,300 853,900 1,505,000 735,600 87,200 2011 Percent of total population 100% 56.9 12.2 21.6 10.5 : Population 6,937,600 3,942,800 851,200 1,483,900 744,500 84,700 2012 Percent of total population 100% 56.8 12.3 21.4 10.7 : Note: Estimates were rounded to the nearest 100. Details may not sum to total due to rounding and because offenders with multiple correctional statuses were excluded from the total correctional population. Includes estimates for nonresponding jurisdictions. See Methodology. :Not calculated. aEquals the sum of each correctional population and excludes the number of offenders with multiple correctional statuses. bPopulation as of December 31. cCustody prison population as of December 31. See the text box on page 2 for a discussion of the differences between the custody and jurisdiction prison populations. dPopulation as of the last weekday in June. eSome probationers and parolees on December 31 were held in a prison or jail but still remained under the jurisdiction of a probation or parole agency and some parolees were also on probation. They were excluded from the total correctional population to avoid double counting. See table 7 and Methodology. Sources: Bureau of Justice Statistics, Annual Probation Survey, Annual Parole Survey, Annual Survey of Jails, and National Prisoner Statistics Program, 2011-2012. Table 4 Change in the number of persons supervised by adult correctional systems, 2012 Total changea Total increase Local jailb Total decrease Probationc Parolec Prisond Change in number -51,000 8,900 8,900 -59,900 -38,300 -500 -21,100 Percent of total 100% 100% 100 100% 63.9 0.8 35.2 Note: Estimates were rounded to the nearest 100. See Methodology for methods used to calculate change. aChange equals the sum of the change for each correctional population. bChange equals the difference between the populations on the last weekday in June for the prior year and reporting year (e.g., last weekday of June of 2011 and 2012). cChange equals the difference between the January 1 and December 31 populations within the year. dChange equals the difference between the December 31 custody prison populations for the prior year and reporting year (e.g., December 31 of 2011 and 2012). Sources: Bureau of Justice Statistics, Annual Probation Survey, Annual Parole Survey, Annual Survey of Jails, and National Prisoner Statistics Program, 2011-2012. co r r e c t i o n a l p o p u l at i o n s i n t h e u n i t e d s tat e s , 2012 | D e c e m b e r 2013 4 California’s Public Safety Realignment Act of 2011 and the U.S. correctional populations In October 2011, the state of California and its counties implemented the Public Safety Realignment Act of 2011, redirecting nonserious, nonviolent, and nonsex offenders from the state prison and parole systems to sentences in local jails or county-directed post-release community supervision. The legislation was designed to reduce the number of inmates in California’s prison system to alleviate crowding and to stop low-level offenders from cycling in and out of prison. About 598,600 offenders were under the supervision of California’s adult correctional systems at yearend 2012. Offenders supervised in the community on probation (297,700) represented the largest component of California’s correctional population (table 5). An additional 132,900 offenders were held in the custody of state prisons; 89,300 were on parole or post-release community supervision; and 78,700 were incarcerated in local jails. Although all 58 counties in California designated probation agencies as the correctional entities responsible for post-release community supervision, BJS included that population in California’s parole population rather than the probation population for counting purposes. This method was used because the post-release community supervision population was conditionally released to the community after a sentence to incarceration, regardless of the entity that had authority over the population while in the community. Fewer offenders (down 28,700) were under correctional supervision in California at yearend 2012 than in 2011. Although California’s correctional population represented about 9% of the U.S. correctional population at yearend 2012, more than half of the year’s decrease in the U.S. correctional population (down 51,000 offenders) was attributed to the decrease in the state’s correctional population. All other states, the federal system, and the District of Columbia accounted for 91% of all offenders under correctional supervision but accounted for less of the decline (44%) in the U.S. correctional population than did California. (Continued on next page.) Table 5 Estimated number of persons supervised by adult correctional systems and change in the population, by jurisdiction and correctional status, 2012 U.S. correctional populationa Californiaa Probationb Paroleb,c State parole Post-release community supervision Prisond Local jaile All other jurisdictionsa Probationb Paroleb Prisond Local jaile Population, 2012 6,937,600 598,600 297,700 89,300 56,300 32,900 132,900 78,700 6,339,000 3,645,000 761,900 1,351,000 665,800 Percent of total population 100% 8.6% 4.3 1.3 0.8 0.5 1.9 1.1 91.4% 52.5 11.0 19.5 9.6 Population change, 2012 Number Percent of total decline -51,000 100% -28,700 56.3% -200 : -22,400 : -42,400 : 20,000 : -14,600 : 8,500 : -22,200 43.5% -38,100 : 21,900 : -6,400 : 400 : Note: Estimates were rounded to the nearest 100. Detail may not sum to total due to rounding and because offenders with multiple correctional statuses were excluded from the total correctional population. See Methodology for information on methods used to calculate population change. :Not calculated. a Total population equals the sum of each correctional population and excludes the number of offenders with multiple correctional statuses. Change equals the sum of the change for each correctional population. bPopulation as of December 31, 2012. Change equals the difference between the January 1 and December 31 populations during 2012. cIncludes offenders on state parole supervision and county-directed post-release community supervision. dCustody prison population as of December 31. Change equals the difference between the December 31 custody prison populations for the prior year and reporting year (e.g., December 31 of 2011 and 2012). ePopulation as of the last weekday in June. Change equals the difference between the populations on the last weekday in June for the prior year and reporting year (e.g., last weekday in June of 2011 and 2012). Sources: Bureau of Justice Statistics, Annual Probation Survey, Annual Parole Survey, Annual Survey of Jails, and National Prisoner Statistics Program, 2011-2012. co r r e c t i o n a l p o p u l at i o n s i n t h e u n i t e d s tat e s , 2012 | D e c e m b e r 2013 5 California’s Public Safety Realignment Act of 2011 and the U.S. correctional populations (continued) Yearend 2012 marked the first full year of the Public Safety Realignment Act, and the impact was reflected in the changes in California’s correctional populations during the year. Almost all of the decrease in California’s correctional population during 2012 was attributed to declines in the parole (down 22,400 or 20%) and prison (down 14,600 or 10%) populations (table 6). All of the decrease in California’s parole population resulted from the significant drop in state parole (down 42,400), as the number of offenders under county-directed post-release community supervision (up 20,000) increased during the year (table 5). The percentage of prisoners in the state who were released unconditionally to the community reached 62% of all releases during 2012, up from 12% in 2011, and about 2% in 2010.5 The significant increase in the number of unconditional releases from prison during 2012 was consistent with the drop in California’s state parole population. The 65% decline in the number of admissions to California’s prison system during the year, which 5See Prisoners in the United States, 2012: Trends in Admissions and Releases, 1991-2012, BJS web, NCJ 243920, December 2013, for more information about California’s prison population. was driven by an 87% decline in the number of parole violators admitted to prison, was associated with the decrease observed in the state’s prison population. Although California’s total correctional population dropped in 2012, the decrease was partially offset by an increase of about 8,500 inmates incarcerated in local jails (table 5). The state’s jail population dropped to a record low in 2011 (70,200 inmates), but that population increased by 12.1% during 2012.6 The number of probationers supervised in California remained fairly stable during 2012, after decreasing an average of 5.6% annually from 2005 to 2010 and 9.6% in 2011. The relative stability in this population during 2012 was associated with an increase in the number of offenders placed on probation. During 2012, the growth in entries to probation (up 6.7%) was about four and half times larger than in 2011 (up 1.5%), the year in which the largest decrease in California’s probation population was observed since 2005.7 6See Jail Inmates at Midyear 2012 - Statistical Tables, BJS web, NCJ 241264, May 2013, for more information about California’s jail population. 7See Probation and Parole in the United States, 2012, BJS web, NCJ 243826, December 2013, for more information on California’s probation and parole populations. Table 6 Estimated number of persons supervised by adult correctional systems in California, by correctional status, 2005–2012 Year Total correctional populationa 2005 750,100 2006 774,700 2007 733,000 2008 700,000 2009 669,700 2010 633,900 2011 598,600 2012f 598,600 Average annual percent change, 2005–2010 -3.4% Percent change 2010–2011 -6.5% -4.8 2011–2012g Community supervision population Probationb Paroleb,c 388,300 111,700 401,700 118,600 354,000 123,800 325,100 120,800 312,000 106,000 292,900 105,100 269,800 111,100 297,700 89,300 Incarcerated population Jaild Prisone 82,100 168,000 82,300 172,300 84,200 171,400 83,300 171,100 83,200 168,800 73,300 162,800 70,200 147,600 78,700 132,900 -5.6% -1.2% -2.3% -0.6% -9.6% -0.1 5.6% -20.1 -4.2% 12.1 -9.4% -9.9 Note: Estimates were rounded to the nearest 100. Detail may not sum to total due to rounding and because offenders with multiple correctional statuses were excluded from the total correctional population. See Methodology. aTotal population equals the sum of each correctional population and excludes the number of offenders with multiple correctional statuses. bPopulation as of December 31. Change equals the difference between the January 1 and December 31 populations. cThe 2011 and 2012 counts include offenders on state parole supervision and county-directed post-release community supervision. dPopulation as of the last weekday in June. Change equals the difference between the populations on the last weekday in June for the prior year and reporting year (e.g., last weekday in June of 2011 and 2012). eCustody prison population as of December 31. Change equals the difference between the December 31 custody prison populations for the prior year and reporting year (e.g., December 31 of 2011 and 2012). fThe apparent stability in California’s total correctional population between December 31, 2011, and 2012 was due to a change in reporting of their probation population counts. See Methodology for more information on this issue and the methods used to calculate annual change. gSee table 5 for additional information on change within California’s total correctional population during 2012. See Methodology for information on the methods used to calculate annual change. Sources: Bureau of Justice Statistics, Annual Probation Survey, Annual Parole Survey, Annual Survey of Jails, and National Prisoner Statistics Program, 2005–2012. co r r e c t i o n a l p o p u l at i o n s i n t h e u n i t e d s tat e s , 2012 | D e c e m b e r 2013 6 Methodology Sources of data The statistics presented in this report include data from five separate BJS data collections, each relying on the voluntary participation of federal, state, and local respondents. For more information about any of the following data collections, go to the Data Collections page on the BJS website at www.bjs.gov. Annual Probation Survey; Annual Parole Survey. The Annual Probation Survey and Annual Parole Survey began in 1980. They collect data from probation and parole agencies in the United States that supervise adults. Both surveys cover the 50 states, the District of Columbia, and the federal system. In these data, adults are persons who are subject to the jurisdiction of an adult court or correctional agency. Persons younger than age 18 who were prosecuted in criminal court as if they were adults are considered adults, but persons under age 18 who were under the jurisdiction of a juvenile court or agency are excluded. Annual Survey of Jails. The Annual Survey of Jails (ASJ) has collected data from a nationally representative sample of local jails each year since 1982, except in 1983, 1988, 1993, 1999, and 2005, when a complete census of U.S. local jails was conducted. Jails are confinement facilities, usually administered by a local law enforcement agency, that are intended to hold adults, but they may also hold youth under age 18 before or after they are adjudicated. The data used in this report include inmates under age 18 who were held either before or after they were adjudicated (about 5,400 persons in 2012). Census of Jails. The Census of Jails began in 1970 and was conducted in 1972, 1978, 1983, 1988, 1993, 1999, 2002, 2005, and 2006. The census is part of a series of data collection efforts, including the Census of Jail Inmates and the Census of Jail Facilities, aimed at studying the nation’s jails and their inmate populations. Survey of Jails in Indian Country. The Annual Survey of Jails in Indian Country (SJIC) has been conducted annually since 1998, except in 2005 and 2006. The SJIC collects detailed information on all adult and juvenile confinement facilities, detention centers, jails, and other facilities operated by tribal authorities or the U.S. Department of the Interior’s Bureau of Indian Affairs. The data reflected in this report exclude inmates under age 18 who were confined in facilities that held juveniles only (218 in 2012). The SJIC data are only included in appendix table 2 of this report. National Prisoner Statistics Program. The National Prisoner Statistics (NPS) program began in 1926 under a mandate from Congress and has been conducted annually since then. It collects data from the nation’s state departments of corrections and the federal Bureau of Prisons. NPS distinguishes between prisoners in custody and prisoners under jurisdiction of correctional authorities.8 The prison data in this report reflect the NPS custody counts and include all inmates held within a state’s facilities. These counts include inmates housed for other correctional facilities, prisoners held in privately operated facilities, prisoners under age 18 who were serving time in a state or federal correctional facility after being sentenced in criminal court as if they were adults (1,300 persons in 2012), and inmates in the six states in which prisons and jails form one integrated system, including inmates under age 18 who may have been held before or after adjudication.9 Through the annual NPS collection, since 1994 BJS has obtained yearend counts of prisoners in the custody of U.S. military authorities from the Department of Defense Corrections Council. In 1994, the council, composed of representatives from each branch of military service, adopted a standardized report (DD Form 2720) that obtains data on persons held in U.S. military confinement facilities inside and outside of the continental United States. These data are only included in appendix tables 2 and 4 of this report. In 1995, BJS began collecting yearend counts of inmates from the departments of corrections in the U.S. Territories (American Samoa, Guam, and the U.S. Virgin Islands) and U.S. Commonwealths (Northern Mariana Islands and Puerto Rico). These data are only included in appendix tables 2 and 3 of this report and represent all inmates in the physical custody of prison or local jail facilities in the U.S. Territories or Commonwealths. Probation and parole populations Total correctional population counts reflect data reported by probation and parole agencies within the specific reporting year. For example, the 2012 probation and parole totals are the December 31, 2012, population counts. Some agencies may update their probation and parole data after submitting them or change their reporting methods from one year to the next.10 BJS does not request updated data for prior years; as a result, probation and parole population counts on January 1 of the current year may differ from population counts on December 31 of the prior reporting year. For these reasons, annual change in the probation and parole populations was calculated within the reporting year. See page 9, Estimating annual change in the total correctional populations, for more information. 10See Probation and Parole in the United States, 2012, BJS web, NCJ 243826, December 2013, for information about the reasons why agencies may update their data. 8See text box on page 2 that explains the difference between the two types of prison populations. 9See Prisoners in the United States, 2012: Trends in Admissions and Releases, 1991-2012, BJS web, NCJ 243920, December 2013, for more information about the six states with combined prison and jail systems. co r r e c t i o n a l p o p u l at i o n s i n t h e u n i t e d s tat e s , 2012 | D e c e m b e r 2013 7 Local jail and custody prison populations Respondents to the ASJ report the number of jail inmates confined as of the last weekday in June of each year. The total correctional population counts in each year include jail population counts as of the last weekday in June for all inmates confined in local jails. This is used as an estimate of the number of inmates in local jails at yearend. Respondents to the NPS submit population counts of the number of prisoners in custody and under the jurisdiction of state or federal correctional facilities on December 31 of each year. The total correctional population count in each year reflects the custody prison populations as of December 31, and differs from the jurisdiction population counts (See Prisoners in the United States, 2012: Trends in Admissions and Releases, 19912012, BJS web, NCJ 243920, December 2013.) Counts adjusted for offenders with multiple correctional statuses Offenders under correctional supervision may have multiple correctional statuses for several reasons. For example, probation or parole agencies may not always be notified immediately of new arrests, jail admissions, or prison admissions; absconders included in a probation or parole agency’s population in one jurisdiction may actually be incarcerated in another jurisdiction; persons may be admitted to jail or prison before formal revocation hearings and potential discharge by a probation or parole agency; and persons may be serving separate probation and parole sentences concurrently. In 1998, BJS began collecting data on the number of offenders with multiple correctional statuses and has expanded on the information collected since then. Table 6 includes adjustments that were made to the total correctional population estimates presented in this report to exclude offenders with multiple correctional statuses (table 7). These estimates are based on data reported by the probation or parole agencies that provided the information within the specific reporting year. Because some probation and parole agencies did not provide these data each year, the numbers may underestimate the total number of offenders who had multiple correctional statuses from 2000 to 2012. Due to these adjustments, the sum of the four correctional populations in tables 2, 3, and 4 will not equal the total correctional population. In addition, the sum of the probation and parole populations from 2008 to 2012 will not yield the total community supervision population because the total was adjusted for parolees who were also on probation. 2011 U.S. adult resident population and then multiplying by 100,000. This is the expected supervision rate if there had been no change in the correctional population from 2007 to 2011. (3) The observed 2007 rate minus the expected rate (from step 2) divided by the total change (from step 1) times 100% represents the percentage of total change due to the growth in the U.S. adult resident population. (4) The percentage of total change due to the decline in the correctional population is the residual difference (100% – percent change in step 3). The same method was used to decompose the decline in the correctional supervision rate from 2011 to 2012. Decomposing the decline in the correctional supervision rate Estimating annual change in the correctional populations The decline in the correctional supervision rate from 2007 to 2011 was decomposed in four steps: Because probation and parole population counts on January 1 of the current year may differ from population counts on December 31 of the prior reporting year, annual change in the probation and parole populations was calculated within the reporting year. (See page 7, Probation and parole populations, and Probation and Parole in the United States, 2012, BJS web, NCJ 243826, December 2013, (1) The change in the rate was calculated by subtracting the 2011 rate from the 2007 rate. (2) An expected rate per 100,000 in 2011 was calculated by dividing the 2007 correctional population by the Table 7 Number of offenders with multiple correctional statuses at yearend, by correctional status, 2000–2012 Year 2000 2001 2002 2003 2004 2005 2006 2007 2008 2009 2010 2011 2012 Total 42,500 43,600 50,300 47,000 56,000 91,400 92,000 75,800 95,000 82,900 86,800 87,200 84,700 Probationers in— Local State or jails federal prison 20,400 22,100 23,400 20,200 29,300 20,900 25,500 21,500 34,400 21,600 32,600 22,100 33,900 21,700 19,300 23,100 23,800 32,400 21,400 23,100 21,300 21,500 21,100 22,300 21,200 21,600 In local jails -----18,300 20,700 18,800 19,300 19,100 21,400 18,000 18,500 Parolees— In state or federal prison -----18,400 15,700 14,600 15,600 14,300 14,400 14,900 10,700 On probation --------3,900 5,000 8,300 11,000 12,700 Note: Estimates were rounded to the nearest 100 and may not be comparable to previously published BJS reports due to updated information. Detail may not sum to total due to rounding. -- Not collected or excluded from total correctional population. Sources: Bureau of Justice Statistics, Annual Probation Survey, and Annual Parole Survey, 2000–2012. co r r e c t i o n a l p o p u l at i o n s i n t h e u n i t e d s tat e s , 2012 | D e c e m b e r 2013 8 for more information.) For example, annual change in the probation population in 2012 was calculated as the difference between the January 1 and December 31, 2012, probation populations. This same method was used to calculate annual change in the parole population and California’s probation and parole populations. The annual change in the community supervision population was also calculated within the reporting year for the same reasons. For the years from 2008 to 2012, change in the community supervision population was calculated after accounting for offenders with multiple community supervision statuses. (See page 8, Counts adjusted for offenders with multiple correctional statuses.) For these reasons, from 2008 to 2012, the sum of the changes in the probation and parole populations does not equal the total change in the community supervision population. For example, the change in the probation population (down 38,300) during 2012 plus the change in the parole population (down 500) during the year does not equal the total change in the community supervision population (down 40,500). The difference (1,700) is the change in the number of parolees who were also on probation during 2012. The annual change in the jail and custody prison populations was based on the change from the prior year to the current year because respondents were asked only to report a population count for one reference date. For example, the annual change in the jail population for 2012 is the difference (up 8,900) between the populations on the last weekday in June 2011 and June 2012. The annual change in the custody prison population for 2012 is the difference (down 21,100) between the December 31, 2011, and December 31, 2012, custody prison populations. The change in the total incarcerated population was calculated as the sum of the change in the jail and custody prison populations from the prior to the current year. The annual change in the total correctional population for each year was calculated as the sum of the annual changes for each correctional population. For example, the annual change in the total correctional population (down 51,000) during 2012 was calculated as the sum of four components: (1) the change in the probation population (down 38,300) during 2012; (2) the change in the parole population (down 500) during 2012; (3) the change in the jail population (up 8,900) between 2011 and 2012; and (4) the change in the custody prison population (down 21,100) between 2011 and 2012. This same method was used to calculate annual change in California’s total correctional population. (See table 4 for the change in California’s total correctional population and each correctional population during 2012.) Adjustments for nonresponse Probation, parole, jail, and prison population counts were adjusted to account for nonresponse across the data collections. The methods varied and depended on the type of collection, type of respondent, and availability of information. For more information for 2012, see the following reports: Probation and Parole in the United States, 2012, BJS web, NCJ 243826, December 2013; Prisoners in the United States, 2012: Trends in Admissions and Releases, 1991-2012, BJS web, NCJ 243920, December 2013; and Jail Inmates at Midyear 2012 - Statistical Tables, BJS web, NCJ 241264, May 2013. The total number of prisoners in the custody of correctional authorities in the U.S. Territories and Commonwealths (see appendix tables 2 and 3) in 2011 and 2012 includes estimates for nonresponse. The U.S. Virgin Islands did not provide any data in 2011 and Guam did not provide any data in 2012. Because of limited information, the U.S. Virgin Islands’ prison population in 2012 was used to impute its 2011 population and the estimate was included in the U.S. total for 2011. Guam’s prison population for 2011 was used to impute its population for 2012 and the estimate was included in the U.S. total for 2012. American Samoa was unable to provide the number of prisoners sentenced to more than one year in 2012. Ratio estimation was used to impute the data and the estimate was included in the U.S. total for 2012. Specifically, the ratio of the number of prisoners sentenced to more than one year in 2011 divided by American Samoa’s total prison population in 2011 was applied to American Samoa’s prison population in 2012 to generate the estimate of the number of prisoners sentenced to more than one year in 2012. co r r e c t i o n a l p o p u l at i o n s i n t h e u n i t e d s tat e s , 2012 | D e c e m b e r 2013 9 Appendix Table 1 Inmates held in custody in state or federal prisons or in local jails, 2000 and 2011–2012 Inmates in custody Total Federal prisonersa Prisons Federal facilities Privately operated facilities Community corrections centersb State prisoners State facilities Privately operated facilities Local jailsc Incarceration rated Adult incarceration ratee 2000 1,938,500 140,100 133,900 124,500 9,400 6,100 1,177,200 1,101,100 76,100 621,100 680 920 Number of inmates 2011 2,240,600 214,800 206,000 176,200 29,800 8,800 1,290,200 1,197,800 92,400 735,600 720 940 2012 2,228,400 216,900 208,000 176,500 31,500 8,900 1,267,000 1,170,200 96,800 744,500 710 920 Average annual percent change, 2000–2011 1.3% 3.9% 3.9 3.2 10.5 3.3 0.8% 0.8 1.8 1.5% 0.5% 0.2 Percent change, 2011–2012 -0.5% 1.0% 1.0 0.2 5.7 1.1 -1.8% -2.3 4.8 1.2% -1.4% -2.1 Note: Population counts were rounded to the nearest 100 and include imputed estimates for nonresponding jurisdictions; see Methodology. Rates were rounded to the nearest 10. Detail may not to sum to total due to rounding. Estimates may not be comparable to previously published BJS reports due to rounding or updated information. Total includes all inmates held in local jails, state or federal prisons, or privately operated facilities. Excludes inmates held in U.S. Territories (appendix tables 2 and 3), military facilities (appendix tables 2 and 4), U.S. Immigration and Customs Enforcement facilities, facilities contracted by the U.S. Marshals Service, jails in Indian country, or juvenile facilities. See Methodology for sources of incarceration data and the text box on page 2 for a discussion of the differences between the custody and jurisdiction prison populations. aAfter 2001, responsibility for sentenced prisoners from the District of Columbia was transferred to the federal Bureau of Prisons. bNonsecure, privately operated community corrections centers. cCounts for inmates held in local jails are for the last weekday in June of each year. Counts were estimated from the Annual Survey of Jails. See Methodology. dThe total number of inmates in the custody of local jails, state or federal prisons, or privately operated facilities within the year per 100,000 U.S. residents. Resident population estimates are from the U.S. Census Bureau for January 1 of the following year. eThe total number of inmates in custody within the year per 100,000 U.S. residents age 18 or older. Adult resident population estimates are from the U.S. Census Bureau for January 1 of the following year. Sources: Bureau of Justice Statistics, Annual Survey of Jails, and National Prisoner Statistics Program, 2000 and 2011–2012; the total and adult resident population estimates are based on the U.S. Census Bureau’s National Intercensal Estimates, 2001, and unpublished total and adult resident population estimates, January 1, 2012, and January 1, 2013. Appendix Table 2 Number of inmates incarcerated by other adult correctional systems, 2000, 2005, and 2011–2012 Total Territorial prisonsa Military facilities Jails in Indian countryb 2000 20,169 16,130 2,420 1,619 Number of inmates 2005 2011 19,678 16,529 15,735 12,990 2,322 1,527 1,621 2,012 2012 16,940 13,360 1,434 2,146 Average annual percent change, 2000–2011 -1.8% -2.0 -4.2 2.0 Percent change, 2011–2012 2.5% 2.8 -6.1 6.7 Note: Population counts are for December 31 of the reporting year. Totals exclude inmates held in local jails, state or federal prisons, privately operated prisons, U.S. Immigration and Customs Enforcement facilities, facilities contracted by the U.S. Marshals Service, or juvenile facilities. See appendix table 3 for more information on inmates in territorial prisons and appendix table 4 for inmates in military facilities. aThe 2011 and 2012 totals include population counts that were imputed for some territories due to nonresponse. See Methodology. bPopulation counts are for the last weekday in June of each year. The 2005 population count is estimated as the 2004 population count because the Survey of Jails in Indian Country was not conducted in 2005 or 2006. Estimates exclude inmates under age 18 who were confined in facilities that held juveniles only. See Methodology. Sources: Bureau of Justice Statistics, National Prisoner Statistics Program, and Survey of Jails in Indian Country, 2000, 2004, 2005, and 2011–2012. co r r e c t i o n a l p o p u l at i o n s i n t h e u n i t e d s tat e s , 2012 | D e c e m b e r 2013 10 Appendix Table 3 Prisoners in custody of correctional authorities in the U.S. Territories and Commonwealths, 2000, 2005, and 2011–2012 Total population 2000 2005 2011 2012 Incarceration rate, 2012b Average annual percent change, 2000–2011 Percent change, 2011–2012 Population sentenced to more than 1 year 2000 2005 2011 2012 Incarceration rate, 2012b Average annual percent change, 2000–2011 Percent change, 2011–2012 Number of prisoners Commonwealth of the Northern Guam Marina Islands Totala American Samoa 16,130 15,735 13,010 13,810 340 -2.0% 6.1% 140 222 167 192 349 1.6% 15.0% 684 505 632 / : -0.7% : 11,916 12,399 9,940 10,550 260 -1.6% 6.1% 114 174 117 / : 0.2% : 323 238 240 / : -2.7% : Commonwealth of Puerto Rico U.S. Virgin Islands 97 149 162 168 327 4.7% 3.7% 14,691 14,263 11,470 12,244 332 -2.3% 6.7% 518 596 / 577 548 : : 51 83 91 109 212 5.3% 19.8% 11,075 11,469 9,210 9,781 265 -1.7% 6.2% 353 435 / 281 267 : : Note: Population counts are for December 31 of the reporting year. Estimates were rounded to the nearest 10. /Not reported. :Not calculated. aIncludes population counts for the U.S. Virgin Islands in 2011 and Guam and American Samoa in 2012 that were imputed because of nonresponse. See Methodology. bThe number of prisoners with a sentence of more than one year per 100,000 U.S. residents on July 1, 2012. Sources: Bureau of Justice Statistics, National Prisoner Statistics Program, 2000, 2005, and 2011–2012; resident population estimates were based on the U.S. Census Bureau’s International Database estimates. Appendix Table 4 Prisoners under military jurisdiction, by branch of service, 2000, 2005, and 2011–2012 Branch of service Total population Prisoners who served in — Air Force Army Marine Corps Navy Coast Guard Prisoners held by — Air Force Army Marine Corps Navy Population sentenced to more than 1 year Prisoners who served in — Air Force Army Marine Corps Navy Coast Guard Prisoners held by — Air Force Army Marine Corps Navy 2000 2,420 Number of prisoners 2005 2011 2,322 1,527 2012 1,434 Average annual percent change, 2000–2011 -4.2% Percent change, 2011–2012 -6.1% 413 789 730 474 14 422 949 527 406 18 285 702 299 235 6 262 689 264 214 5 -3.4% -1.1 -8.1 -6.4 -7.7 -8.1% -1.9 -11.7 -8.9 -16.7 102 994 563 761 1,346 120 1,059 470 673 1,340 54 828 102 543 1,051 52 809 90 483 1,014 -5.8% -1.7 -15.5 -3.1 -2.2% -3.7% -2.3 -11.8 -11.0 3.5 253 585 280 222 6 258 638 209 223 12 204 512 157 176 2 182 531 126 173 2 -2.0% -1.2 -5.3 -2.1 -10.0 -10.8% 3.7 -19.7 -1.7 -- 11 831 134 370 24 818 133 365 5 678 5 363 6 685 2 321 -7.2% -1.8 -29.9 -0.2 20.0% 1.0 -60.0 -11.6 --Less than 0.05%. Source: Bureau of Justice Statistics, National Prisoner Statistics Program, 2000, 2005, and 2011–2012. co r r e c t i o n a l p o p u l at i o n s i n t h e u n i t e d s tat e s , 2012 | D e c e m b e r 2013 11 Appendix Table 5 Estimated standard errors for local jail inmates, 2000 and 2010–2012 Year 2000 2010 2011 2012 Total 621,100 748,700 735,600 744,500 Standard error 2,550 5,640 6,170 7,870 Relative standard error (percent)* 0.4% 0.8 0.8 1.1 Note: Population estimates were rounded to the nearest 100. Standard errors were rounded to the nearest 10. *Calculated by dividing the standard error by the survey estimate and multiplying by 100. Source: Bureau of Justice Statistics, Annual Survey of Jails, 2000 and 2010–2012. co r r e c t i o n a l p o p u l at i o n s i n t h e u n i t e d s tat e s , 2012 | D e c e m b e r 2013 12 The Bureau of Justice Statistics, located in the Office of Justice Programs, U.S. Department of Justice, collects, analyses, and disseminates statistical information on crime, criminal offenders, victims of crime, and the operation of justice systems at all levels of government. William J. Sabol is acting director. Lauren E. Glaze and Erinn J. Herberman, Ph.D., wrote this report. Lauren E. Glaze and Erinn J. Herberman analyzed the data and prepared the tables and graphs. Todd D. Minton provided statistical verification and review. Morgan Young edited the report, and Barbara Quinn produced the report. December 2013, NCJ 243936 Office of Justice Programs Innovation • Partnerships • Safer Neighborhoods www.ojp.usdoj.gov


