

Immigration Offenders in Federal Criminal Justice System, DOJ BJS, 2000
Download original document:
Document text
Document text
This text is machine-read, and may contain errors. Check the original document to verify accuracy.
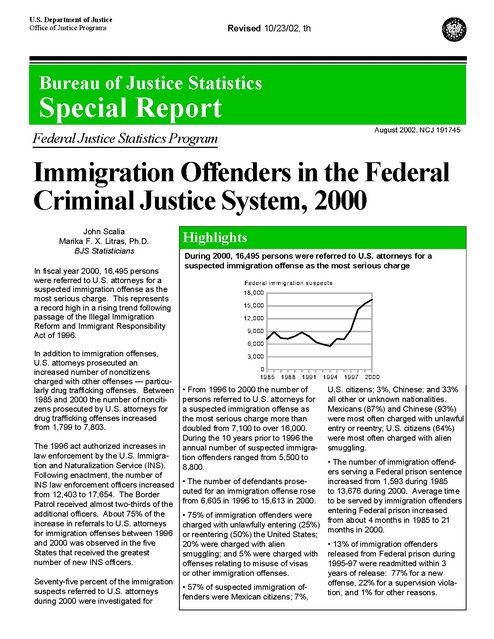
U.S. Department of Justice
Office of Justice Programs

Revised 10/23/02, th

Bureau of Justice Statistics

Special Report

August 2002, NCJ 191745

Federal Justice Statistics Program

Immigration Offenders in the Federal
Criminal Justice System, 2000
John Scalia
Marika F. X. Litras, Ph.D.
BJS Statisticians
In fiscal year 2000, 16,495 persons
were referred to U.S. attorneys for a
suspected immigration offense as the
most serious charge. This represents
a record high in a rising trend following
passage of the Illegal Immigration
Reform and Immigrant Responsibility
Act of 1996.

Highlights
During 2000, 16,495 persons were referred to U.S. attorneys for a
suspected immigration offense as the most serious charge
Federal im m igration suspects
18,000
15,000
12,000
9,000
6,000

In addition to immigration offenses,
U.S. attorneys prosecuted an
increased number of noncitizens
charged with other offenses — particularly drug trafficking offenses. Between
1985 and 2000 the number of noncitizens prosecuted by U.S. attorneys for
drug trafficking offenses increased
from 1,799 to 7,803.
The 1996 act authorized increases in
law enforcement by the U.S. Immigration and Naturalization Service (INS).
Following enactment, the number of
INS law enforcement officers increased
from 12,403 to 17,654. The Border
Patrol received almost two-thirds of the
additional officers. About 75% of the
increase in referrals to U.S. attorneys
for immigration offenses between 1996
and 2000 was observed in the five
States that received the greatest
number of new INS officers.
Seventy-five percent of the immigration
suspects referred to U.S. attorneys
during 2000 were investigated for

3,000
0
1985

1988

1991

• From 1996 to 2000 the number of
persons referred to U.S. attorneys for
a suspected immigration offense as
the most serious charge more than
doubled from 7,100 to over 16,000.
During the 10 years prior to 1996 the
annual number of suspected immigration offenders ranged from 5,500 to
8,800.

1994

1997

2000

U.S. citizens; 3%, Chinese; and 33%
all other or unknown nationalities.
Mexicans (87%) and Chinese (93%)
were most often charged with unlawful
entry or reentry; U.S. citizens (64%)
were most often charged with alien
smuggling.

• The number of immigration offenders serving a Federal prison sentence
increased from 1,593 during 1985
• The number of defendants prosecuted for an immigration offense rose to 13,676 during 2000. Average time
from 6,605 in 1996 to 15,613 in 2000. to be served by immigration offenders
entering Federal prison increased
• 75% of immigration offenders were
from about 4 months in 1985 to 21
charged with unlawfully entering (25%)
months in 2000.
or reentering (50%) the United States;
• 13% of immigration offenders
20% were charged with alien
smuggling; and 5% were charged with released from Federal prison during
1995-97 were readmitted within 3
offenses relating to misuse of visas
years of release: 77% for a new
or other immigration offenses.
offense, 22% for a supervision viola• 57% of suspected immigration oftion, and 1% for other reasons.
fenders were Mexican citizens; 7%,

unlawfully entering or reentering the
United States. Twenty percent were
investigated for smuggling aliens and
5% for misuse of visas or other
immigration violations (table 1).
The incarceration rate of convicted
immigration offenders increased from
57% to 91% between 1985 and 2000.
Average time to be served in prison
increased from 3.6 months to 20.6
months over the same period. These
increases were due in part to changes
in Federal sentencing policy during the
1980's and 1990's, which increased the
likelihood that immigration offenders
would be sentenced to prison and that
their sentences would be longer.
Increased prosecutions and changes to
sentencing policy have had a substantial effect on the size of the Federal
prison population. Between 1985 and
2000 the number of immigration
offenders serving a sentence of imprisonment at yearend increased almost
9-fold — from 1,593 to 13,676.

Nationality of persons investigated
Over half (57%) of suspects investigated by U.S. attorneys for immigration
offenses during 2000 were citizens of
Mexico (table 2). Most (87%) of the
Mexicans investigated were suspected
of unlawfully entering or reentering the
United States — 63%, reentry by a
removed alien; 24%, improper entry;
11%, alien smuggling; and 3%,
offenses related to misuse of visas and
other immigration violations.

Table 2. Nationality of suspects in matters referred to U.S. attorneys
for immigration offenses as the most serious charge, 2000

Geographic region
and nationality

Total
Smuggling, transporting, or harboring
unlawful aliens
Unlawful entry
or reentry
Improper entry
Reentry by removed
aliens

16,495

100.0%

3,338

20.2%

12,352

74.9%

Misuse of
visas/other

74.9%

24.4%

50.5%

20.2%

4.9%

U.S. citizen

1,110

29.8%

13.3%

16.5%

64.3%

6.0%

Mexico

9,425

86.6%

23.7%

62.9%

10.8%

2.6%

Other countriesb

1,817

82.9%

45.5%

37.4%

9.7%

7.5%

433
165

93.1
60.6

92.4
35.8

0.7
24.9

5.1
28.5

1.9
10.9

223
113
67
25

91.9
92.0
77.6
92.0

31.8
40.7
22.4
32.0

60.1
51.3
55.2
60.0

3.6
6.2
1.5
4.0

4.5
1.8
20.9
4.0

190
198
134

89.0
85.4
73.1

13.2
40.4
29.9

75.8
45.0
43.3

4.7
9.1
16.4

6.3
5.6
10.5

55
56

70.9
73.2

7.3
21.4

63.6
51.8

10.9
10.7

18.2
16.1

78.1%

25.5%

52.6%

13.4%

Asia and Oceania
China
Other
Central America
Honduras
El Salvador
Guatemala
Other
Caribbean
Dominican Republic
Other
Europe
South America
Colombia
Other
Not indicated
on arrest record

2,835

8.5%

Includes 1,308 suspects for whom an investigation record could not be matched
with an arrest record to ascertain nationality.
b
Includes 158 suspects from other countries not listed explicitly.
Data source: Composite: Executive Office for U.S. Attorneys and U.S. Marshals Service,
Prisoner Tracking System, annual.
a

4,018

24.4

Immigration violations as a secondary charge

8,334

50.5

In fiscal year 2000, 16,495 matters
were referred to U.S. attorneys for
a suspected immigration offense as
the primary charge. In an additional
919 matters persons were suspected
of an immigration offense as one or a
number of secondary charges only.

Misuse of visas
805
4.9%
and other
Note: Data describe suspects with an
immigration offense as the lead charge.
Data source: Executive Office for U.S.
Attorneys, central system data file,
fiscal year.

Smuggling

16,495

Table 1. Suspects referred to U.S.
attorneys for an immigration offense
as the most serious charge, 2000
Number Percent

Number

Immigration offenses
Unlawful entry or reentry
Improper Reentry by
Total entry
removed alien

Totala

The increase in immigration offenders
incarcerated accounted for 14% of the
overall growth in the Federal prison
population between 1985 and 2000.

Immigration offense

Persons from countries in Asia and
Oceania comprised the second largest
group of noncitizens investigated for
immigration offenses (4%). Most of the
Chinese nationals investigated were
suspected of unlawful entry into the
United States (93%); 5%, alien
smuggling; 2%, misuse of visas; and
1%, reentry. While more than half of
suspects from other Asian countries
were charged with unlawful entry or
reentry, they were among those most

Among these 919 matters,
! 9% involved smuggling as a
secondary offense
! 27% entry
2 Immigration Offenders in the Federal Criminal Justice System, 2000

! 45% reentry
! 25% misuse of visas and other
immigration offenses.
In over half (56%) of the 919 matters,
the secondary immigration offense
was associated with a primary charge
of fraud. Drug trafficking was the
primary charge in 24%, and a
weapons offense, the primary charge
in about 6% of matters.

Revised 09/10/03, th

Suspects in matters referred to U.S. attorneys for immigration offenses as the
most serious charge, by Federal judicial district, 2000

matters concluded by U.S. attorneys in
2000 (Federal Criminal Case Processing, 2000, BJS report, NCJ 190379,
table 3).
About 75% of suspects in immigration
matters concluded were investigated
for unlawfully entering (25%) or
reentering (50%) the United States.
Additionally, 20% were investigated
for smuggling, transporting, or harboring unlawful aliens, and 5% were
suspected of misuse of visas and other
offenses related to removal of aliens.

Suspects investigated
Less than 100
100 to 499
500 to 999
1,000 or more

Note: Alaska and Hawaii each
received less than 100 referrals.

Figure 1

likely to be charged with alien
smuggling (29%).
U.S. citizens are not immune from
prosecution for immigration offenses.
During 2000, 7% (or 1,110) of suspected immigration offenders were U.S.
citizens. Of these, 64% were suspected of alien smuggling and 30%
charged with otherwise furthering the
entry or reentry of a noncitizen into the
United States.

Southern (11%), and New Mexico
(6%). In each district the U.S. attorneys received more than 1,000 referrals (figure 1). Among these five
judicial districts, immigration offenses
accounted for 39% of all referrals
made to U.S. attorneys: Texas,
Western (39% of all referrals); California, Southern (44%); Arizona (43%);
Texas, Southern (31%); and New
Mexico (38%) (not shown in a table).
Suspects in matters concluded by
U.S. attorneys

Geographical distribution
of immigration suspects

During 2000 U.S. attorneys concluded
16,110 matters involving a person
suspected of an immigration offense as
the most serious charge (table 3).

During 2000, 63% of all the persons
(or 10,331) suspected of immigration
offenses were referred to U.S. attorneys in 5 Federal judicial districts:
Persons suspected of immigration
Texas, Western (18%), California,
Southern (14%), Arizona (13%), Texas, offenses accounted for 14% of all

Table 3. Suspects in matters concluded by U.S. attorneys for an immigration
offense as the most serious charge, 2000
Percent of suspects
Prosecuted
Declined for prosecution

Offense

Total

Total

16,110

96.9%

3.1%

3,225

94.4%

5.6%

12,093

98.0%

2.0%

98.3
97.9

1.7
2.1

Smuggling, transporting, or
harboring unlawful aliens
Unlawful entry or reentry
Improper entry
Reentry by removed aliens
Misuse of visas and other

3,995
8,098
762

89.8%

10.2%

Note: Data describe suspects with an immigration offense as the lead charge.
Data source: Executive Office for U.S. Attorneys, central system data file, fiscal year.

Compared to prosecutorial declinations
for other offenses, U.S. attorneys
refused to prosecute few referrals for
immigration offenses. During 2000,
3% of immigration offense referrals
and 26% of all referrals were declined
for Federal prosecution. (Federal
Criminal Case Processing, 2000, BJS
report, NCJ 190379, table 3). Immigration offenses involving unlawful entry or
reentry were the most likely to be prosecuted (98%), while those involving
misuse of visas and other violations
(90%) were the least likely (table 3).
Table 4. Defendants convicted
in Federal courts of smuggling,
transporting, or harboring unlawful
aliens, 1999
Characteristic
Total
Defendant committed
the offense for a reason
other than profit
Defendant organized
or otherwise led a
smuggling operation
Number of aliens
smuggled
5 or fewer
6 to 24
25 to 99
100 or more

Number

Percent

1,796 100.0%

170

9.5%

90

5.0%

540
945
232
79

30.1%
52.6
12.9
4.4

Injury caused
None
1,442 80.3%
Risk of injury only
323 18.0
Actual injury
31
1.7
Death
14
0.8
Serious, permanent,
11
0.6
or life threatening
Other
6
0.3
Data source: U.S. Sentencing Commission,
monitoring data file, fiscal year.

Immigration Offenders in the Federal Criminal Justice System, 2000

3

Available data describing alien
smuggling offenses indicate that in the
2,043 cases investigated by the INS
Inspections Division during 1999 a total
of 41,364 smuggled aliens were
located and arrested (INS, 1999 Statistical Yearbook, table 59). For those
defendants who were convicted of
alien smuggling and sentenced during
1999, 70% smuggled 6 or more aliens
into the United States (table 4).
About 20% of defendants convicted of
alien smuggling and sentenced during
1999 received an enhanced sentence
for risking (18%) or actually causing
bodily harm (2%) to those they
attempted to smuggle into the United
States.
Characteristics of defendants
charged
Demographic characteristics
According to data collected by the
Pretrial Services Administration, most
(87%) of the 14,540 Federal defendants charged with an immigration
offense, were Hispanic; 4% were
identified as white; 3% black; and 6%
all other races and ethnicities (table 5).
More than 9 in 10 were male. More
than half were age 30 or younger; 33%,
31 to 40; and 14%, over age 40.
Criminal history
More than two-thirds of the defendants
charged with an immigration offense
were identified as having been previously arrested. Thirty-six percent had
been arrested on at least 5 prior
occasions; 22%, 2 to 4 times; and
12%, 1 time (table 6).
Sixty-one percent of those defendants
had been convicted at least once; 18%,
5 or more times; 26%, 2 to 4 times;
and 17%, 1 time. Of those charged,

Types of prior conviction offense of defendants charged with immigration offenses, 2000
M isuse of visas
E ntry
S m ug glin g
R ee ntry

D rug

Violent

0%

25 %

49% had previously been convicted
of a felony: 20% of a drug offense;
18%, a violent offense; and 11%, other
felony offenses. Twelve percent had
previously been convicted of a
misdemeanor.

Table 5. Demographic characteristics
of Federal defendants charged with
immigration offenses, 2000
Characteristic of
Federal immigration
defendants

Number

25%

Total

14,540

100%

13,406
1,117

92.3%
7.7

Race/ethnicity
White
Black
Hispanic
Other

638
419
12,557
801

4.4%
2.9
87.1
5.6

Age
Under 19 years
275
1.9%
19 to 20
823
5.7
21 to 30
6,643
45.8
31 to 40
4,719
32.6
Over 40 years
2,037
14.1
Note: Represents defendants charged with a
felony or Class A misdemeanor immigration
offense as the most serious charge. Information about gender was missing for 17 defendants, race/ethnicity for 125, and age for 43.
Data source: Administrative Office of the
U.S. Courts, pretrial services data file, fiscal
year.

5 or m ore
50%

Percent

Gender
Male
Female

Smuggling

0%

10 0%

ously arrested. Of those with a prior
arrest, half had been arrested on at
least 5 prior occasions (figure 2).

75%

Table 6. Criminal history of Federal
defendants charged with immigration
offenses, 2000
Characteristic

Entry

2-4

75 %

Fifty-six percent of those charged with
a reentry offense had previously been
convicted of a violent or drug-related
Defendants charged with unlawful
felony (figure 3). By contrast, under half
reentry had the most extensive criminal
of those charged with alien smuggling,
histories. Nine in ten had been previa third of those charged with unlawful

Misuse of visas

1

50 %

M isdem eanor

Figure 3

Number of prior arrests for defendants charged with immigration offenses, 2000

Reentry

O ther
felony

100%

Figure 2

4 Immigration Offenders in the Federal Criminal Justice System, 2000

Total

Number

Percent

14,540

100%

Number of prior
arrests
None
1
2 to 4
5 or more

4,341
1,789
3,238
5,172

29.9%
12.3
22.3
35.6

Number of prior
convictions
None
1
2 to 4
5 or more

5,656
2,474
3,736
2,674

38.9%
17.0
25.7
18.4

Nature of prior
convictions
No prior convictions
Felony
Violent
Drug
Other
Misdemeanor

5,656
7,153
2,672
2,891
1,590
1,731

38.9%
49.2
18.4
19.9
10.9
11.9

6,692
117

46.0%
0.8

Criminal justice
status at arrest
Not under supervision
Pretrial release
Parole/supervised
release
Probation
Immigration status
in question
Other

659
649

4.5
4.5

4,337
2,086

29.8
14.3

Note: Represents defendants charged with a
felony or Class A misdemeanor immigration
offense as the most serious charge. “Other”
includes defendants with warrants, walk-off
status, or unknown criminal justice status.
Data source: Administrative Office of the
U.S. Courts, pretrial services data file, fiscal
year.

entry, and just over a quarter those
charged with misuse of visas
and other charges had previously been
arrested. The criminal histories of
these defendants were generally less
extensive: more than 70% had been
previously arrested fewer than 5 times
(figure 2).

16,000

Investigated
12,000
C harg ed
8,000
4,000

Adm itted to prison

0

1985

Trends in prosecution
of immigration offenses, 1985-2000
Between 1985 and 2000 the number
of persons referred to U.S. attorneys
for a suspected immigration offense —
as the most serious charge —
increased from 7,239 to 16,495
(figure 4). The number of defendants
charged during this period increased
from 6,744 to 15,613. While the
number of referrals to U.S. attorneys
for suspected immigration offenses
fluctuated during the pre-1996 period,
following passage of the Illegal
Immigration Reform and Immigrant
Responsibility Act of 1996 (Pub. L.
104-208, 110 Stat. 3009), referrals to
U.S. attorneys increased substantially.

deported after a conviction for an
"aggravated felony" such as violent
drug trafficking or felony property
offenses or who were convicted of
smuggling more than six aliens. (See,
U.S.S.G. App. C, Nos. 193, 196, 375,
450, and 524.)

Im m igration offenders

1990

1995

2000

Figure 4

increased from 5,070 during 1996 to
12,118 during 2000 (not shown in a
table). These States accounted for
75% of the overall increase in the
number of immigration referrals to
U.S. attorneys.
Changes in Federal sentencing law
also had a substantial impact on the
processing of immigration offenders,
by increasing the average length of
prison sentences and requiring offenders to serve a greater proportion of the
sentence imposed.

Following these amendments, the
4-to-10 month base sentencing range
for defendants convicted of unlawfully
re-entering the United States after
conviction of an "aggravated felony"
increased from 57 to 71 months.1 The
10-to-16 month base sentencing range
for defendants involved with alien
smuggling increased to the following:
18 to 24 months for smuggling 6 to 24
aliens; 27 to 33 months for smuggling
25 to 99 aliens; and 47 to 46 months
for smuggling 100 or more aliens.2

A greater INS presence in the Southwest and more severe penalties for
immigration offenses have accompanied an increase in the number of
After sentencing guidelines were imple- immigration offenders in Federal
prisons. Between 1985 and 2000 the
mented in 1987, the proportion
number of immigration offenders under
of immigration offenders convicted
Among its several provisions, the 1996 of a felony who were sentenced to
sentence in a Federal prison increased
act authorized increases for INS law
from 1,593 to 13,676 (figure 6).
prison increased from 57% in 1985 to
enforcement, particularly Border Patrol 91% in 2000 (Compendium of Federal
officers. INS law enforcement grew
Justice Statistics, annual). For immiIm m igration offenders
42% from 12,403 officers during 1996 gration offenders entering prison, time
16,000
to 17,654 during 2000.
to be served increased from 3.6
Federal prison
12,000
months, on average, during 1985-87 to
2000
1996
population
Total
12,403 17,654
20.6 months during 2000 (figure 5).
8,000
Type of assignment
Border Patrol
Inspection or investigation
Deportation or detention

5,441
5,260
1,702

8,819
6,317
2,518

Top 5 States of employment
Texas
3,164
California
3,587
Arizona
1,015
New York
949
Florida
637

5,044
4,560
2,135
1,184
789

Source: BJS, Federal Law Enforcement Officers
statistical series.

About 84% of the increase in INS law
enforcement officers occurred in 5
States: Texas (1,880 additional
officers), Arizona (1,120), California
(973), New York (235), and Florida
(152). In addition, between 1996 and
2000 referrals to U.S. attorneys in
Texas, Arizona, California, New York,
and Florida for immigration offenses

The increase in average time to be
served followed amendments to the
Federal sentencing guidelines that
addressed immigration offenders with
serious criminal histories. These
amendments included substantial
sentencing enhancements for immigration offenders who had previously been
M onths
25
Average tim e to be
20
served by im m igration
15 offenders entering
Federal prisons
10

4,000
0

1985

1990

1995

2000

Figure 6
1
Guideline range increases assume Criminal
History Category II, which represents a single
prior conviction resulting in a sentence of more
than 1 year. For defendants with more extensive criminal histories such as those classified in
Criminal History Category VI – more than 4 prior
sentences of more than 1 year – the 18-to-24
month base sentencing range became 100 to
125 months.
2
Guideline range increases assume Criminal
History Category I.

5
0

1985

1990

1995

2000

Figure 5

Immigration Offenders in the Federal Criminal Justice System, 2000

5

Defendants adjudicated in the
Federal courts
During 2000, 96% of those adjudicated
of an immigration offense were convicted (table 7). Of those defendants
convicted, 85% were sentenced to
prison, 5% were sentenced to probation, and 10% received another sanction such as a fine. Defendants
charged with unlawful reentry were the
most likely to receive a prison sentence
(95%); those charged with misuse of
visas and other violations, the least
(70%).
Among immigration offenders, defendants convicted of unlawful reentry
were likely to have received the longest
prison terms, an average of 36 months.
Those convicted of misuse of visas
and other immigration violations
received on average the shortest —
13 months (figure 7).
Offenders under Federal
correctional supervision
Incarcerated
During 2000, 13,676 offenders convicted of an immigration offense were
serving a sentence of imprisonment in
Federal prisons: 89% following a conviction for unlawfully entering or reentering the United States; 11%, alien
smuggling; and less than 1%, offenses
relating to the misuse of visas and
other immigration violations (table 8).

Table 7. Defendants adjudicated in Federal courts of an immigration offense as
the most serious charge, 2000
Case processing
event

Percent of immigration offense defendants, by type of offense
Unlawful entry or reentry
Misuse of
Smuggling Total
Entry Reentry
visas/other

All

Outcome
Not convicted
Convicted

4.0%
96.0

5.1%
94.9

3.7%
96.3

4.0%
96.0

3.6%
96.4

3.9%
96.1

Type of sentence
imposed*
Prison
Probation
Other

85.4%
4.5
10.1

76.1%
15.4
8.5

88.4%
1.5
10.1

71.4%
3.7
25.0

94.8%
0.7
4.4

69.9%
6.0
24.1

Number of
defendants

12,429

2,590

9,528

2,623

6,905

311

*Convicted defendants only.
Data source: Administrative Office of the U.S. Courts, criminal master file, 2000.

Table 8. Immigration offenders under correctional supervision,
by offense of conviction, 2000
Type of correctional
supervision
Total

All

Immigration offenders, by type of offense
Unlawful entry Misuse of visas
Smuggling
or reentry
and other

15,876

2,975

12,770

131

Prison
13,676
Community supervision 2,200
Probation
1,329
Supervised release
871

1,493
1,482
731
751

12,143
627
535
92

40
91
63
28

Data sources: Bureau of Prisons, SENTRY data file; Administrative Office of the U.S. Courts,
FPSIS data file.

Table 9. Immigration offenders returning to Federal prison within 3 years of
release from a U.S. district court commitment, 1995-1997

Characteristic
Total*
Original offense of conviction
Smuggling, transporting, or
harboring unlawful aliens
Unlawful entry or reentry
Misuse of visas and other
Age at first release
Under 19 years
19 to 20
21 to 30
31 to 40
Over 40 years

Number
released

Percent of offenders returned to Federal prison
Reason
New
Supervision
Total
offense
violation
Other

15,429

13.2%

76.6%

22.1%

1.2%

1,596
13,487
--

12.9%
13.1
--

45.2%
80.3
--

53.9%
18.4
--

1.0%
1.3
--

200
917
7,862
4,958
1,490

11.5%
9.1
12.8
14.4
14.0

87.0%
84.3
78.3
76.3
65.6

13.0%
14.5
20.9
22.8
30.1

-1.2%
0.9
0.8
4.3

Citizenship
U.S. citizen
296
27.4%
25.9%
74.1%
Noncitizen
15,133
12.9
78.7
20.0
Mexico
13,574
13.7
79.4
19.4
Other
1,559
5.9
65.2
31.5
*Total includes observations for which a specific characteristic was not recorded.
--No observations.
Data source: Bureau of Prisons, SENTRY data file, annual.

6 Immigration Offenders in the Federal Criminal Justice System, 2000

0.0%
1.3
1.2
3.3

Average length of prison sentence for
convicted immigration offenders, 2000
Reentry
Entry
Sm uggling
M isuse of visas
0

10

20

30

40

M onths

Figure 7

Community supervision
In addition to offenders held in Federal
prisons, 2,200 offenders convicted of
an immigration offense were serving a
term of community supervision: 60%
term of probation and 40%, supervised
release. About two thirds of defendants serving a sentence of community
supervision had been convicted of
alien smuggling; 29% entry/reentry;
and 4% misuse of visas and other
offenses.
Immigration offenders returning to
Federal prison
Approximately 13% of immigration
offenders released from Federal prison
during 1995-97 were readmitted within
3 years (table 9). These offenders
most often (77%) were returned following a conviction for a new Federal
offense; 22% were returned following
adjudication of a supervision violation;
and 1% for other reasons. More than
90% of offenders who were returned
for a new offense were readmitted
following a conviction for an immigration offense (not shown in a table).

Apprehending and removing illegal aliens
The INS has the initial responsibility
for determining who may be admitted
to the United States. The INS also
has the responsibility for enforcing
immigration laws. Border Patrol
agents or Investigations special
agents perform almost all the work
of locating and arresting illegal aliens.
Immigration inspectors work to
prevent the entry of inadmissable
aliens at a port of entry.
Approximately 30 million aliens legally
enter the United States annually (INS,
1999 Statistical Yearbook, table 37).
Almost all (98%) are temporary
admissions — primarily for pleasure.
While the total number of aliens
unlawfully entering the United States
is not known, during 1999 INS agents
apprehended 1,714,035 aliens who
had unlawfully entered or remained
in the United States (figure).
Of these apprehensions —
• 90% were made along the Southwest border
• 95% involved Mexicans
• 98% entered the United States
without inspection (INS, table 58).
Defendants returning for new crimes
could expect to serve longer terms
upon readmission (25 months) than
those returning for supervision violations (14 months).

Offenders originally convicted of alien
smuggling returned at a greater rate for
supervision violations (54%) than those
Overall, immigration offenders who
convicted of unlawful entry or reentry
were readmitted within 3 years of their (18%) (table 9). Offenders convicted
first release served 28 months, on
of unlawful entry or reentry, on the
average, for the original conviction (not other hand, were more likely to return
shown in a table). The interval from
for new offenses (80%) than those
release to readmission was approxiconvicted of alien smuggling (45%).
mately 18 months, on average; 30% of
the immigration offenders who were
readmitted returned within the first year
following release. Upon readmission,
the estimated time these offenders
could expect to serve was 22 months.

Criminal prosecution of illegal aliens
represents a small component of the
INS enforcement strategy. The INS
can remove an alien from the United
States by initiating a formal deportation, exclusion, or removal proceeding
or by offering the alien the opportunity
to depart voluntarily.
During 1999 the INS removed almost
1.8 million aliens who unlawfully
entered or remained in the United
States (INS, table 60). Of these, 90%
accepted an offer of voluntary departure and 10% were removed following
a formal removal proceeding such as
a determination of deportability or
inadmissability.
Num ber of aliens apprehended
by the INS
2,000,000
1,500,000
1,000,000
500,000
0
1985

1990

1995

1999

Older offenders were more likely to
return than younger offenders: about
14% of offenders 31 years or older
were readmitted to Federal prison
compared to roughly 10% of those 30
years or younger.
While U.S. citizens were the most likely
to be readmitted (27%), they were
returned to prison primarily for supervision violations. Most of the noncitizens
(79% of the Mexicans who were
readmitted) were returned for new
offenses.

Immigration Offenders in the Federal Criminal Justice System, 2000

7

Noncitizens prosecuted in Federal courts and incarcerated in Federal prisons
Between 1985 and 2000 the number of noncitizens
charged with an offense in Federal courts increased from
4,539 to 23,477 (table). More than half of the increase in
the number of noncitizens prosecuted can be attributed to
the increase in
Noncitizens charged with an offense
immigration
in Federal courts, 1985-2000
offenders from
Offense charged
1,636 to 12,364.
Year
1985
1986
1987
1988
1989
1990
1991
1992
1993
1994
1995
1996
1997
1998
1999
2000

Total
Drug
Immigration Other
4,539
1,799
1,636
1,104
4,230
1,805
1,240
1,185
6,215
3,287
1,166
1,762
8,419
3,980
2,474
1,965
10,087
4,473
3,309
2,305
Data not available
9,583
4,182
3,453
1,948
9,761
4,506
3,183
2,072
10,679
5,274
3,022
2,383
10,352
4,633
3,477
2,242
13,595
5,234
5,315
3,046
15,866
5,786
7,009
3,071
17,374
6,045
8,232
3,097
21,368
7,079
11,414
2,875
20,812
7,248
10,539
3,025
23,477
7,803
12,364
3,310

Note: Changes in the structure of the pretrial
file during 1990 made unavailable the data
describing noncitizens prosecuted.
Data source: Administrative Office of the U.S.
Courts, pretrial services agency data file, annual.

In 2000 U.S.
attorneys in five
Federal judicial
districts prosecuted over half
the noncitizens:
Arizona (17.1%),
Texas, Southern
(11.7%), California, Southern
(10.1%), Texas,
Western (8.7%),
and New Mexico
(5.6%) (not
shown in a
table).

Noncitizens accounted for about a third of the growth in
the Federal prison population, 1985-2000 (not shown in a
table). In 1985, 5,561 noncitizen Federal inmates were
14% of the total; in 2000, 37,243 noncitizen inmates were
29% of all Federal prisoners (figure). During 2000, 54% of
noncitizen inmates had been convicted of a drug offense;
35% of an immigration offense; and 11% of other offenses.
Two-thirds of the growth in the number of noncitizen
inmates from 1996 to 2000 was related to the increase in
immigration offenders. The number of noncitizen immigration offenders in Federal prisons increased from 4,411
during 1996 to 13,162 during 2000.
Noncitizens in Federal prisons
40,000
35,000
30,000
25,000

O th er
Im m ig ratio n

20,000
15,000
10,000

Drug

5,000
0
1985

1987

1989

1991

1993

1995

1997

1999 2000

Selected Federal immigration statutes
Immigration offenses in this report are defined according
to the BJS filing offense classification which is based on
the classification procedure followed by the Administrative
Office of the U.S. Courts. Immigration is one of 41 offense
categories in the BJS classification system and is
composed largely of the following Federal statutes:

Misuse of visas and other violations

Smuggling, transporting, and harboring

18 U.S.C. § 1546: prohibits fraud and misuse of visas,
permits, and other documents.
8 U.S.C. § 1252 and 8 U.S.C. § 1253: involves orders
of removal of aliens and penalties related to removal.
8 U.S.C. § 1321: prohibits persons from failing to prevent
the unauthorized entry of aliens.

8 U.S.C. § 1322: prohibits bringing into the United States
an alien(s) subject to denial of admission due to lack
of the proper authorization or documentation.
8 U.S.C. § 1323: prohibits unlawful bringing of aliens
into the United States.
8 U.S.C. § 1324: prohibits bringing in and harboring
certain aliens.
8 U.S.C. § 1327: prohibits aiding or assisting certain
aliens to enter the United States.

Immigration related offenses which are not classified as
immigration offenses in this report include the following:
importation of aliens for immoral purposes such as prostitution (8 U.S.C. § 1328) which is classified technically as
a sex offense rather than as an immigration offense; false
impersonation as a U.S. citizen (18 U.S.C. § 911), reproduction of citizenship papers (18 U.S.C. § 1426), and false
statements in application and use of a passport (18 U.S.C.
§ 1542) which largely are classified as fraud offenses.

Unlawful entry and reentry

For additional information about the Federal Justice Statistics Program’s offense classification procedures, see
Methodology section of the Compendium of Federal
Justice Statistics, 2000, NCJ-194067.

8 U.S.C. § 1325: prohibits improper entry by an alien.
8 U.S.C. § 1326: prohibits reentry of removed aliens.

8 Immigration Offenders in the Federal Criminal Justice System, 2000

This and other reports presenting
criminal justice statistics, together
with graphs, electronic files, and
data online, may be accessed at the
BJS website <http://www.ojp.usdoj.
gov/bjs/>.
Available through the BJS website,
the Federal Justice Statistics
Resource Center, <http://fjsrc.urban.
org>, offers comprehensive information about Federal case
processing.

The Bureau of Justice Statistics
is the statistical agency of the
U.S. Department of Justice.
Lawrence A. Greenfeld is director.

Highlights. Defendants charged
with an immigration offense
in U.S. district courts, 1985-2000

John Scalia and Marika F. X. Litras,
statisticians formerly with BJS,
wrote this report under the supervision of Steven Smith. Carol J.
DeFrances and Keonna Feaster
provided statistical review and verification. William Adams, Avi Bhati,
Barbara Parthasarathy, Juliet Scarpa
from the Federal Justice Statistics
Resource Center staff, under the
supervision of Laura Winterfield,
provided technical assistance and
review. The Administrative Office of
the U.S. Courts staff and Pragati
Patrick, under the supervision of
Steven Schlesinger, provided
substantive review. Tina Dorsey and
Tom Hester edited this report.

Year
1985
1986
1987
1988
1989
1990
1991
1992
1993
1994
1995
1996
1997
1998
1999
2000

Defendants charged with
immigration offense in U.S.
district court
7,239
8,858
7,424
7,255
7,854
8,784
7,854
6,470
5,934
5,526
7,256
7,122
9,366
14,144
15,539
16,495

August 2002, NCJ 191745

Appendix table for figure 2. Number of prior arrests, by type of immigration
charge, 2000

Current charge, 2000
Entry
Smuggling
Misuse of visas and other
Reentry

Percent of immigration defendants,
by number of prior arrests
1
2-4
5 or more
8%
12%
13%
14
17
15
14
9
5
12
27
50

Appendix table for figure 3. Type of offense of prior conviction, by type
of immigration charge, 2000

Current charge, 2000
Violent felony
Entry
6%
Smuggling
6
Misuse of visas and other
3
Reentry
27

Percent of immigration defendants,
by most serious prior conviction
Drug felony
Other felony
Misdemeanor
6%
5%
9%
7
7
15
2
5
9
29
14
11

Immigration Offenders in the Federal Criminal Justice System, 2000

9

Appendix for figure 4. Immigration offenders investigated, charged
in U.S. district court, and admitted to Federal prison, 1985-2000
Number of offenders for whom an immigration offense was
the most serious
Investigated
Charged
Admitted to prison
1985
7,239
6,744
-1986
8,858
8,237
7,440
1987
7,424
6,677
6,571
1988
7,255
6,818
5,170
1989
7,854
7,493
5,870
1990
8,784
8,313
7,488
1991
7,854
6,632
6,228
1992
6,470
5,904
5,108
1993
5,934
5,390
5,036
1994
5,526
5,006
5,514
1995
7,256
6,294
5,873
1996
7,122
6,605
6,252
1997
9,366
8,472
7,300
1998
14,144
12,879
9,762
1999
15,539
14,729
11,857
2000
16,495
15,613
13,151
Source: Compendium of Federal Justice Statistics, BJS report.

Appendix for figure 6. Immigration
offenders serving time in Federal
prisons, 1985-2000
Number of Federal prisoners
with an immigration offense
as their most serious offense
1985
1,593
1986
1,799
1987
1,667
1988
1,631
1989
1,729
1990
1,673
1991
1,667
1992
1,654
1993
2,198
1994
2,486
1995
3,420
1996
4,476
1997
5,454
1998
7,430
1999
10,156
2000
13,676
Source: Compendium of Federal Justice
Statistics, BJS report.

Appendix for figure 7. Average
prison sentence for persons
convicted of an immigration offense,
2000

Immigration offense
Reentry
Entry
Smuggling
Misuse of visas/other

Mean number
of months
sentenced to
Federal
prison
35.5 mos
22.4
14.5
12.8

Appendix for figure 5. Average time
to be served by Immigration
offenders entering Federal prisons,
1985-2000
Mean number of months to be
served in Federal prison by
offenders for whom an immigration offense was the most serious
offense
1985
-1986
3.6
1987
3.6
1988
4.1
1989
3.7
1990
3.6
1991
4.6
1992
5.4
1993
7.3
1994
9.5
1995
11
1996
13.9
1997
15.1
1998
16.5
1999
20
2000
20.6
Note: Estimates of time to be served are
subject to change. Once committed to the
Federal Bureau of Prisons, the term an
offender is required to serve may be adjusted
for reasons such as assistance to Federal
prosecutors and appellate review.
Source: Compendium of Federal Justice
Statistics, BJS report.

Appendix for figure on page 7.
Aliens apprehended by the U.S.
Immigration and Naturalization
Service, 1985-2000
Number of aliens apprehended by
the Immigration and Naturalization
Service
1985
1,348,749
1986
1,747,400
1987
1,190,488
1988
1,008,145
1989
954,243
1990
1,169,939
1991
1,197,875
1992
1,258,481
1993
1,327,261
1994
1,094,719
1995
1,394,554
1996
1,649,986
1997
1,536,520
1998
1,679,439
1999
1,714,035
Note: Represents observations for which
the most serious offense was an immigration
offense.
Source: Statistical Yearbook of the Immigration and Naturalization Service, 1999.

10 Immigration Offenders in the Federal Criminal Justice System, 2000

Appendix for figure on page 8. Noncitizens in Federal prisons, by the most
serious offense for which they were sentenced, 1985-2000

1985
1986
1987
1988
1989
1990
1991
1992
1993
1994
1995
1996
1997
1998
1999
2000

Most serious offense for which noncitizen Federal
prisoners were serving a sentence
Drug
Immigration
Other
3,111
1,275
1,175
4,099
1,469
1,398
4,978
1,345
1,528
5,948
1,363
1,560
7,647
1,542
1,469
9,284
1,515
1,550
10,817
1,549
1,680
12,706
1,568
1,843
14,012
2,118
2,088
14,226
2,478
2,225
15,705
3,362
3,641
16,407
4,411
3,456
17,254
5,355
3,862
17,288
7,251
3,503
18,573
9,859
3,979
20,146
13,162
3,240

Immigration Offenders in the Federal Criminal Justice System, 2000

11


