

Corrections Education in Utah 2012
Download original document:
Document text
Document text
This text is machine-read, and may contain errors. Check the original document to verify accuracy.
Corrections Education in Utah: Measuring Return on Investment
Richard Fowlesi
Department of Economics & Graduate Program in Statistics
University of Utah
October 2012
Executive Summary
Utah's public expenditure on corrections education is highly taxpayer efficient. This study finds:
•
Spending on corrections education programs in prison is taxpayer efficient in terms of
reduced recidivism costs associated with police, courts, corrections, and tangible costs
of crime. The benefit-cost ratio is estimated at 6.03.
•
Corrections education provides the basis for inmate integration into the workplace. The
estimated benefit-cost ratio of corrections education coupled with post release
employment is 13.66.
•
The Utah taxpayer breakeven cost of corrections education to cover recidivism costs of
police, courts, corrections, and tangible crime costs is $1,800 per client. Utah's
expenditure of $512 is substantially below this.
•
Education expenditures are inexpensive relative to other prison programming options
and thus result in large effects per dollar spent.;;
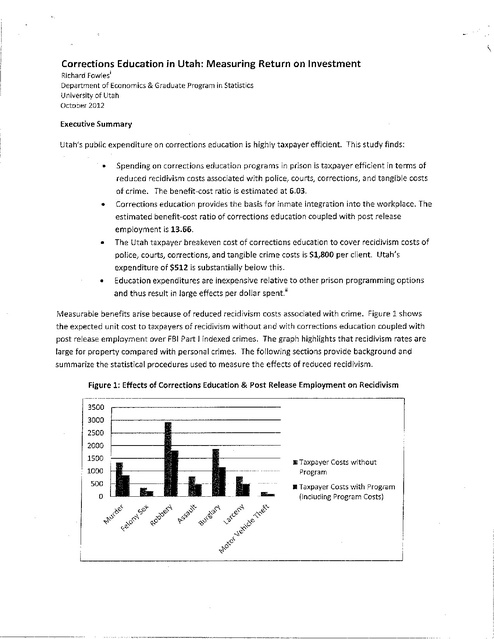
Measurable benefits arise because of reduced recidivism costs associated with crime. Figure 1 shows
the expected unit cost to taxpayers of recidivism without and with corrections education coupled with
post release employment over FBI Part I indexed crimes. The graph highlights that recidivism rates are
large for property compared with personal crimes. The following sections provide background and
summarize the statistical procedures used to measure the effects of reduced recidivism.
Figure 1: Effects of Corrections Education & Post Release Employment on Recidivism
3500
3000
2500
2000
1500
1000
500
0
ll Taxpayer
Costs without
Program
•Taxpayer Costs with Program
(Including Program Costs)
Background
In 2010, Utah taxpayers spent over $1.3 billion relating to criminal justice in areas of police, courts, and
corrections.'" This $470 per capita expense is an important and necessary component of public safety
cost and is below what other states spend on a per capita level.'' Nonetheless, with shrinking budgets in
the face of slow economic growth, Utah policy makers must be increasingly diligent when making
decisions regarding how taxpayers' monies are spent to enhance public safety and reduce crime. This
report uses a new method that provides policy makers with an instrument to better assess the economic
efficacy of crime-reducing programs, particularly on those designed to reduce recidivism via corrections
education. It is based on two economic metrics: a taxpayer benefit-cost ratio and a direct measure of
the cost per unit of recidivism reduction. Adept decisions by policy makers require that benefit and risk
simultaneously be taken into consideration when choosing among recidivism reduction programs. In
Utah, as in other states, spending on corrections education ranks among the most taxpayer efficient
legislative options.
Methodology
Comparing benefits and costs is a fundamental way that consumers seek to find good values in the
market. This method also forms the basis for optimal decision making by firms' managers seeking to
increase profits. Benefit-cost analyses are now being applied to non-market decision making, especially
by legislative decision makers who have to make difficult budget decisions faced with tightened
available monies.
A cost-benefit analysis (CBA) is an economic tool that evaluates the cost and benefits that are associated
with investing in various programs and projects. With respect to the criminal justice system, a CBA can
provide policy makers with a metric that is aligned with the expected return on tax dollars spent when
investing in programs that aim to lessen criminal activity. Because reduction in criminal activity is not
market priced, estimates of benefits arising from lower crime are required. The basis for a CBA involves
the statistical estimation of the unit, or marginal, cost and benefits of crime. The unit benefit is the
expected reduction in recidivism as a direct result of an inmate participating in a program such as
corrections education. This is then translated into monetary units upon which comparisons can be
made.
The unit cost of crime pertains to both taxpayer and victim costs. Taxpayer costs are tangible costs that
arise from the criminal justice system. These costs include the cost of police, courts, prosecutors, and
corrections. Victim costs can be both tangible and intangible. Examples of tangible victim costs are the
direct medical expenses and damage to property subject to victims of crime. Intangible victim costs
include pain, suffering, and an overall reduction in a person's quality of life. These indirect expenditures
are challenging to measure and remain a contentious topic. For simplicity, this report focuses attention
on direct taxpayer benefits and costs and considers only tangible victim costs. This choice is not meant
to downplay intangible victim costs, but estimates of these vary so widely that policy can be obscured.'
Data & Estimation
The econometric basis for this report relies on Utah's 2012 Benefit-Cost model developed by the Utah
Commission on Criminal and Juvenile Justice (CCJJ). Taxpayer costs are associated with police, courts,
and corrections. The sources of these data are described below.
Detailed cost data for police and sheriffs were obtained from the Office of the Utah State Auditor. Total
operating expenses related to county sheriff and local police departments were extracted from Utah's
29 counties and 79 of its municipalities' annual budgets between 2005 and 2010."; These expenditures
were put into constant 2010 dollars and aligned with arrest data obtained from the Bureau of Criminal
Investigation (BCI). A large sample was used in the estimation of marginal cost (n = 86, N = 516).
In the state of Utah, felony crimes are primarily prosecuted by county attorneys in the district courts.
With respect to the unit cost of courts, the number of weighted minutes required for each case type and
the total case filing count were obtained from the Administrative Office of the Courts for FY 2011. These
minutes are, if effect, true marginal costs but are dimensioned in time magnitudes and not in monetary
units. However, budget information allowed for the calculation of dollars per minute estimates.';; These
dollars per minute estimates were then multiplied by the number of weighted minutes needed for two
levels of felony crimes,';;; which directly gave us the marginal cost for courts.
The marginal cost of prosecution was estimated using a similar technique as for sheriff and local police
departments. Total annual operating budgets for Utah's 29 county prosecutors;' were obtained from
the Office of the Utah State Auditor between 2005 and 2010.
This study is limited to the cost of adult incarceration. The average annual cost of a prisoner was
obtained from the Utah Department of Corrections' and was used as a constant across all Part 1 Crimes.
The average annual cost per inmate was then multiplied with the probability of each indexed crime
leading to incarceration to derive the final unit cost estimate with respect to corrections. Table 1
summarizes the unit taxpayer costs associated with police, courts, and corrections for part 1 crime.
Table 1
Utah Unit Taxpayer & Victim Costs ($)
Taxpayer
Crime Type
tF::\_::r;}}g~;r~:-~;4~;~&~Mtfii(;t'~;;;t<~29, 791
18,776
Aggravated Assault
.·;~;t;~iji~9/J,Silc~s;/&?i
.?;ci± E'1 ~0?.~i§.?4~t7i.6ir·.~Yd
Larceny/Theft
'illi'iiit,il'r'Xliih.idei±Hiift:'.).> · •
9,671
•··;;;z,fi{3~•'
,•;•y/·,·
The marginal benefits of programs are translated into percentage reductions in recidivism. These
reductions are called the effect sizes. They can be estimated individually, or based on aggregation of
national estimates based on an assortment of studies. Because studies vary widely in terms of rigor, this
report relies on a meta-analysis of prison education that discounts results of observational studies
relative to studies that utilize an experimental or quasi-experimental design in measuring the effect size.
This report utilizes findings from Wilson, et al. (2000) which well aligns with other meta-analytic studies
and individual Utah studies.';
Results
Based on the 2012 Utah Benefit Cost Model and data provided by the Utah State Office of Education and
the Department of Corrections, the raw taxpayer benefit cost ratio is estimated at 2.9 and at 6.03 when
tangible victim costs are accounted for. The base recidivism rate is 50% for a 36-month return to
prison.';; The point estimated effect size attributed to corrections education is a 9 percentage point
decrease in recidivism, or an 18 percent reduction in recidivism. At a program cost of $512 per
offender, the expected reduction in direct recidivism costs (police, courts, and corrections) is $1,484 per
offender.';;; At the margin, Utah taxpayers directly realize nearly a $3.00 return on investment in
corrections education on police, courts, and corrections. This return on investment increases to over
$6.00 when tangible victim costs are included. These results are presented in the first part of Table 2.
A primary benefit of corrections education is that offenders can integrate into the workforce. The
effects of employment after release lower the expected recidivism rate to 31% (or a percentage
reduction in recidivism of 38%). As is shown in the second part ofTable 2, post release employment
doubles the efficiency ratio of corrections education.
Table 2
Benefit Cost Estimates
Utah Corrections Education
Base Recidivism
50%
Effect (Reduction in Recidivism)
18%
Utah Taxpayer+ Tangible Victim Efficiency Ratio
6.03
Program Recidivism With Post Release Employment
31%
Utah Taxpayer Efficiency Ratio with Employment
6.04
·... ,qtilh:r~kll"~~eR+fa'~.~limt~}yiriti.frl\~ttrc:i~hsxIB~~1#;W\~b·,~.l!i.e1.9¥:fue\if:'•·· ,, ·
c1'3xfi6
Conclusion
The efficiency of expenditures on corrections education is widely recognized.';' Education programs
provide basic tools that allow inmates to re-socialize while in prison and set a base for re-entry to labor
market upon release. Generally, prison inmates are less well educated than competing workers and
have a substantially higher labor market barrier to employment after release than other job candidates.
Providing basic education demonstrably lowers recidivism and enables parolees to participate in postrelease jobs programs to further enhance taxpayer benefits. Among policy options that legislators have
in considering recidivism reduction programs, education ranks among the most taxpayer efficient,
largely because educational programs are substantially lower than other programs and far lower than
the costs associated with incarceration.
Notes
; Email: richard.fowles@economics.utah.edu, Phone: (801) 581-4577, Fax: (801) 585-5649.
n See, for example, Aos, S. et al., "Return on Investment: Evidence-Based Options to Improve Statewide
Outcomes," Washington State Institute for Public Policy, July 2011.
rn Cost estimate includes expenditures on the state, county, and municipality level. State expenditures were
obtained from the Governor's Office of Planning & Budget and include total operating budgets for FY 2010 for
public safety, adult corrections, juvenile justice, board of pardons, and the attorney general's office. Case load
statistics for district courts were obtained for FY 2008 and allowed us to focus on the criminal and traffic (36
percent) portion of expenditures with respect to courts. All county and municipality expenditures were obtained
from the Office of the Utah State Auditor. County level expenditures include total operating budgets for sheriff
departments, justice courts, attorneys, and jails. Municipality level expenditures include total operating budgets
for local police departments, justice courts, and attorneys for 79 of Utah's municipalities. Some civil expenditures
are included for attorneys on the state, county, and municipality level and for courts on the county and
municipality level.
;, Bureau of Justice Statistics, December, 2011 Bureau of Justice Statistics (2011) [online]
[http://bjs.ojp.usdoj.gov/index.cfm?ty=pbdetail&iid=2192]. In calculating per capita justice expenditures for the
United States, BJS includes both criminal and civil police and judicial expenditures. For this study, we consider
mainly criminal expenditures.
'Tangible and intangible victim costs are well developed in Mccollister, K.E., et al., "The Cost of Crime to Society:
New Crime-Specific Estimates for Policy and Program Evaluation," Drug and Alcohol Dependence, 108(1), 98-109,
2010.
''The relatively few missing data points were imputed using standard techniques including linear interpolation and
averaging.
,;; Total operating budgets for the district courts for FY 2011 were obtained from the Governor's Office of Planning
& Budget.
,;;;Three levels of felony crimes (felony 1", felony 2"', and felony capital) were considered. Capital felony was
excluded since it represented less than .07 percent of these three levels of felony crimes. Hence, this study
reflects the modal rather than the extreme with respect to murder. Felony 1" and felony 2"' were translated to
violent and property crimes. Here we assume that felony 1" and felony 2"' is correlated with the UCR's definition
of violent and property crimes. In the future, it would be efficacious to obtain information that breaks this down
by offense type.
;, Because of data inconsistencies, the operating budgets for public defenders were not included.
'Utah Department of Corrections, Division of Institutional Operations, Cost Per Day Report, FY 2009.
Wilson, D.B. 1 et al., 11 A Meta-Analysis of Corrections-Based Education, Vocation, and Work Programs for Adult
Offenders," Journal of Research in Crime and Delinquency, 37, 347-368, 2000.
xi
'''The benefit-cost model assumes a total 36-month recidivism rate for any return at 65% but is recalibrated to
50% for this report. This slightly decreases the estimated benefit-cost ratio, thus the reported estimates are
somewhat conservative.
xiii Range estimates at 95 percent confidence limits show positive taxpayer effects with a 3 percentage point
decrease in recidivism. Detailed estimates are available upon request.
See, for example, Sedgely, et al. "Prison 1 s Dilemma: Do Education and Jobs Programmes Affect Recidivism?"
Economica, 77, 497-517, 2010.
xiv


