

DOJ, Bureau of Justice Statistics - Jail Inmates at Midyear 2014, 2015
Download original document:
Document text
Document text
This text is machine-read, and may contain errors. Check the original document to verify accuracy.
U.S. Department of Justice
Office of Justice Programs
Bureau of Justice Statistics
June 2015, NCJ 248629
Todd D. Minton and Zhen Zeng, Ph.D., BJS Statisticians
T
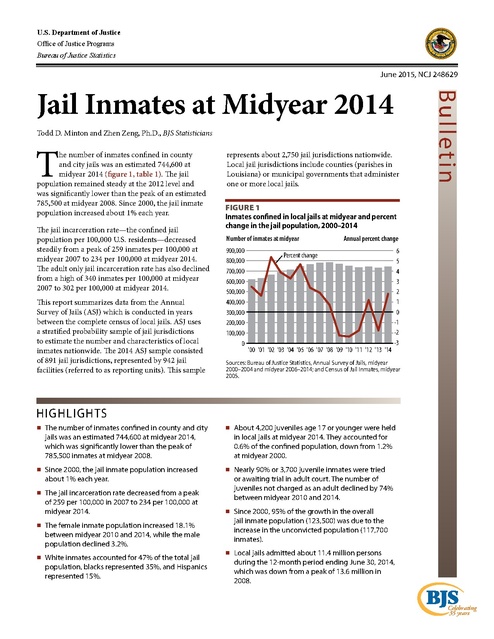
he number of inmates confined in county
and city jails was an estimated 744,600 at
midyear 2014 (figure 1, table 1). The jail
population remained steady at the 2012 level and
was significantly lower than the peak of an estimated
785,500 at midyear 2008. Since 2000, the jail inmate
population increased about 1% each year.
The jail incarceration rate—the confined jail
population per 100,000 U.S. residents—decreased
steadily from a peak of 259 inmates per 100,000 at
midyear 2007 to 234 per 100,000 at midyear 2014.
The adult only jail incarceration rate has also declined
from a high of 340 inmates per 100,000 at midyear
2007 to 302 per 100,000 at midyear 2014.
This report summarizes data from the Annual
Survey of Jails (ASJ) which is conducted in years
between the complete census of local jails. ASJ uses
a stratified probability sample of jail jurisdictions
to estimate the number and characteristics of local
inmates nationwide. The 2014 ASJ sample consisted
of 891 jail jurisdictions, represented by 942 jail
facilities (referred to as reporting units). This sample
represents about 2,750 jail jurisdictions nationwide.
Local jail jurisdictions include counties (parishes in
Louisiana) or municipal governments that administer
one or more local jails.
Bul l etin
Jail Inmates at Midyear 2014
Figure 1
Inmates confined in local jails at midyear and percent
change in the jail population, 2000–2014
Number of inmates at midyear
900,000
800,000
700,000
600,000
500,000
400,000
300,000
200,000
100,000
0
Annual percent change
Percent change
'00 '01 '02 '03 '04 '05 '06 '07 '08 '09 '10 '11 '12 '13 '14
6
5
4
3
2
1
0
-1
-2
-3
Sources: Bureau of Justice Statistics, Annual Survey of Jails, midyear
2000–2004 and midyear 2006–2014; and Census of Jail Inmates, midyear
2005.
HIGHLIGHTS
The number of inmates confined in county and city
jails was an estimated 744,600 at midyear 2014,
which was significantly lower than the peak of
785,500 inmates at midyear 2008.
Since 2000, the jail inmate population increased
about 1% each year.
The jail incarceration rate decreased from a peak
of 259 per 100,000 in 2007 to 234 per 100,000 at
midyear 2014.
The female inmate population increased 18.1%
between midyear 2010 and 2014, while the male
population declined 3.2%.
White inmates accounted for 47% of the total jail
population, blacks represented 35%, and Hispanics
represented 15%.
About 4,200 juveniles age 17 or younger were held
in local jails at midyear 2014. They accounted for
0.6% of the confined population, down from 1.2%
at midyear 2000.
Nearly 90% or 3,700 juvenile inmates were tried
or awaiting trial in adult court. The number of
juveniles not charged as an adult declined by 74%
between midyear 2010 and 2014.
Since 2000, 95% of the growth in the overall
jail inmate population (123,500) was due to the
increase in the unconvicted population (117,700
inmates).
Local jails admitted about 11.4 million persons
during the 12-month period ending June 30, 2014,
which was down from a peak of 13.6 million in
2008.
Celebrating
35 years
Table 1
Inmates confined in local jails at midyear, average daily population, and incarceration rates, 2000–2014
Year
2000
2001
2002
2003
2004
2005
2006
2007
2008
2009
2010
2011
2012
2013
2014*
Average annual change
2000–2013
2013–2014
Inmates confined at midyeara
Year-to-year change
Total
Number
Percent
621,149**
15,206
2.5%
631,240**
10,091
1.6
665,475**
34,235
5.4
691,301**
25,826
3.9
713,990**
22,689
3.3
747,529
33,539
4.7
765,819**
18,290
2.4
780,174**
14,355
1.9
785,533**
5,359
0.7
767,434**
-18,099
-2.3
748,728
-18,706
-2.4
735,601
-13,127
-1.8
744,524
8,923
1.2
731,208
-13,316
-1.8
744,592
13,384
1.8
1.3%
1.8
Average daily populationb
Year-to-year change
Total
Number
Percent
618,319**
10,341
1.7%
625,966**
7,647
1.2
652,082**
26,116
4.2
680,760**
28,678
4.4
706,242**
25,482
3.7
733,442
27,200
3.9
755,320
21,878
3.0
773,138
17,818
2.4
776,573**
3,435
0.4
768,135**
-8,438
-1.1
748,553
-19,582
-2.5
735,565
-12,988
-1.7
737,369
1,804
0.2
731,352
-6,017
-0.8
738,975
7,623
1.0
Jail incarceration ratec
Adults and juvenilesd Adults only
220
292
222
294
231
307
238
315
243
322
252
334
256
338
259
340
258
338
250
327
242
315
236
307
237
308
231
299
234
302
1.3%
1.0
Note: Detail may not sum to total because of rounding. See appendix table 1 for standard errors.
*Comparison year on confined inmates and average daily population.
**Difference with comparison year is significant at the 95% confidence level. See Methodology for tests of significance.
aNumber of inmates held on the last weekday in June.
bSum of all inmates in jail each day for a year, divided by the number of days in the year.
cNumber of inmates confined at midyear per 100,000 U.S. residents.
dJuveniles are persons age 17 or younger at midyear.
Sources: Bureau of Justice Statistics, Annual Survey of Jails, midyear 2000–2004 and midyear 2006–2014; and Census of Jail Inmates, midyear 2005.
J A I L I N M AT E S AT M I DY E A R 2014 | J U N E 2015
2
Males have made up at least 85% of the jail population since
2000. The female inmate population increased 18.1% (up
16,700 inmates) between midyear 2010 and 2014, while
the male population declined 3.2% (down 20,900 inmates)
(table 2, table 3). The female jail population grew by an
average of about 1.6% every year between 2005 and 2014. In
comparison, the male jail population declined by 0.3% every
year since 2005 (not shown).
White inmates accounted for 47% of the total jail population,
blacks represented 35%, and Hispanics represented 15% at
midyear 2014. From midyear 2010 to 2014, white inmates
increased by 21,200, while black (19,400) and Hispanic (7,500)
inmates declined.
Table 2
Number of inmates in local jails, by characteristics, midyear 2000 and 2005–2014
Characteristic
Totalb
Sex
Male
Female
Adult
Male
Female
Juvenilec
Held as adultd
Held as juvenile
Race/Hispanic origine
Whitef
Black/African Americanf
Hispanic/Latino
American Indian/
Alaska Nativef,g
Asian/Native Hawaiian/
Other Pacific Islanderf,g
Two or more racesf
Conviction statuse,h
Convicted
Unconvicted
2000
621,149**
2005
747,529
2006
765,819**
2007
780,174**
2008
785,533**
2009
767,434**
2010
748,728
2011a
735,601
2012a
744,524
2013a
731,208
2014*a
744,592
550,162**
70,987**
613,534**
543,120**
70,414**
7,615**
6,126**
1,489**
652,958**
94,571**
740,770
646,807**
93,963**
6,759**
5,750**
1,009
666,819**
99,000**
759,717**
661,164**
98,552**
6,102**
4,835**
1,268
679,654**
100,520**
773,341**
673,346**
99,995**
6,833**
5,649**
1,184
685,862**
99,670**
777,829**
678,657**
99,172**
7,703**
6,410**
1,294
673,728**
93,706**
760,216**
667,039**
93,176**
7,218**
5,846**
1,373
656,360**
92,368**
741,168
649,284**
91,884**
7,560**
5,647**
1,912**
642,300
93,300**
729,700
636,900
92,800**
5,900**
4,600**
1,400
645,900
98,600**
739,100
640,900
98,100**
5,400**
4,600**
900
628,900
102,400**
726,600
624,700
101,900**
4,600
3,500
1,100
635,500
109,100
740,400
631,600
108,800
4,200
3,700
500
260,500**
256,300
94,100**
331,000**
290,500**
111,900
336,500**
295,900**
119,200**
338,200**
301,700**
125,500**
333,300**
308,000**
128,500**
326,400**
300,500**
124,000**
331,600**
283,200**
118,100**
329,400**
276,400**
113,900
341,100
274,600
112,700
344,900
261,500
107,900
352,800
263,800
110,600
5,500**
7,600**
8,400
8,600
9,000
9,400
9,900
9,400
9,300
10,200
10,400
4,700**
...
5,400**
1,000
5,100**
700
5,300**
800
5,500**
1,300
5,400**
1,800**
5,100**
800
5,300**
1,200
5,400
1,500**
290,000**
475,800
296,700**
483,500**
291,200**
494,200**
290,100**
477,300
291,300**
457,400
289,600**
446,000**
293,100**
451,400**
271,300
349,800**
284,400
463,200
5,100**
1,600**
278,000
453,200
6,000
1,000
277,100
467,500
Note: Detail may not sum to total because of rounding. See appendix table 2 for reported data and appendix table 3 for standard errors.
…Not collected.
*Comparison year for each characteristic.
**Difference with comparison year is significant at the 95% confidence level.
aData for 2011–2014 are adjusted for nonresponse and rounded to the nearest 100.
bMidyear count is the number of inmates held on the last weekday in June.
cPersons age 17 or younger at midyear.
dIncludes juveniles who were tried or awaiting trial as adults.
eData adjusted for nonresponse and rounded to the nearest 100. See Methodology.
fExcludes persons of Hispanic or Latino origin.
gPrevious reports combined American Indians and Alaska Natives and Asians, Native Hawaiians, and other Pacific Islanders into an Other race category.
hIncludes juveniles who were tried or awaiting trial as adults.
Sources: Bureau of Justice Statistics, Annual Survey of Jails, midyear 2000 and midyear 2006–2014; and Census of Jail Inmates, midyear 2005.
J A I L I N M AT E S AT M I DY E A R 2014 | J U N E 2015
3
About 4,200 juveniles age 17 or younger were held in local
jails at midyear 2014. They accounted for 0.6% of the confined
population, down from 1.2% at midyear 2000. Nearly 90%
or 3,700 juvenile inmates were tried or awaiting trial in
adult court. The number of juveniles not charged as an adult
declined by 74% between midyear 2010 and 2014 (from 1,900
to 500 inmates).
offenders or convicted offenders awaiting sentencing. From
midyear 2013 to 2014, the number of unconvicted inmates
and the number of convicted inmates remained statistically
the same. Since 2000, 95% of the growth in the overall jail
inmate population (up 123,500) was due to the increase in the
unconvicted population (up 117,700 inmates) and 5% was due
to the increase in the convicted population (up 5,800 inmates).
At midyear 2014, about 6 in 10 inmates were not convicted, but
were in jail awaiting court action on a current charge—a rate
unchanged since 2005. About 4 in 10 inmates were sentenced
Table 3
Percent of inmates in local jails, by characteristics, midyear 2000 and 2005–2014
Characteristic
Sex
Male
Female
Adult
Male
Female
Juvenilea
Held as adultb
Held as juvenile
Race/Hispanic originc
Whited
Black/African Americand
Hispanic/Latino
American Indian/
Alaska Natived,e
Asian/Native Hawaiian/
Other Pacific Islanderd,e
Two or more racesd
Conviction statusb,c
Convicted
Unconvicted
2000
2005
2006
2007
2008
2009
2010
2011
2012
2013
2014
88.6%
11.4
98.8%
87.4
11.3
1.2%
1.0
0.2
87.3%
12.7
99.1%
86.5
12.6
0.9%
0.8
0.1
87.1%
12.9
99.2%
86.3
12.9
0.8%
0.6
0.2
87.1%
12.9
99.1%
86.3
12.8
0.9%
0.7
0.2
87.3%
12.7
99.0%
86.4
12.6
1.0%
0.8
0.2
87.8%
12.2
99.1%
86.9
12.1
0.9%
0.8
0.2
87.7%
12.3
99.0%
86.7
12.3
1.0%
0.8
0.3
87.3%
12.7
99.2%
86.6
12.6
0.8%
0.6
0.2
86.8%
13.2
99.3%
86.1
13.2
0.7%
0.6
0.1
86.0%
14.0
99.4%
85.4
13.9
0.6%
0.5
0.1
85.3%
14.7
99.4%
84.8
14.6
0.6%
0.5
0.1
41.9%
41.3
15.2
44.3%
38.9
15
43.9%
38.6
15.6
43.3%
38.7
16.1
42.5%
39.2
16.4
42.5%
39.2
16.2
44.3%
37.8
15.8
44.8%
37.6
15.5
45.8%
36.9
15.1
47.2%
35.8
14.8
47.4%
35.4
14.9
0.9
1.0
1.1
1.1
1.1
1.2
1.3
1.3
1.2
1.4
1.4
0.8
...
0.7
0.1
0.7
0.1
0.7
0.1
0.7
0.2
0.7
0.2
0.7
0.1
0.7
0.2
0.7
0.2
0.7
0.2
0.8
0.1
44.0%
56.0
38.0%
62.0
37.9%
62.1
38.0%
62.0
37.1%
62.9
37.8%
62.2
38.9%
61.1
39.4%
60.6
39.4%
60.6
38.0%
62.0
37.2%
62.8
Note: Percentages are based on the total number of inmates held on the last weekday in June. Detail may not sum to total because of rounding. See table 2 for significance
test. See appendix table 4 for standard error ratios.
…Not collected.
aPersons age 17 or younger at midyear.
bIncludes juveniles who were tried or awaiting trial as adults.
cData adjusted for nonresponse. See Methodology.
dExcludes persons of Hispanic or Latino origin.
ePrevious reports combined American Indians and Alaska Natives and Asians, Native Hawaiians, and other Pacific Islanders into an Other race category.
Sources: Bureau of Justice Statistics, Annual Survey of Jails, midyear 2000 and midyear 2006–2014; and Census of Jail Inmates, midyear 2005.
J A I L I N M AT E S AT M I DY E A R 2014 | J U N E 2015
4
Nearly half of jail inmates were held in less than 10%
of jails
The largest jails (those with an average daily population
(ADP) of 1,000 or more inmates) held 47% of the jail inmate
population at midyear 2014, but accounted for 6% of all jail
jurisdictions nationwide (table 4). In comparison, the smallest
jail jurisdictions (those with an ADP of less than 50 inmates)
held 3% of the inmate population, but accounted for 38% of
all jail jurisdictions. Jail jurisdictions with an ADP of 50 to
99
inmates and 100 to 249 inmates accounted for about 20%
each of jail jurisdictions. Combined, these jail jurisdictions
held 19% of all inmates. Jail jurisdictions with an ADP of 250
to 999 inmates accounted for 17% of all jail jurisdictions, but
held 31% of all inmates at midyear 2014. Similar patterns were
observed in 2013 for all categories.
Table 4
Inmates confined in local jails at midyear, by size of jurisdiction, 2013–2014
Jurisdiction sizeb
Total
49 or fewer
50–99
100–249
250–499
500–999
1,000 or more
2013
731,208
23,545
38,970
95,031
102,362
123,155
348,145
Inmates confined at midyeara
2014
Difference
744,592
13,384
25,058
1,513
42,172
3,202
96,443
1,412
101,609
-753
128,070
4,915
351,239
3,094
Percent change
1.8%
6.4
8.2
1.5
-0.7
4.0
0.9
Percent of all inmates
2013
2014
100%
100%
3.2
3.4
5.3
5.7
13.0
13.0
14.0
13.6
16.8
17.2
47.6
47.2
Note: Detail may not sum to total because of rounding. All comparisons by jurisdiction size are not significant at the 95%-confidence level. See appendix table 5 for standard
errors.
aNumber of inmates held on the last weekday in June.
bStandardized on the average daily population (ADP) for the 12-month period ending June 30, 2006, the first year in the current Annual Survey of Jails sample. ADP is the sum
of all inmates in jail each day for a year, divided by the number of days in the year.
Source: Bureau of Justice Statistics, Annual Survey of Jails, midyear 2013–2014.
J A I L I N M AT E S AT M I DY E A R 2014 | J U N E 2015
5
Increase in new bed space between 2013 and 2014 was
similar to the average annual increase between 2000
and 2013
Figure 2
Midyear custody population, average daily population (ADP),
and rated capacity in local jails, 2000–2014
Rated capacity in jails reached an estimated 890,500 beds at
midyear 2014, an increase of nearly 4% from 857,900 beds
at midyear 2010 (figure 2, table 5). Rated capacity is the
maximum number of beds or inmates allocated to each jail
facility by a state or local rating official.
Inmate population/bed space
Since peaking in 2007 (96%), the percentage of rated capacity
occupied at midyear 2014 (84%) was the lowest since 2000. At
midyear 2014, jail jurisdictions holding 250 or more inmates
reported a higher percentage of occupied bed space (85% to
87%) than smaller jail jurisdictions holding fewer than 250
inmates (67% to 79%) (table 6).
In addition to the ratio of midyear jail population to rated
capacity, two additional measures can be used to measure jail
crowding—the ratio of ADP in a year to rated capacity, and
the ratio of the number of inmates on the most crowded day
in June to rated capacity. Using these measures, the nation’s
jails operated at about 83% of rated capacity on an average day
and about 89% of rated capacity on their most crowded day in
June 2014.
900,000
Rated capacitya
800,000
ADPc
700,000
Inmates confined
at midyearb
600,000
500,000
400,000
300,000
200,000
100,000
0
'00 '01 '02 '03 '04 '05 '06 '07 '08 '09 '10 '11 '12 '13 '14
aMaximum number of beds or inmates assigned by a rating official to a facility,
excluding separate temporary holding areas.
bNumber of inmates held on the last weekday in June.
cSum of all inmates in jail each day for a year, divided by the number of days in the
year.
Sources: Bureau of Justice Statistics, Annual Survey of Jails, midyear 2000–2004 and
midyear 2006–2014; and Census of Jail Inmates, midyear 2005.
Table 5
Rated capacity of local jails and percent of capacity occupied, 2000 and 2005–2014
Year
2000
2005
2006
2007
2008
2009
2010
2011
2012
2013
2014*
Average annual change
2000–2013
2013–2014
Rated capacityc
677,787**
786,954**
794,984**
810,543**
828,714**
849,895**
857,918**
870,422
877,396
872,943
890,486
2.0%
2.0
Year-to-year change in rated capacitya
Number
Percent
25,466
3.9%
33,398
4.1
8,638
1.0
15,863
2.0
18,171
2.2
21,181
2.6
8,023
0.9
12,504
1.5
6,974
0.8
-4,453
-0.5
17,543
2.0
Percent of capacity occupiedb
Midyeard
Average daily populatione
92.0%**
91.2%**
95.0**
93.2**
96.3**
95.0**
96.3**
95.4**
94.8**
93.7**
90.3**
90.4**
87.3**
87.3**
84.5
84.5
84.9
84.0
83.8
83.8
83.6
83.0
17,199
17,543
Note: See appendix table 6 for standard errors.
*Comparison year on rated capacity and percent of capacity occupied.
**Difference with comparison year is significant at the 95% confidence level.
aIncrease or reduction in the number of beds during the 12 months ending midyear of each year. Number and percentage change for 2000 are calculated using the rated
capacity of 652,321 for 1999.
bBased on the confined inmate population divided by the rated capacity and multiplied by 100.
cMaximum number of beds or inmates assigned by a rating official to a facility, excluding separate temporary holding areas.
dNumber of inmates held on the last weekday in June.
eSum of all inmates in jail each day for a year, divided by the number of days in the year.
Sources: Bureau of Justice Statistics, Annual Survey of Jails, midyear 2000 and midyear 2006–2014; and Census of Jail Inmates, midyear 2005.
J A I L I N M AT E S AT M I DY E A R 2014 | J U N E 2015
6
While the confined population and rated jail capacity both
increased at roughly comparable rates from 2000 through
2008, the growth rates have diverged since 2008. The confined
population declined by 0.9% on average per year, while rated
capacity increased by 1.2% on average per year. The increase
in capacity and decrease in confined population almost
equally contributed to the decline in the percentage of capacity
occupied, from 95% at midyear 2008 to 84% at midyear 2014.
From midyear 2008 to 2014, jail jurisdictions holding 100 to
249 inmates experienced the largest percentage increase
in rated capacity relative to population change (figure 3).
These jurisdictions reported an 18% increase in their rated
capacity and a small increase (less than 1%) in their inmate
population. The smallest jail jurisdictions, which held fewer
than 50 inmates, reported the smallest percentage increase in
rated capacity (up 4.9%) relative to population change (down
1.2%). Jails holding more than 250 inmates experienced a
decline in their midyear jail population and an increase in their
rated capacity.
Table 6
Percent of jail capacity occupied at midyear, by size of
jurisdiction, 2013–2014
Figure 3
Percent change in the midyear custody population and rated
capacity between 2008 and 2014
Jurisdiction size
Total
49 or fewer
50–99
100–249
250–499
500–999
1,000 or more
Percent change
2013
83.8%
64.4
69.4
77.9
87.3
84.9
87.9**
2014*
83.6%
67.0
74.2
78.7
86.7
85.0
86.5
Note: Number of inmates held on the last weekday in June divided by the rated
capacity multiplied by 100. Jurisdiction size is standardized on the average daily
population for the 12-month period ending June 30, 2006, the first year in the
current Annual Survey of Jails sample. See appendix table 7 for standard errors.
*Comparison year on percent of capacity occupied at midyear.
**Difference with comparison year is significant at the 95% confidence level.
Source: Bureau of Justice Statistics, Annual Survey of Jails, midyear 2013–2014.
20
15
10
5
Rated capacitya
0
-5
-10
Number of inmatesb
Total
49 or
fewer
50
to 99
100
to 249
250
to 499
500
to 999
1,000
or more
Note: Jail jurisdiction size is standardized to the average daily population (ADP)
for the 12-month period ending June 30, 2006, the first year in the current Annual
Survey of Jails sample. ADP is the sum of all inmates in jail each day for a year,
divided by the number of days in the year.
aMaximum number of beds or inmates assigned by a rating official to a facility,
excluding separate temporary holding areas.
bNumber of inmates held on the last weekday in June.
Source: Bureau of Justice Statistics, Annual Survey of Jails, 2008 and 2014.
J A I L I N M AT E S AT M I DY E A R 2014 | J U N E 2015
7
Local jails admitted 11.4 million persons during the
12-month period ending midyear 2014
Local jails admitted an estimated 11.4 million persons during
the 12-month period ending June 30, 2014, a stable estimate
since 2011 (11.8 million), but down from a peak of 13.6 million
admissions in 2008. The number of persons admitted in 2014
was 15 times the size of the ADP (an estimated 739,000)
during the 12-month period ending June 30, 2014. (See
Methodology for methods used to estimate admissions.)
Nearly 4 in 10 admissions to jail during the last week of
June 2014 were to the largest jail jurisdictions (table 7). In
comparison, jail jurisdictions holding fewer than 50 inmates
accounted for 6% of all jail admissions. For these jurisdictions,
the number of inmates admitted was 28 times the size of
the ADP between midyear 2013 and 2014. These small jail
jurisdictions also experienced the highest turnover rate
(104%), measured as the change in admissions and releases by
the ADP. (See Methodology for detail.) The turnover rate was
the smallest in large jail jurisdictions (49%). Higher turnover
rates mean larger numbers of admissions and releases relative
to the size of the ADP.
Table 7
Average daily jail population, admissions, and turnover rate, by size of jurisdiction, week ending June 30, 2013 and 2014
Jurisdiction sizec
Total
49 or fewer
50–99
100–249
250–499
500–999
1,000 or more
2013
731,352
23,301
38,721
93,653
102,045
123,220
350,412
Average daily populationa
2014
Difference
738,975
7,623
23,490
189
40,554
1,833
96,200
2,547
99,889
-2,156
125,954
2,734
352,888
2,476
Estimated number of admissions
during the last week in June
2013
2014*
224,536
218,924
15,296
12,610
16,315
18,763
32,470
32,087
35,003
33,527
46,806
35,430
78,645**
86,507
Weekly turnover rateb
2013
2014*
60.2%
58.1%
121.1
104.2
83.6
87.2
67.9
65.5
66.3
65.0
75.5
56.1
44.3**
48.5
Note: Detail may not sum to total because of rounding. See Methodology for more detail on estimation procedures. All comparisons by average daily population are not
significant at the 95%-confidence level. See appendix table 8 for standard errors.
*Comparison year on admissions and weekly turnover rate.
**Difference with comparison year is significant at the 95% confidence level.
aSum of all inmates in jail each day for a year.
bCalculated by adding weekly admissions and releases, dividing by the average daily population (ADP), and multiplying by 100.
cStandardized on the ADP for the 12-month period ending June 30, 2006, the first year in the current Annual Survey of Jails sample.
Source: Bureau of Justice Statistics, Annual Survey of Jails, midyear 2013–2014.
J A I L I N M AT E S AT M I DY E A R 2014 | J U N E 2015
8
Other selected data from ASJ
Table 8
Inmate population in jail jurisdictions reporting on confined
persons being held for U.S. Immigration and Customs
Enforcement (ICE), midyear 2002–2014
Year
2002
2003
2004
2005
2006
2007
2008
2009
2010
2011
2012
2013
2014
Jurisdictions
reporting on
holdings for ICEa
2,961
2,940
2,962
2,824
2,784
2,713
2,699
2,643
2,531
2,758
2,716
2,685
2,634
Inmates
confined at
midyearb
626,870
637,631
673,807
703,084
698,108
683,640
704,278
685,500
622,954
672,643
690,337
673,707
654,730
Confined persons held
for ICE at midyear
Percent of
Number
all inmates
12,501
2.0%
13,337
2.1
14,120
2.1
11,919
1.7
13,598
1.9
15,063
2.2
20,785
3.0
24,278
3.5
21,607
3.5
22,049
3.3
22,870
3.3
17,241
2.6
16,384
2.5
Note: Data are based on the reported data and were not estimated for survey item
nonresponse. Comparisons were not tested due to changing coverage each year.
See appendix table 9 for standard errors.
aNot all jurisdictions reported on holdings for ICE.
bNumber of inmates held on the last weekday in June in jails reporting complete
data or the number of inmates held for ICE.
Sources: Bureau of Justice Statistics, Annual Survey of Jails, midyear 2002–2004 and
midyear 2006–2014; and Census of Jail Inmates, midyear 2005.
Table 9
Persons under jail supervision, by confinement status and type of program, midyear 2000 and 2006–2014
Confinement status and type of program
Total
Held in jaila
Supervised outside of a jail facilityb
Weekend programsc
Electronic monitoring
Home detentiond
Day reporting
Community service
Other pretrial supervision
Other work programse
Treatment programsf
Other
2000
687,033**
621,149**
65,884
14,523**
10,782**
332
3,969
13,592
6,279**
8,011
5,714**
2,682
2006
826,041
765,819**
60,222
11,421**
10,999**
807
4,841
14,667
6,409**
8,319**
1,486**
1,273**
2007
848,419**
780,174**
68,245
10,473
13,121
512
6,163**
15,327
11,148**
7,369
2,276
1,857**
2008
858,385**
785,533**
72,852**
12,325**
13,539
498
5,758**
18,475**
12,452**
5,808
2,259
1,739
2009
837,647**
767,434**
70,213**
11,212**
11,834**
738
6,492**
17,738**
12,439**
5,912
2,082
1,766**
2010
809,360
748,728
60,632
9,871
12,319
736
5,552**
14,646
9,375
4,351**
1,799
1,983**
2011
798,417
735,601
62,816
11,369**
11,950**
809
5,200
11,680
10,464
7,165
2,449
1,731**
2012
808,622
744,524
64,098
10,351
13,779
2,129**
3,890
14,761
7,738
7,137
2,164
2,149
2013
790,649
731,208
59,441
10,950
12,023**
1,337**
3,683
13,877
7,542
5,341**
2,002
2,687
2014*
808,070
744,592
63,478
9,698
14,223
646
4,413
14,331
8,634
7,003
2,100
2,430
Note: See appendix table 10 for standard errors.
*Comparison year by status and program.
**Difference with comparison year is significant at the 95% confidence level.
aNumber of inmates held on the last weekday in June.
bNumber of persons under jail supervision but not confined on the last weekday in June. Excludes persons supervised by a probation or parole agency.
cOffenders serve their sentences of confinement on weekends only (i.e., Friday to Sunday).
dIncludes only persons without electronic monitoring.
eIncludes persons in work release programs, work gangs, and other alternative work programs.
fIncludes persons in drug, alcohol, mental health, and other medical treatment.
Source: Bureau of Justice Statistics, Annual Survey of Jails, midyear 2000 and midyear 2006–2014.
J A I L I N M AT E S AT M I DY E A R 2014 | J U N E 2015
9
Methodology
Response rate, nonresponse adjustment, and out-of-scope
jail facilities
Annual Survey of Jails
The 2014 ASJ sample initially comprised 942 reporting
units. However, 12 units were out-of-scope for the 2014
data collection because they had closed either permanently
or temporarily, which resulted in a sample of 930 active
respondents. Ninety-three percent (or 878) of the 930 active
individual reporting units responded to the 2014 data
collection, and 52 active individual reporting units did not
respond to the survey.
In years between the complete census of local jails, the
Bureau of Justice Statistics (BJS) conducts the Annual Survey
of Jails (ASJ). ASJ uses a stratified probability sample of jail
jurisdictions to estimate the number and characteristics of
local inmates nationwide. The 2014 ASJ sample consisted of
891 jail jurisdictions, represented by 942 jail facilities (referred
to as reporting units). This sample represents about 2,750 jail
jurisdictions nationwide. Local jail jurisdictions include
counties (parishes in Louisiana) or municipal governments
that administer one or more local jails.
In the sampling design, the jail jurisdictions nationwide
were grouped into 10 strata. The 10 strata were defined by
the interaction of two variables: the jail jurisdiction average
daily population (ADP) in 2005, and whether in 2005 the
jurisdiction held at least one juvenile. For 8 of the 10 strata,
a random sample of jail jurisdictions was selected. For the
remaining two strata, all jurisdictions were included in the
sample. One stratum consisted of all jails (70) that were
operated jointly by two or more jurisdictions (referred to as
multi-jurisdictional jails). The other stratum (referred to as
certainty stratum) consisted of all jail jurisdictions (267) that—
held juvenile inmates at the time of the 2005 Census of Jail
Inmates and had an ADP of 500 or more inmates during the
12 months ending June 30, 2005.
held only adult inmates and had an ADP of 750 or more.
The sampling design used for the 2014 ASJ is the same as the
design used for the 2013 ASJ. The 2013 ASJ differed from
the 2006–2012 ASJs in that it included in the sample, with a
probability of one, all California jail jurisdictions in response
to the two enacted laws—AB 109 and AB 117 by the California
State Legislature and governor—to reduce the number of
inmates housed in state prisons starting October 1, 2011.
The inclusion of all California jail jurisdictions resulted in an
additional 21 jail jurisdictions (for a total sample size of 891
jurisdictions). Since the enactment of the two laws in recent
years, the California jail population has experienced changes
in size that cannot be compared to the changes of any other
state
in the U.S. For this reason, the California jail jurisdictions
were put in separate strata so that they could represent only
California jurisdictions. The same sampling design was
adopted for the California jurisdictions.
BJS obtained data from sampled jail jurisdictions by mailed
and web-based survey questionnaires. After follow-up
phone calls and facsimiles, the item response rate for jails
that responded to the survey was nearly 100% for critical
items, such as the number of inmates confined, ADP, and
rated capacity. (See appendix tables 1 to 7 for standard errors
associated with reported estimates from the 2014 ASJ.)
J A I L I N M AT E S AT M I DY E A R 2014 | J U N E 2015
BJS implemented nonresponse weight adjustment procedures
to account for unit nonresponse, as it did in 2011 to 2013.
Respondent indicators
The respondent reporting unit indicator JAILRhij is set for each
individual reporting unit j in jurisdiction i in stratum h on the
file, based on the status of the individual reporting unit.
{
1 if respondent or using prior year data,
JAILRhij =
0
if nonrespondent, closed, or out‐of‐scope.
The respondent jurisdiction indicator JURISRhi is set for each
jurisdiction i in stratum h on the file, based on the value of
JAILRhij for the reporting units within the jurisdiction.
JURISRhi =
n
JAILR
∑
j=1
{ 0 otherwise.
i
1 if
hij ≥ 1
Active indicators
The active reporting unit indicator JAILAhij is set for each
individual reporting unit j in jurisdiction i in stratum h on the
file, based on the status of the individual reporting unit.
{
1 if respondent, using prior year data, or nonrespondent
JAILAhij =
0
if closed or out‐of‐scope.
The active jurisdiction indicator JURISAhi is set for each
jurisdiction i in stratum h on the file, based on the value of
JAILAhij for the reporting units within the jurisdiction.
n
JAILA
∑
JURISA = {
j=1
0 otherwise.
i
1 if
hij ≥ 1
hi
Nonresponse weighting adjustment factor
The nonresponse weighting adjustment factor is calculated
within each stratum. BJS uses the sample weights in the
nonresponse adjustment factor. The nonresponse weighting
adjustment factor F2h is calculated as
∑ ni=1 W × JURISA
∑ ni=1 W × JURISR
h
F2h =
h
hi
hi
hi
hi
10
where
nh = number of jurisdictions sampled in stratum h,
whi = sample weight for jurisdiction i in stratum h.
In 2014, all 63 California jail jurisdictions responded, so their
final weights post-stratification were 1.
The post-stratification adjustment for non-California jail
jurisdictions is computed as
Final weight
PSCAh =
The final weight FWhi for each jail jurisdiction on the 2014 ASJ
data file is calculated as
FWhi = Whi × F2h × JURISRhi
where
whi = sample weight for jurisdiction i in stratum h.
JAILRhi is used to set the final weight to 0 for units that are
closed, out-of-scope, or nonrespondents.
Final weight post-stratification: California jail jurisdictions
and the Public Safety Realignment
Because of the California Public Safety Realignment, between
midyear 2011 and midyear 2014, California jails experienced
a significant increase in the number of inmates (about
13,900 inmates) that was not experienced by jails nationwide.
To capture this jail population growth in California more
accurately, all California jurisdictions were added to the ASJ
sample in 2013. Accordingly, BJS computed new weights to
ensure that the sampled California jail jurisdictions represent
California jurisdictions only. Without computing these new
weights, the estimated nationwide jail population would be
erroneously inflated.
The post-stratification final weight adjustment is calculated
for each stratum from which California jurisdictions
were sampled. More specifically for each stratum, two
new strata and set of weights were created: one for the
California jurisdictions (PSCAh) and one for the nonCalifornia jurisdictions (PSCAh). In 2013, all California jail
jurisdictions were included in the sample; however, not all of
them responded.
The weight adjustment for California jail jurisdictions is
computed as
PSCAh =
∑
NCAh
nCAh
JURISRCAhi
i=1
where
NCAh = number of active California jurisdictions in stratum h,
nCAh = number of sampled California jurisdictions in stratum
h
J A I L I N M AT E S AT M I DY E A R 2014 | J U N E 2015
∑
NCAh
nCAh
JURISRCAhi
i=1
where
NCAh = number of active non-California jail jurisdictions in
stratum h, computed as
NCAh = Wh ×
∑ ni=1 JURISRA
CAh
CAhi
nCAh = number of sampled non-California jail jurisdictions in
stratum h.
Item nonresponse imputation
Critical items: Midyear inmate population, ADP, and rated
capacity
Based on the 2014 ASJ, about 99% of the 878 individual
reporting units provided valid data on their midyear inmate
population (872), ADP (864), and rated capacity (869). To
calculate a national midyear inmate population, ADP, and
rated capacity estimate, data were estimated for the reporting
units that did not report specific data.
Estimates were calculated based on the following criteria:
Data for 1 individual reporting unit included midyear
inmate population data based on the 2014 ASJ.
Data for 5 individual reporting units included midyear
inmate population data based on estimates from the
2013 ASJ.
Data for 9 individual reporting units included ADP data
based on their confined population at midyear 2014.
Data for 5 individual reporting units included ADP data
based on estimates from the 2013 ASJ.
Data for 9 individual reporting units included rated capacity
data based on estimates from the 2013 ASJ.
Inmate characteristics
Based on the 2014 ASJ, 90% to 95% of the 878 individual
reporting units provided valid data on sex, age, race/Hispanic
origin, and inmate conviction status. To calculate a national
rate for inmate characteristics, data were estimated based on
the ratio of the reported characteristic population to the total
midyear confined population.
11
Weekly admission and release estimation procedures
Based on the 2014 ASJ, 841 of the 878 individual reporting
units (96%) provided valid data on weekly admissions
or releases. To calculate an overall weekly estimate, data
on offender flows through local jails were estimated for
the 37 reporting units that did not report specific data on
admissions and releases. Release data were estimated for 5
reporting units that reported data on admissions, but not on
releases. Nonresponse weight adjustments account for the
survey nonrespondents.
Estimates were calculated based on the following criteria:
Data for 3 individual reporting units included admission
and release data based on estimates from the 2012 ASJ.
Data for 29 individual reporting units included admission
and release data based on estimates from the 2013 ASJ.
Release data for 5 individual reporting units were based on
admission data reported in 2014.
Calculating annual admissions
The ASJ collects data on weekly admissions. BJS determined
that the June admission data from the 2004 Survey of Large
Jails (SLJ) were a reliable source to calculate a nationwide
annual admission estimate. Although the number of
admissions to jails fluctuated throughout the year, the SLJ
tracked monthly movements from January 2003 to January
2004 and showed that the June 2003 count (339,500) closely
matched the annual average number of admissions (342,956).
The number of annual admissions was calculated by
multiplying the weekly admissions by 365 days and dividing by
7 days.
Calculating weekly turnover rates
Weekly jail turnover rates were modeled after the Bureau of
Labor Statistics’ Job Openings and Labor Turnover Survey.
Additional information on turnover rates is available at http://
www.bls.gov/jlt/. Jail turnover rates were calculated by adding
admissions and releases, and then dividing by the ADP. The
turnover rate takes into account jail admissions and releases
and gives an indication of the fluctuation of the jail population.
Jurisdiction size categories
For the 2011 through 2014 reports, BJS categorized jurisdiction
sizes based on the ADP during the 12 months ending midyear
2006 (the first year in the current ASJ series). For the 2010
report, comparisons of size categories from midyear 2009 to
midyear 2010 were based on the ADP during the 12 months
ending midyear 2009. In previous reports (2007 through 2009),
J A I L I N M AT E S AT M I DY E A R 2014 | J U N E 2015
the size category comparisons were based on the 12 months
ending midyear of the specific collection year. As a result,
not all data in previous reports are comparable with data in
this report.
Standard errors and tests of significance
As with any survey, the ASJ estimates are subject to error
arising from sampling rather than using a complete
enumeration of the jail population. A common way to express
this sampling variability is to construct a 95% confidence
interval around each survey estimate. Typically, multiplying
the standard error by 1.96 and then adding or subtracting the
result from the estimate produces the confidence interval. This
interval expresses the range of values that could result among
95% of the different samples that could be drawn.
Jail functions
Jails in the ASJ include confinement facilities—usually
administered by a local law enforcement agency—that are
intended for adults but may hold juveniles before or after
they are adjudicated. Facilities include jails and city or county
correctional centers; special jail facilities, such as medical or
treatment release centers, halfway houses, and work farms; and
temporary holding or lockup facilities that are part of the jail’s
combined function. Inmates sentenced to jail facilities usually
have a sentence of 1 year or less.
Within the ASJ, jails—
receive individuals pending arraignment and hold them
awaiting trial, conviction, or sentencing
re-admit probation, parole, and bail bond violators and
absconders
temporarily detain juveniles pending their transfer to
juvenile authorities
hold mentally ill persons pending their movement to
appropriate mental health facilities
hold individuals for the military, for protective custody, for
contempt, and for the courts as witnesses
release convicted inmates to the community upon
completion of sentence
transfer inmates to federal, state, or other authorities
house inmates for federal, state, or other authorities because
of crowding of their facilities
sometimes operate community-based programs as
alternatives to incarceration.
12
Terms and definitions
Admissions—Persons who are officially booked and housed
in jails by formal legal document and the authority of the
courts or some other official agency. Jail admissions include
persons sentenced to weekend programs and those who are
booked into the facility for the first time. Excluded from jail
admissions are inmates re-entering the facility after an escape,
work release, medical appointment or treatment facility
appointment, and bail and court appearances. BJS collects jail
admissions for the last 7 days in June.
Average daily population (ADP)—The average is derived by
the sum of inmates in jail each day for a year, divided by the
number of days in the year (i.e., between July 1, 2013, and June
30, 2014).
Average annual change—The mean average change across a
12-month time period.
Calculating annual admissions—BJS collects the number
of jail admissions during the last 7 days in June. Annual jail
admissions are calculated by multiplying weekly admissions by
the sum of 365 days divided by 7 days.
Calculating weekly jail turnover rate—This rate is calculated
by adding admissions and releases and dividing by the average
daily population. See Calculating weekly turnover rates for
additional information.
Inmates confined at midyear—The number of inmates held in
custody on the last weekday in June.
Jail incarceration rate—The number of inmates held in the
custody of local jails, per 100,000 U.S. residents.
J A I L I N M AT E S AT M I DY E A R 2014 | J U N E 2015
Percent of capacity occupied—This percentage is calculated
by taking the number of inmates (midyear or average daily
population), dividing by the rated capacity, and multiplying
by 100.
Rated capacity—The number of beds or inmates assigned
by a rating official to a facility, excluding separate temporary
holding areas.
Releases—Persons released after a period of confinement
(e.g., sentence completion, bail or bond releases, other pretrial
releases, transfers to other jurisdictions, and deaths). Releases
include those persons who have completed their weekend
program and who are leaving the facility for the last time.
Excluded from jail releases are temporary discharges including
work release, medical appointment or treatment center, court
appearance, furlough, day reporting, and transfers to other
facilities within the jail’s jurisdiction.
Under jail supervision but not confined—This classification
includes all persons in community-based programs operated
by a jail facility. These programs include electronic monitoring,
house arrest, community service, day reporting, and work
programs. The classification excludes persons on pretrial
release and who are not in a community-based program run
by the jail, as well as persons under supervision of probation,
parole, or other agencies; inmates on weekend programs; and
inmates who participate in work release programs and return
to the jail at night.
Weekend programs—Offenders in these programs are allowed
to serve their sentences of confinement only on weekends (i.e.,
Friday to Sunday).
13
Appendix Table 1
Standard errors for table 1: Inmates confined in local jails at
midyear, average daily population, and incarceration rates,
2000–2014
Year
2000
2001
2002
2003
2004
2005
2006
2007
2008
2009
2010
2011
2012
2013
2014
Inmates confined at midyear
2,504
2,721
3,213
3,572
3,919
~
3,552
3,720
4,016
4,231
5,430
6,009
7,684
8,042
8,382
Average daily population
2,265
2,648
2,980
3,448
3,748
~
3,230
3,549
3,883
4,109
5,359
5,879
7,769
7,943
8,430
~Not applicable. Data represent a complete enumeration based on the 2005 Census
of Jail Inmates.
Sources: Bureau of Justice Statistics, Annual Survey of Jails, midyear 2000–2004 and
midyear 2006–2014; and Census of Jail Inmates, midyear 2005.
Appendix Table 2
Reported data for table 2: Number of inmates in local jails, by characteristics, midyear 2000 and 2005–2014
Characteristic
Sex
Male
Female
Adult
Male
Female
Juvenile
Held as adult
Held as juvenile
Race/Hispanic origin
White
Black/African American
Hispanic/Latino
American Indian/Alaska Native
Asian/Native Hawaiian/
Other Pacific Islander
Two or more races
Conviction status
Convicted
Unconvicted
2000
2005
2006
2007
2008
2009
2010
2011
2012
2013
2014
547,624
70,659
610,703
540,614
70,089
7,580
6,126
1,454
652,958
94,571
740,770
646,807
93,963
6,759
5,750
1,009
666,819
99,000
759,717
661,164
98,552
6,102
4,835
1,268
679,654
100,520
773,341
673,346
99,995
6,833
5,649
1,184
685,862
99,670
777,829
678,657
99,172
7,703
6,410
1,294
673,728
93,706
760,216
667,039
93,176
7,218
5,846
1,373
650,341
91,521
734,372
643,331
91,042
7,490
5,596
1,895
633,171
91,923
719,253
627,777
91,476
5,840
4,490
1,350
636,708
97,190
728,547
631,802
96,745
5,351
4,489
862
602,193
98,015
695,817
598,228
97,589
4,391
3,366
1,025
617,842
106,081
719,857
614,102
105,754
4,067
3,581
485
236,969
233,078
85,612
4,974
315,598
276,959
106,707
7,270
323,474
284,412
114,564
8,052
327,864
292,457
121,660
8,347
320,111
295,747
123,376
8,638
289,606
266,638
109,998
8,328
274,907
234,738
97,869
8,223
298,663
250,577
103,274
8,527
304,762
245,376
100,682
8,292
297,745
225,751
93,133
8,793
314,846
235,436
98,714
9,285
4,304
…
5,130
975
4,940
633
5,181
754
5,267
1,237
4,785
1,563
4,225
689
4,776
1,070
4,826
1,320
4,386
1,419
5,388
906
245,698
316,728
270,712
440,873
280,914
460,837
289,098
470,960
272,291
462,052
250,920
412,914
234,566
368,411
250,464
385,631
248,800
383,152
234,134
381,588
240,944
406,565
Note: See appendix table 3 for standard errors.
…Not collected.
Sources: Bureau of Justice Statistics, Annual Survey of Jails, midyear 2000 and midyear 2006–2014; and Census of Jail Inmates, midyear 2005.
J A I L I N M AT E S AT M I DY E A R 2014 | J U N E 2015
14
Appendix Table 3
Standard errors for table 2: Number of inmates in local jails, by characteristics, midyear 2000 and 2005–2014
Characteristic
Sex
Male
Female
Adult
Male
Female
Juvenile
Held as adult
Held as juvenile
Race/Hispanic origin
White
Black/African American
Hispanic/Latino
American Indian/Alaska Native
Asian/Native Hawaiian/
Other Pacific Islander
Two or more races
Conviction status
Convicted
Unconvicted
2000
2005
2006
2007
2008
2009
2010
2011
2012
2013
2014
2,235
548
2,492
2,223
542
211
181
132
~
~
~
~
~
~
~
~
3,146
979
3,554
3,144
978
148
152
144
3,298
950
3,697
3,276
948
166
157
147
3,570
1,125
4,012
3,568
1,123
170
149
88
3,729
912
4,190
3,692
909
195
167
107
4,832
999
5,400
4,794
994
263
246
255
5,278
1,179
6,004
5,241
1,177
172
151
77
6,776
1,404
7,655
6,685
1,398
241
230
84
7,088
1,469
8,049
7,025
1,467
199
143
139
7,015
1,532
8,004
6,961
1,531
164
158
46
2,676
1,853
1,075
363
~
~
~
~
3,031
2,752
1,749
651
3,220
2,751
1,748
700
3,115
2,995
1,878
730
3,255
2,945
1,927
756
3,589
3,194
2,131
1,031
3,764
3,418
2,617
933
4,370
4,608
2,958
866
4,574
4,860
2,580
932
4,605
4,712
2,719
926
112
…
~
~
78
72
103
115
123
41
120
142
130
153
188
149
239
161
125
212
196
180
2,258
2,256
~
~
2,749
3,321
2,892
3,392
2,978
3,552
3,122
3,710
3,292
4,515
3,521
4,819
3,750
5,918
3,619
6,740
4,156
5,691
Note: Standard errors are based on the reported data in appendix table 2 and were not estimated for survey item nonresponse.
…Not collected.
~Not applicable. Data represent a complete enumeration based on the 2005 Census of Jail Inmates.
Sources: Bureau of Justice Statistics, Annual Survey of Jails, midyear 2000 and midyear 2006–2014; and Census of Jail Inmates, midyear 2005.
Appendix Table 4
Standard error ratios for table 3: Percent of inmates in local jails, by characteristics, midyear 2000 and 2005–2014
Characteristic
Sex
Male
Female
Adult
Male
Female
Juvenile
Held as adult
Held as juvenile
Race/Hispanic origin
White
Black/African American
Hispanic/Latino
American Indian/Alaska Native
Asian/Native Hawaiian/
Other Pacific Islander
Two or more races
Conviction status
Convicted
Unconvicted
2000
2005
2006
2007
2008
2009
2010
2011
2012
2013
2014
0.1%
0.1
-0.1%
0.1
----
~
~
~
~
~
~
~
~
0.1%
0.1
-0.1%
0.1
----
0.1%
0.1
-0.1%
0.1
----
0.1%
0.1
-0.1%
0.1
----
0.1%
0.1
-0.1%
0.1
----
0.1%
0.1
-0.1%
0.1
----
0.1%
0.1
-0.1%
0.1
----
0.1%
0.1
-0.1%
0.1
----
0.1%
0.1
-0.1%
0.1
----
0.2%
0.2
-0.1%
0.2
----
0.3%
0.3
0.2
0.1
~
~
~
~
0.3%
0.3
0.2
0.1
0.3%
0.3
0.2
0.1
0.3%
0.3
0.2
0.1
0.3%
0.3
0.3
0.1
0.4%
0.4
0.3
0.2
0.4%
0.4
0.3
0.1
0.5%
0.5
0.4
0.1
0.5%
0.5
0.3
0.1
0.5%
0.5
0.3
0.1
-…
~
~
---
---
---
---
---
---
---
---
---
0.3%
0.3
~
~
0.3%
0.3
0.3%
0.3
0.3%
0.3
0.4%
0.4
0.4%
0.4
0.4%
0.4
0.5%
0.5
0.5%
0.5
0.5%
0.5
Note: Detail may not sum to total because of rounding.
--Less than 0.05%.
…Not collected.
~Not applicable. Data represent a complete enumeration based on the 2005 Census of Jail Inmates.
Sources: Bureau of Justice Statistics, Annual Survey of Jails, midyear 2000 and midyear 2006–2014; and Census of Jail Inmates, midyear 2005.
J A I L I N M AT E S AT M I DY E A R 2014 | J U N E 2015
15
Appendix Table 5
Standard errors for table 4: Inmates confined in local jails at
midyear, by size of jurisdiction, 2013–2014
Number
Jurisdiction size
49 or fewer
50–99
100–249
250–499
500–999
1,000 or more
2013
2,589
3,185
4,313
5,092
4,109
6,901
Percent
2014
2,719
3,218
4,398
4,988
4,166
7,248
2013
0.3%
0.4
0.6
0.7
0.6
0.7
2014
0.4%
0.4
0.6
0.6
0.6
0.7
Source: Bureau of Justice Statistics, Annual Survey of Jails, midyear 2013–2014.
Appendix Table 7
Standard errors for table 6: Percent of jail capacity occupied at
midyear, by size of jurisdiction, 2013–2014
Jurisdiction size
Total
49 or fewer
50–99
100–249
250–499
500–999
1,000 or more
2013
0.5%
3.1
3.0
2.2
1.4
0.6
0.4
2014
0.4%
3.4
2.4
1.8
1.5
0.6
0.4
Source: Bureau of Justice Statistics, Annual Survey of Jails, midyear 2013–2014.
Appendix Table 6
Standard errors for table 5: Rated capacity of local jails and
percent of capacity occupied, 2000 and 2005–2014
Year
2000
2005
2006
2007
2008
2009
2010
2011
2012
2013
2014
Rated capacity
3,425
~
4,741
5,056
5,063
6,460
11,013
11,776
10,217
13,198
11,082
Percent of capacity occupied
Midyear
Average daily population
0.4%
0.4%
~
~
0.4
0.4
0.4
0.4
0.4
0.4
0.5
0.5
0.9
0.9
0.9
0.9
0.5
0.5
0.5
0.5
0.4
0.4
~Not applicable. Data represent a complete enumeration based on the 2005 Census
of Jail Inmates.
Sources: Bureau of Justice Statistics, Annual Survey of Jails, midyear 2000 and
midyear 2006–2014, and Census of Jail Inmates, midyear 2005.
Appendix Table 8
Standard errors for table 7: Average daily jail population, admissions, and turnover rate, by size of jurisdiction, week ending June
30, 2013 and 2014
Estimated number of admissions during the—
Jurisdiction size
Total
49 or fewer
50–99
100–249
250–499
500–999
1,000 or more
Average daily population
2013
2014
7,943
8,430
2,422
2,471
3,119
3,110
4,165
4,397
4,956
4,835
4,128
4,093
6,974
7,455
Last week in June
2013
2014
13,198
3,937
1,785
1,526
2,173
2,109
2,446
2,210
2,391
2,327
13,009
1,312
1,584
1,825
Weekly turnover rate
2013
2014
11.1%
0.9%
12.8
12.8
9.1
7.7
3.7
3.5
3.7
3.6
20.5
1.1
0.5
0.5
Source: Bureau of Justice Statistics, Annual Survey of Jails, midyear 2013–2014.
J A I L I N M AT E S AT M I DY E A R 2014 | J U N E 2015
16
Appendix Table 9
Standard errors for table 8: Inmate population in jail
jurisdictions reporting on confined persons being held for
U.S. Immigration and Customs Enforcement (ICE), midyear
2002–2014
Year
2002
2003
2004
2005
2006
2007
2008
2009
2010
2011
2012
2013
2014
Confined persons held for ICE at midyear
804
935
976
~
959
740
729
851
977
1,533
1,670
2,136
2,157
Note: The standard errors are based on the reported data and were not estimated
for survey item nonresponse.
~Not applicable. Data represent a complete enumeration based on the 2005 Census
of Jail Inmates.
Sources: Bureau of Justice Statistics, Annual Survey of Jails, midyear 2002–2004 and
midyear 2006–2014; and Census of Jail Inmates, midyear 2005.
Appendix Table 10
Standard errors for table 9: Persons under jail supervision, by confinement status and type of program, midyear 2000 and
2006–2014
Confinement status and type of program
Total
Held in jail
Supervised outside of a jail facility
Weekend programs
Electronic monitoring
Home detention
Day reporting
Community service
Other pretrial supervision
Other work programs
Treatment programs
Other
2000
2,728
2,504
996
457
320
17
70
286
350
440
66
47
2006
3,783
3,552
1,151
381
352
184
336
547
131
382
59
147
2007
4,041
3,720
1267
347
519
512
475
587
183
257
104
99
2008
4,732
4,016
2,327
477
469
41
340
796
392
572
122
619
2009
4,548
4,231
1,535
350
328
41
300
1,152
300
446
67
71
2010
5,897
5,430
1,960
296
574
74
360
1,319
411
428
153
114
2011
6,446
6,009
1,832
514
581
89
301
845
708
497
153
151
2012
8,438
7,684
2,418
369
747
386
396
1,089
909
334
261
196
2013
8,692
8,042
2,351
508
624
232
348
1,133
698
390
230
512
2014
9,248
8,382
2,707
399
788
188
429
1,262
845
491
270
179
Source: Bureau of Justice Statistics, Annual Survey of Jails, midyear 2000 and midyear 2006–2014.
J A I L I N M AT E S AT M I DY E A R 2014 | J U N E 2015
17
The Bureau of Justice Statistics of the U.S. Department of Justice is the principal
federal agency responsible for measuring crime, criminal victimization, criminal
offenders, victims of crime, correlates of crime, and the operation of criminal
and civil justice systems at the federal, state, tribal, and local levels. BJS collects,
analyzes, and disseminates reliable and valid statistics on crime and justice
systems in the United States, supports improvements to state and local criminal
justice information systems, and participates with national and international
organizations to develop and recommend national standards for justice statistics.
William J. Sabol is director.
This report was written by Todd D. Minton and Zhen Zeng, Ph.D. Tracy L. Snell
provided statistical review and verified the report.
Leslie Miller carried out the data collection and processing under the supervision
of Nicole Adolph and Crecilla Scott, Economic Reimbursable Surveys Division,
Census Bureau, U.S. Department of Commerce. Suzanne Dorinski and Rekha
Kudlur provided statistical and technical assistance.
Irene Cooperman and Jill Thomas edited the report. Barbara Quinn produced
the report.
June 2015, NCJ 248629
Celebrating
35 years
Office of Justice Programs
Innovation • Partnerships • Safer Neighborhoods
www.ojp.usdoj.gov


