

Pew Center Public Opinion on Sentencing and Corrections Policy in Us 2012
Download original document:
Document text
Document text
This text is machine-read, and may contain errors. Check the original document to verify accuracy.
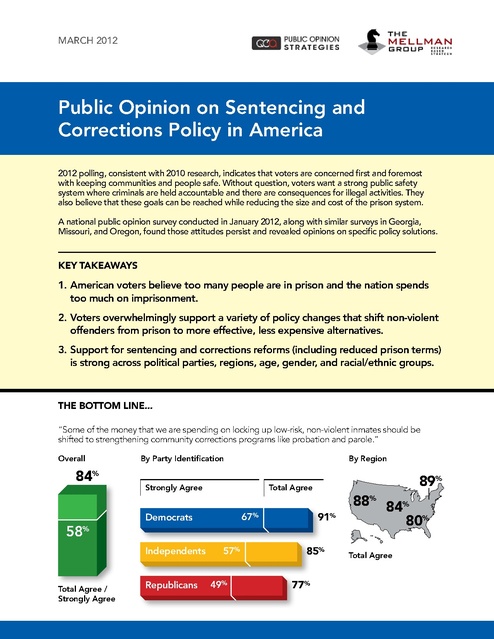
MARCH 2012

Public Opinion on Sentencing and
Corrections Policy in America
2012 polling, consistent with 2010 research, indicates that voters are concerned first and foremost
with keeping communities and people safe. Without question, voters want a strong public safety
system where criminals are held accountable and there are consequences for illegal activities. They
also believe that these goals can be reached while reducing the size and cost of the prison system.
A national public opinion survey conducted in January 2012, along with similar surveys in Georgia,
Missouri, and Oregon, found those attitudes persist and revealed opinions on specific policy solutions.

Key takeaways

1.	American voters believe too many people are in prison and the nation spends
too much on imprisonment.
2.	Voters overwhelmingly support a variety of policy changes that shift non-violent
offenders from prison to more effective, less expensive alternatives.
3.	Support for sentencing and corrections reforms (including reduced prison terms)
is strong across political parties, regions, age, gender, and racial/ethnic groups.

THE BOTTOM LINE...
“Some of the money that we are spending on locking up low-risk, non-violent inmates should be
shifted to strengthening community corrections programs like probation and parole.”
Overall

84%

58%

By Party Identification
Strongly Agree

Republicans

89%

Total Agree

91%

67%

Democrats
Independents

Total Agree /
Strongly Agree

By Region

57%
49%

85%
77%

88% 84%
80%
Total Agree

UNDERLYING ATTITUDES
Research from 2010 showed that crime is a low concern among voters. It also showed that voters want
offenders held accountable for their actions, and that they make a big distinction between violent and
nonviolent offenders. The current survey found that voters also feel safe in their communities, rating
their sense of safety at an average of 8 on a 10-point scale.
A plurality believes there are too many
people in prison.
“Do you think there are too many people
in prison in the United States, not enough
people in prison, or is the number of people
in prison about right?”

14%

On average, voters think about a fifth of
prisoners could be released without posing
a threat to public safety.

20%

45%

Don’t Know

13%

of prisoners
could be
safely
released.

Too Many
Prisoners

Too Few
Prisoners

28%

About Right

A strong majority, even among victims, believes prison is not always the best response to
non-violent crime.
“Which comes closer to your point of view?”
Statement A
“One out of every 100 American adults is
in prison. That’s too many, and it costs too
much. There are more effective, less expensive
alternatives to prison for non-violent offenders
and expanding those alternatives is the best way
to reduce the crime rate.”

69%

50%

Statement B
“People who commit crimes belong behind bars,
end of story. It may cost a lot of money to run
prisons, but it would cost society more in the long
run if more criminals were on the street.”

15%

25%

Strongly Support / Total Support

Strongly Support / Total Support

% Total Favor

% Total Favor

24%
70%
Violent Crime
Victim Households

2

22%

73%
Non-Violent Crime
Victim Households

Violent Crime
Victim Households

Non-Violent Crime
Victim Households

Voters are more willing to raise taxes on the wealthy or reduce funding for state prisons than they are
to consider other types of funding reductions.
Total Acceptable
Reducing funding for K-12 education

15%

Reducing funding for health care services

20%

Raising property taxes

23%

Reducing funding for higher education

26%

Raising business taxes

43%

Reducing funding for transportation projects

43%

Reducing funding for state prisons

48%

Raising income taxes for wealthy individuals

71%

policy solutions
State policy makers seeking to reduce prison costs while maintaining public safety often look to
reduced sentences for non-violent offenders as a policy remedy. The poll tested public support for
a variety of such reforms. In the abstract, a plurality of voters believes that current sentences are
“about right.” But there is widespread support for shorter sentences and alternatives to incarceration
for non-violent crimes, especially when prison savings are reinvested in less costly supervision options.
1. Divert More Non-Violent Offenders From Prison
Send fewer low-risk, non-violent offenders to prison:
Total Favor

Strongly Favor
To keep violent criminals in prison for their full sentence.

62%

And re-invest in alternatives.
In order to help close the budget deficit.

84%

59%
39%

82%
68%

Raise the Felony Theft Threshold
“Many states have a law that stealing property valued over $500 is a felony crime, and thus the offenders
face at least one year in prison. Some states have raised this felony threshold from $500 to $1,000 [or]
$1,500. Do you favor or oppose a proposal to raise the threshold to $1,000 [or] $1,500 in your state?”
Strongly Favor
Raise to $1,000 threshold
Raise to $1,500 threshold

3

Total Favor

49%
47%

67%
66%

Voters continue to support an increase in the threshold even in the face of a strong argument against it.
Supporters...
...say these laws were passed
decades ago. Now electronics
cost more than $500. If
someone steals one, they
shouldn’t be locked up at a
cost to taxpayers of thousands
per year. The threshold should
be raised to at least $1,000 [or]
$1,500.
Opponents...
...say that it is the wrong time
to go soft on crime in this bad
economy. People who steal
make our communities less safe,
and they should be locked up.
PARTY AFFILIATION
Total
Support
$1,000

$1,500

Democrats

Independents

Republicans

Total Favor

Strongly Favor
$1,000

68%

49%

$1,500

68%

51%

Strongly Total
Oppose Oppose
$1,000
$1,500

19%

25%

18%

26%

GEOGRAPHIC REGION

HOUSEHOLD TYPE

East

Violent
Crime
Victim

South

Midwest

West

Non-Violent
Crime
Victim

Law
Enforcement
Member

72% 71% 60% 70% 64% 69% 71% 68% 69% 51%
71% 72% 60% 69% 66% 65% 72% 68% 66% 60%

2. REDUCE PRISON TIME FOR NON-VIOLENT OFFENDERS
All the approaches examined to reduce prison time served are broadly acceptable to voters.
Voters strongly support reducing prison time for low-risk, non-violent offenders for a variety of reasons:
Total Accept

Strongly Accept
For completion of programs

63%

86%

To keep violent offenders locked up

62%

85%

To re-invest in alternatives

61%

85%

For good behavior
To close budget deficits
For age or illness

4

55%
45%
50%

83%
78%
77%

A large majority of voters favor shortening prison terms for non-violent offenders by a full year.
“Allow non-violent crime inmates to be released up to 6 [or] 12 months early if they have behaved well
and are considered a low risk for committing another crime.”
Strongly Accept

Total Accept

Up to 6 months

86%

64%

Up to 12 months

87%

58%

The percentage of a sentence served seems more important than its length.
“Which of the following do you prefer as punishment for someone convicted of a non-violent crime?”
Total Favor

Strongly Favor
Being sentenced to 5 years in prison and being
released on parole after serving 4 years.

68%

48%

Being sentenced to 10 years and being released
on parole after serving 5 years.

11%

19%

Nearly all voters prioritize preventing recidivism over time served, even when prison time varies
up to a year.
“It does not matter whether a non-violent offender is in prison for 18 or 24 or 30 months [or] 21 or 24 or
27 months. What really matters is that the system does a better job of making sure that when an offender
does get out, he is less likely to commit another crime.”
Strongly Agree

Total Agree

18 or 24 or 30 months
21 or 24 or 27 months

18/24/30
months
21/24/27
months

5

Democrats

Independents

90%

73%

PARTY AFFILIATION
Total
Agree

87%

66%

Republicans

GEOGRAPHIC REGION

HOUSEHOLD TYPE

East

Violent
Crime
Victim

South

Midwest

West

Non-Violent
Crime
Victim

Law
Enforcement
Member

90% 85% 85% 86% 86% 86% 89% 83% 89% 87%
94% 93% 84% 91% 89% 94% 88% 86% 91% 91%

3. Mandate Supervision For All Offenders Released From Prison
Voters strongly prefer that inmates be subject to a period of mandatory supervision, rather than be
held until their sentences expire and released without any supervision, regardless of offense type.
Violent Offenders
When given a choice between violent offenders serving a full 5-year prison sentence or 4 years of a
5-year sentence plus 1 year of mandatory supervision, voters prefer the mandatory supervision option.
Total Prefer

Strongly Prefer
Shorter sentence, plus supervision

49%

Full sentence, no supervision

21%

PARTY AFFILIATION
Total
Prefer
With
Supervision
No
Supervision

Democrats

Independents

Republicans

67%

26%

GEOGRAPHIC REGION

HOUSEHOLD TYPE

East

Violent
Crime
Victim

South

Midwest

West

Non-Violent
Crime
Victim

Law
Enforcement
Member

72% 66% 62% 65% 59% 72% 76% 68% 69% 62%
24% 25% 30% 27% 33% 21% 20% 24% 23% 34%

Non-Violent Offenders
When given a choice between non-violent offenders serving a full 3-year prison sentence or 2 years of a
3-year sentence plus 1 year of mandatory supervision, voters prefer the mandatory supervision option.
Total Prefer

Strongly Prefer
Shorter sentence, plus supervision
Full sentence, no supervision

18%

PARTY AFFILIATION
Total
Prefer
With
Supervision
No
Supervision

6

Democrats

Independents

Republicans

69%

51%
25%

GEOGRAPHIC REGION

HOUSEHOLD TYPE

East

Violent
Crime
Victim

South

Midwest

West

Non-Violent
Crime
Victim

Law
Enforcement
Member

72% 67% 67% 70% 65% 70% 73% 74% 74% 67%
23% 25% 26% 23% 27% 24% 23% 21% 21% 28%

4. IMPROVE PROBATION AND PAROLE SUPERVISION
Strongly
Agree

Total
Agree

Democrats

Independents Republicans

“An effective probation and parole
system would use new technologies to
monitor where offenders are and what
they are doing, require them to pass
drug tests, and require they either keep
a job or perform community service.”

74%

92%

95%

91%

89%

“There are five million offenders who
are out of prison and under community
supervision. If we are serious about
public safety, we need a better system
to supervise and track these people.”

70%

89%

90%

88%

88%

“We have too many low-risk, nonviolent offenders in prison. We need
alternatives to incarceration that cost
less and save our expensive prison
space for violent and career criminals.”

69%

88%

94%

89%

81%

“Prisons are a government program, and
just like any other government program
they need to be put to the cost-benefit
test to make sure taxpayers are getting
the best bang for their buck.”

66%

87%

88%

87%

87%

“Ninety-five percent of people in prison
will be released. If we are serious about
public safety, we must increase access
to treatment and job training programs
so they can become productive citizens
once they are back in the community.”

66%

87%

90%

89%

82%

“Our spending on corrections has
grown from $10 billion to $50 billion
over the last twenty years but we are
not getting a clear and convincing
return on that investment in terms of
public safety.”

57%

77%

81%

74%

76%

“Parole and probation are just a slap on
the wrist and not a substitute for prison.”

29%

50%

43%

49%

59%

7

Methodology
On behalf of the Pew Center on the States,
Public Opinion Strategies and the Mellman
Group conducted phone interviews with
1,200 likely voters nationwide on January
10-15, 2012. The survey has a margin of
error of ±2.8%. The margin of error is higher
for subgroups.
The full survey is available at
www.pewcenteronthestates.org/publicsafety.

Poll Respondent Demographics
•	 39 percent identified as conservative
•	 30 percent identified as liberal
•	 32 percent identified as a Republican or
leaning Republican
•	 24 percent identified as Independent
•	 37 percent identified as Democrat or
leaning Democratic
•	 17 percent identified as a violent crime
victim household
•	 43 percent identified as a non-violent
crime victim household
•	 12 percent identified as a law
enforcement household

Public Opinion Strategies is a leading
national political, public policy, and public
affairs research firm. Public Opinion Strategies
is widely recognized as the nation’s leading
Republican polling firm, listing 19 U.S.
Senators, 6 Governors, and over 70 Members
of Congress as clients. Public Opinion
Strategies also works for some of America’s
largest corporations and associations in the
public affairs realm.

The Mellman Group has provided sophisticated
opinion research and strategic advice to political
leaders, public interest organizations, Fortune
500 companies, and government agencies for
over thirty years. Current clients include the
majority leader of the U.S. Senate and the
Democratic whip in the U.S. House.

8


