

The Sentencing Project - Fact Sheet Private Prisons in the United States, 2017
Download original document:
Document text
Document text
This text is machine-read, and may contain errors. Check the original document to verify accuracy.
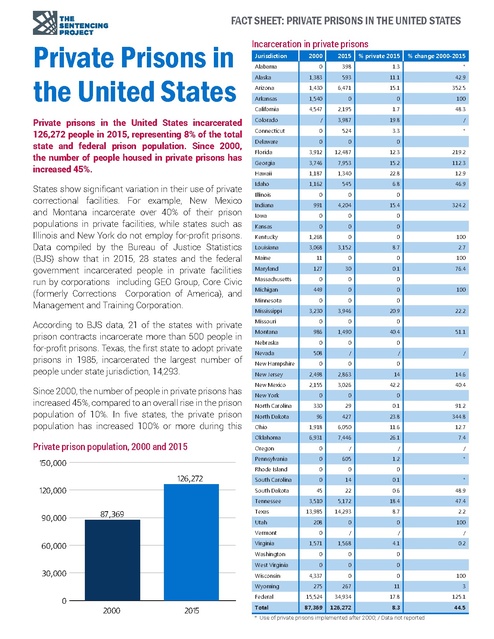
FACT SHEET: PRIVATE PRISONS IN THE UNITED STATES

Private Prisons in
the United States
Private prisons in the United States incarcerated
126,272 people in 2015, representing 8% of the total
state and federal prison population. Since 2000,
the number of people housed in private prisons has
increased 45%.
States show significant variation in their use of private
correctional facilities. For example, New Mexico
and Montana incarcerate over 40% of their prison
populations in private facilities, while states such as
Illinois and New York do not employ for-profit prisons.
Data compiled by the Bureau of Justice Statistics
(BJS) show that in 2015, 28 states and the federal
government incarcerated people in private facilities
run by corporations including GEO Group, Core Civic
(formerly Corrections Corporation of America), and
Management and Training Corporation.
According to BJS data, 21 of the states with private
prison contracts incarcerate more than 500 people in
for-profit prisons. Texas, the first state to adopt private
prisons in 1985, incarcerated the largest number of
people under state jurisdiction, 14,293.
Since 2000, the number of people in private prisons has
increased 45%, compared to an overall rise in the prison
population of 10%. In five states, the private prison
population has increased 100% or more during this

Private prison population, 2000 and 2015
150,000
126,272
120,000

Incarceration in private prisons
Jurisdiction

2000

2015

% private 2015

0

398

1.3

*

Alaska

1,383

593

11.1

-42.9

Arizona

1,430

6,471

15.1

352.5

Arkansas

1,540

0

0

-100

California

4,547

2,195

1.7

-48.3

Colorado

/

3,987

19.8

/

Connecticut

0

524

3.3

*

Delaware

0

0

0

Florida

3,912

12,487

12.3

219.2

Georgia

3,746

7,953

15.2

112.3

Hawaii

1,187

1,340

22.8

12.9

Idaho

1,162

545

6.8

-46.9

Illinois

0

0

0

Alabama

Indiana

991

4,204

15.4

Iowa

0

0

0

Kansas

0

0

0

1,268

0

0

Louisiana

3,068

3,152

8.7

2.7

11

0

0

-100

127

30

0.1

-76.4

Maine
Maryland
Massachusetts

0

0

0

449

0

0

Minnesota

0

0

0

Mississippi

3,230

3,946

20.9

Michigan

Missouri

0

0

0

Montana

986

1,490

40.4

Nebraska

0

0

0

Nevada

2000

2015

51.1

/

/
0

New Jersey

2,498

2,863

14

14.6

New Mexico

2,155

3,026

42.2

40.4

New York

/

0

0

0

North Carolina

330

29

0.1

-91.2

North Dakota

96

427

23.8

344.8

Ohio

1,918

6,050

11.6

12.7

Oklahoma

7.4

6,931

7,446

26.1

Oregon

0

/

/

/

Pennsylvania

0

605

1.2

*

Rhode Island

0

0

0

South Carolina

0

14

0.1

*

South Dakota

45

22

0.6

-48.9

3,510

5,172

18.4

47.4

13,985

14,293

8.7

2.2

208

0

0

-100

0

/

/

/

1,571

1,568

4.1

-0.2

Washington

0

0

0

West Virginia

0

0

0

Virginia

0

22.2

0

Vermont

30,000

-100

0

Utah

60,000

-100

508

New Hampshire

Texas

87,369

324.2

Kentucky

Tennessee

90,000

% change 2000-2015

Wisconsin

4,337

0

0

Wyoming

275

267

11

-3

Federal

15,524

34,934

17.8

125.1

Total

87,369

126,272

8.3

44.5

* Use of private prisons implemented after 2000; / Data not reported

-100

FACT SHEET: PRIVATE PRISONS IN THE UNITED STATES
Proportion of incarcerated population in private prisons, 2015

No private prisons
0.1 - 10%
10 - 20%
20 - 30%
>30%

* Data not reported for Nevada, Oregon and Vermont

period. The federal prison system experienced a 125%
increase in use of private prisons since 2000 reaching
34,934 people in private facilities in 2015.
Despite the significant growth in private prisons since
2000, the number of people housed in these facilities has
declined 8% since reaching a national peak population
of 137,220 in 2012. Since 2000 six states — Arkansas,
Kentucky, Maine, Michigan, Utah and Wisconsin — have
eliminated their use of private prisons due to concerns
about safety and cost-cutting. An additional six states
saw reductions of 40% or more in the use of private
prisons during this period.
At the federal level, a 2016 Obama Administration
policy shift to reduce reliance and ultimately phase

out private prison contracts was reversed by Attorney
General Jeff Sessions in February 2017. The reversal
took place despite significant declines in the federal
prison population and a scathing report by the Justice
Department’s Office of the Inspector General that
found federally contracted prisons had more safety
and security incidents than public prisons. Currently,
the federal Bureau of Prisons maintains the nation’s
highest number of people managed under private
prison custody. Changes in policy at the Department
of Justice in 2017 that are likely to increase sentence
length and expand prosecutions for drug and
immigration offenses may contribute to the expansion
of private facility contracting.

Source: Prisoners Series (2015, 2000), Bureau of Justice Statistics, Department of Justice, Washington, D.C. Private prisons are defined as “private
facilities run by private prison corporations whose services and beds are contracted out by state governments or the Federal Bureau of Prisons.”

This fact sheet was published in August 2017.

1705 DeSales Street NW, 8th Floor
Washington, D.C. 20036
sentencingproject.org

The Sentencing Project works for a fair and effective U.S. justice
system by promoting reforms in sentencing policy, addressing
unjust racial disparities and practices, and advocating for
alternatives to incarceration.


