

U.S. Department of Justice Bulletin, Bureau of Justice Statistics, "Jail Inmates in 2017," 2019
Download original document:
Document text
Document text
This text is machine-read, and may contain errors. Check the original document to verify accuracy.
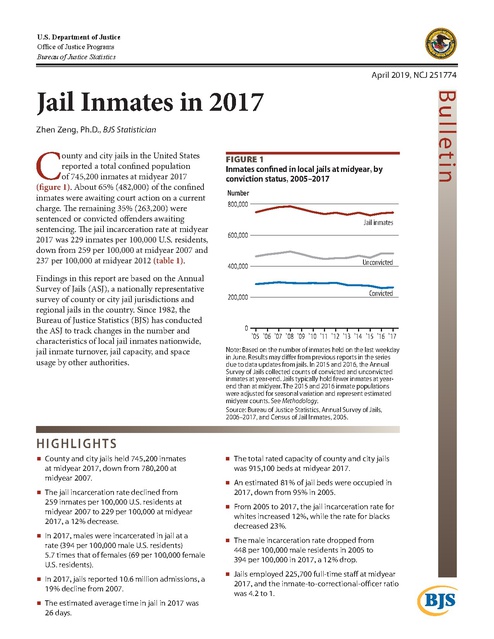
U.S. Department of Justice Office of Justice Programs Bureau of Justice Statistics April 2019, NCJ 251774 Zhen Zeng, Ph.D., BJS Statistician C ounty and city jails in the United States reported a total confned population of 745,200 inmates at midyear 2017 (fgure 1). About 65% (482,000) of the confned inmates were awaiting court action on a current charge. Te remaining 35% (263,200) were sentenced or convicted ofenders awaiting sentencing. Te jail incarceration rate at midyear 2017 was 229 inmates per 100,000 U.S. residents, down from 259 per 100,000 at midyear 2007 and 237 per 100,000 at midyear 2012 (table 1). Findings in this report are based on the Annual Survey of Jails (ASJ), a nationally representative survey of county or city jail jurisdictions and regional jails in the country. Since 1982, the Bureau of Justice Statistics (BJS) has conducted the ASJ to track changes in the number and characteristics of local jail inmates nationwide, jail inmate turnover, jail capacity, and space usage by other authorities. FIGURE 1 Inmates confned in local jails at midyear, by conviction status, 2005–2017 Number 800,000 Jail inmates 600,000 400,000 Unconvicted 200,000 Convicted 0 ’05 ’06 ’07 ’08 ’09 ’10 ’11 ’12 ’13 ’14 ’15 ’16 ’17 Note: Based on the number of inmates held on the last weekday in June. Results may difer from previous reports in the series due to data updates from jails. In 2015 and 2016, the Annual Survey of Jails collected counts of convicted and unconvicted inmates at year-end. Jails typically hold fewer inmates at yearend than at midyear. The 2015 and 2016 inmate populations were adjusted for seasonal variation and represent estimated midyear counts. See Methodology. Source: Bureau of Justice Statistics, Annual Survey of Jails, 2006–2017, and Census of Jail Inmates, 2005. HIGHLIGHTS County and city jails held 745,200 inmates at midyear 2017, down from 780,200 at midyear 2007. The jail incarceration rate declined from 259 inmates per 100,000 U.S. residents at midyear 2007 to 229 per 100,000 at midyear 2017, a 12% decrease. In 2017, males were incarcerated in jail at a rate (394 per 100,000 male U.S. residents) 5.7 times that of females (69 per 100,000 female U.S. residents). In 2017, jails reported 10.6 million admissions, a 19% decline from 2007. The estimated average time in jail in 2017 was 26 days. The total rated capacity of county and city jails was 915,100 beds at midyear 2017. An estimated 81% of jail beds were occupied in 2017, down from 95% in 2005. From 2005 to 2017, the jail incarceration rate for whites increased 12%, while the rate for blacks decreased 23%. The male incarceration rate dropped from 448 per 100,000 male residents in 2005 to 394 per 100,000 in 2017, a 12% drop. Jails employed 225,700 full-time staf at midyear 2017, and the inmate-to-correctional-ofcer ratio was 4.2 to 1. Bul l etin Jail Inmates in 2017 TABLE 1 Inmates confned at midyear, average daily population, annual admissions, and incarceration rates, 2005–2017 Year 2005 2006 2007 2008 2009 2010 2011 2012 2013 2014 2015 2016 2017* Percent change 2007–2017 2016–2017 Confned inmatesa 747,500 765,800 † 780,200 † 785,500 † 767,400 † 748,700 735,600 744,500 731,200 744,600 727,400 740,700 745,200 -4.5% 0.6 ADPb 733,400 755,300 773,100 † 776,600 † 768,100 † 748,600 735,600 737,400 731,400 739,000 719,500 † 731,300 745,600 -3.6% 1.9 Annual admissionsc 12,100,000 † 12,200,000 † 13,100,000 † 13,600,000 † 12,800,000 † 12,900,000 † 11,800,000 † 11,600,000 † 11,700,000 11,400,000 † 10,700,000 10,600,000 10,600,000 -19.1% 0.0 Jail incarceration rated 253 † 256 † 259 † 258 † 250 † 242 † 236 † 237 † 231 234 227 229 229 -11.6% -0.1 Note: Data are rounded to the nearest 100 for confned inmates and for average daily population (ADP) and to the nearest 100,000 for admissions. Results may difer from previous reports in the series due to data updates from jails. See appendix table 1 for standard errors. *Comparison year. †Diference with comparison year is signifcant at the 95% confdence level. aNumber of inmates held on the last weekday in June. bThe ADP is the sum of all inmates in jail each day for one year, divided by the number of days in the year. The ADP for 2015 and 2016 was calculated for the calendar year ending on December 31. The ADP for all other years was calculated for the 12-month period ending on June 30. cAnnual admissions in 2005 and 2007–2014 were estimated based on admissions during a one-week period in June. The 2006, 2015, and 2016 annual admissions were for the calendar year ending on December 31. The 2017 annual admissions were for the 12-month period ending on June 30, 2017. dNumber of confned inmates in local jails per 100,000 U.S. residents at midyear. Source: Bureau of Justice Statistics, Annual Survey of Jails, 2006–2017; Census of Jail Inmates, 2005; Mortality in Correctional Institutions (formerly Deaths in Custody Reporting Program), 2006 (admissions only); and U.S. Census Bureau, Population Estimates by Age, Sex, Race, and Hispanic Origin for the United States: January 1, 2005, to January 1, 2018. J A I L I N M AT E S I N 201 7 | A P R I L 2019 2 Terms and defnitions Admissions—All persons booked into and housed in jail facilities by formal legal document and the authority of the courts or some other ofcial agency, including repeat ofenders booked on new charges and persons sentenced to weekend programs and entering the facility for the frst time. They exclude inmates reentering the facility after an escape, work release, medical appointment or treatment facility appointment, and bail and court appearances. Jail incarceration rate—The number of inmates held in the custody of local jails, per 100,000 total U.S. residents. Average daily population (ADP)—The sum of inmates in jail each day for a year, divided by the number of days in the year. Midyear population—The number of inmates held in custody on the last weekday in June. Estimated average time in jail—The ADP divided by the number of annual admissions, then multiplied by the number of days in a year. Jail—Confnement facilities operated under the authority of a sherif, police chief, or city or county administrator. Facilities include jails, detention centers, city or county correctional centers, special jail facilities (such as medical or treatment centers and pre-release centers), and temporary holding or lockup facilities that are part of the jail’s combined function. Jails are intended for adults but may hold juveniles before or after their cases are adjudicated. Inmates sentenced to jail facilities usually have a sentence of one year or less. Jails— receive individuals pending arraignment and hold them awaiting trial, conviction, or sentencing re-admit probation, parole, and bail bond violators and absconders temporarily detain juveniles pending their transfer to juvenile authorities hold mentally ill persons pending their movement to appropriate mental health facilities hold individuals for the military, protective custody, contempt, and the courts as witnesses release convicted inmates to the community on completion of sentence transfer inmates to federal, state, or other authorities house inmates for federal, state, or other authorities due to crowding of their facilities operate community-based programs as alternatives to incarceration. J A I L I N M AT E S I N 201 7 | A P R I L 2019 Jail jurisdiction—County (parish in Louisiana) or municipal government that administers one or more local jails and represents the entity responsible for managing jail facilities under its authority. Most jail jurisdictions consist of a single facility, but some have multiple facilities or multiple facility operators. Percent of capacity occupied at midyear—The jail population at midyear, divided by the rated capacity. Rated capacity—The number of beds or inmates assigned by a rating ofcial to a facility, excluding separate temporary holding areas. Releases—Persons released after a period of confnement (e.g., sentence completion, bail or bond releases, other pre-trial releases, transfers to other jurisdictions, and deaths). Releases include persons who have completed their weekend program and who are leaving the facility for the last time. They exclude temporary discharges, such as work release, medical appointment or treatment center, court appearance, furlough, day reporting, and transfers to other facilities within the jail jurisdiction. Under jail supervision but not confned—All persons in community-based programs operated by a jail facility, which include electronic monitoring, house arrest, community service, day reporting, and work programs. They exclude persons on pre-trial release who are not in a community-based program run by the jail and persons under supervision of probation, parole, or other agencies; inmates on weekend programs; and inmates who participate in work release programs and return to the jail at night. Weekly inmate turnover rate—The sum of weekly admissions and releases, divided by the ADP. Year-end population—The number of inmates held in custody on December 31. The year-end population is typically smaller than the midyear population. 3 Male incarceration rate dropped 12% from 2005 to 2017 In 2017, males were incarcerated in jail at a rate (394 per 100,000 male U.S. residents) nearly six times that of females (69 per 100,000 female U.S. residents) (table 2). From 2005 to 2017, the male incarceration rate decreased by 12%, from 448 to 394 per 100,000 male residents, while the female incarceration rate grew by 10%, from 63 to 69 per 100,000 female residents. In 2017, whites were incarcerated in jail at a rate of 187 per 100,000 white U.S. residents, up 12% from 167 in 2005. From 2005 to 2017, the incarceration rate of blacks declined 23%, from 803 to 616 per 100,000 black U.S. residents. As a result of those changes, the black-to-white incarceration ratio decreased from 4.8:1 to 3.3:1 from 2005 to 2017. Te Hispanic incarceration rate in 2017 was almost identical to that of whites. Te Asian incarceration rate was 11% as high as the overall incarceration rate. In 2005, the population of whites in local jails (331,000) exceeded that of blacks (290,500) by 14% (fgure 2, table 3). By 2017, whites (370,100) outnumbered blacks (250,100) by almost 50%. From 2005 to 2017, the percentage of the jail population that was white increased from 44% to 50%, while the percentage that was black decreased from 39% to 34% (table 4). Hispanics accounted for 15% of all jail inmates in 2017, the same as in 2005. FIGURE 2 Jail population, by race/Hispanic origin, 2005–2017 Jail population 400,000 Non-Hispanic white 300,000 Non-Hispanic black 200,000 Hispanic 100,000 Half of jail inmates were white and a third were black While the jail incarceration rate has dropped in recent years, the inmate population has remained relatively stable. Te composition of the jail population, however, has changed with respect to sex, race, and Hispanic origin. 0 ’05 ’10 ’15 ’17 Note: Based on the number of inmates held on the last weekday in June. Results may difer from previous reports in the series due to data updates from jails. Source: Bureau of Justice Statistics, Annual Survey of Jails, 2006–2017, and Census of Jail Inmates, 2005. TABLE 2 Jail incarceration rates, by sex and race/Hispanic origin, 2005 and 2010–2017 Demographic characteristic Totalb Adultsc Sexb Male Female Race/Hispanic origin Whited Blackd Hispanic American Indian/Alaska Natived Asiand Otherd,e 2005 253 † 334 † 2010 242 † 315 † 2011 236 † 307 † 2012 237 † 308 † 2013 231 299 2014 233 302 2015a 226 292 2016a 229 295 2017* 229 295 448 † 63 † 431 † 59 † 419 † 59 † 418 † 62 † 404 64 † 405 67 394 64 † 398 66 † 394 69 167 † 803 † 263 † 339 40 † 34 167 † 745 † 235 † 426 31 † 26 † 167 † 721 † 219 † 410 32 † 26 † 173 † 709 † 212 † 401 30 † 34 174 † 668 † 199 † 437 28 33 178 † 667 † 200 † 443 32 † 24 † 178 † 640 184 378 30 † 36 180 † 633 196 † 379 30 † 40 187 616 185 366 26 39 Note: Number of confned inmates in local jails per 100,000 U.S. residents (for total) or per 100,000 U.S. residents of a given demographic group, at midyear. Data are based on the inmate population confned on the last weekday in June. Results may difer from previous reports in the series due to data updates from jails. See appendix table 2 for standard errors. See appendix table 3 for denominators (U.S. resident population by sex and race/Hispanic origin) used for calculating incarceration rates. *Comparison year. †Diference with comparison year is signifcant at the 95% confdence level. aIn 2015 and 2016, the Annual Survey of Jails collected demographic data on inmate population at year-end instead of midyear. Jails typically hold fewer inmates at year-end than at midyear. In calculating midyear jail incarceration rates, the 2015 and 2016 inmate populations were adjusted for seasonal variation. See Adjusting for seasonal variation in Methodology. bIncludes both adults and juveniles. cExcludes persons age 17 or younger. dExcludes persons of Hispanic/Latino origin (e.g., white refers to non-Hispanic whites and black refers to non-Hispanic blacks). eIncludes Native Hawaiians, Other Pacifc Islanders, and persons of two or more races. Source: Bureau of Justice Statistics, Annual Survey of Jails, 2010–2017, and Census of Jail Inmates, 2005. J A I L I N M AT E S I N 201 7 | A P R I L 2019 4 TABLE 3 Number of confned inmates in local jails, by characteristics, 2005 and 2010–2017 Characteristic Total Sex Male Female Adults Male Female Juvenilesb Held as adultc Held as juvenile Race/Hispanic origin Whited Blackd Hispanic American Indian/ Alaska Natived Asiand Otherd,e Conviction status Convicted Unconvicted Most serious type of ofense Felony Misdemeanor Otherf 2005 747,500 2010 748,700 2011 735,600 2012 744,500 2013 731,200 2014 744,600 2015a 727,400 2016a 740,700 2017* 745,200 653,000 † 94,600 † 740,800 646,800 † 94,000 † 6,800 † 5,800 † 1,000 † 656,400 † 92,400 † 741,200 649,300 † 91,900 † 7,600 † 5,600 † 1,900 † 642,300 93,300 † 729,700 636,900 92,800 † 5,900 † 4,600 † 1,400 † 645,900 98,600 † 739,100 640,900 98,100 † 5,400 † 4,600 † 900 † 628,900 102,400 † 726,600 624,700 101,900 † 4,600 † 3,500 1,100 † 635,500 109,100 † 740,400 631,600 108,800 † 4,200 † 3,700 † 500 † 623,600 103,800 † 723,800 620,300 103,500 † 3,600 3,200 400 633,100 107,600 † 736,800 629,700 107,100 † 3,900 3,200 700 † 631,500 113,700 741,600 628,200 113,400 3,600 3,200 300 331,000 † 290,500 † 111,900 331,600 † 283,200 † 118,100 † 329,400 † 276,400 † 113,900 341,100 † 274,600 † 112,700 344,900 † 261,500 107,900 352,800 † 263,800 † 110,600 351,600 † 255,200 103,900 356,100 † 254,600 112,700 370,100 250,100 108,400 7,600 4,900 1,500 † 9,900 4,400 1,500 † 9,400 4,800 1,600 † 9,300 4,700 2,200 † 10,200 4,500 2,200 † 10,400 5,400 † 1,700 † 9,000 5,200 2,500 9,000 5,200 † 2,900 8,800 4,800 2,900 284,400 † 463,200 † 291,300 † 457,400 † 289,600 † 446,000 † 293,100 † 451,400 † 278,000 † 453,200 † 277,100 † 467,500 273,000 454,400 † 258,500 482,100 263,200 482,000 494,100 † 193,100 40,200 † 516,400 188,000 36,300 516,800 194,700 33,600 ... ... ... ... ... ... ... ... ... ... ... ... ... ... ... ... ... ... Note: Data are based on the inmate population confned on the last weekday in June, unless specifed. Data are adjusted for non-response and rounded to the nearest 100. Details may not sum to totals due to rounding. See table 6 in Jail Inmates at Midyear 2009 - Statistical Tables (NCJ 230122, BJS web, June 2010) for data from 2006 to 2009. Results may difer from previous reports in the series due to data updates from jails. See appendix table 4 for standard errors. *Comparison year. †Diference with comparison year is signifcant at the 95% confdence level. ...Not collected. aIn 2015 and 2016, the Annual Survey of Jails collected demographic data on the inmate population at year-end instead of midyear. Jails typically hold fewer inmates at year-end than at midyear. The 2015 and 2016 inmate populations were adjusted for seasonal variation and represent estimated midyear counts. See Methodology for details on estimation procedures. bPersons age 17 or younger. cIncludes juveniles who were tried or awaiting trial as adults. dExcludes persons of Hispanic/Latino origin (e.g., white refers to non-Hispanic whites and black refers to non-Hispanic blacks). eIncludes Native Hawaiians, Other Pacifc Islanders, and persons of two or more races. fIncludes civil infractions and unknown ofenses. Source: Bureau of Justice Statistics, Annual Survey of Jails, 2010–2017, and Census of Jail Inmates, 2005. J A I L I N M AT E S I N 201 7 | A P R I L 2019 5 From 2005 to 2017, the female jail population grew by 20%, while the male population experienced a small decline (3%). As a result, the percentage of the jail population that was female increased from 12.6% to 15.2%. In 2017, an estimated 65% of all jail inmates were awaiting court action on a current charge, up from 62% in 2005. Seven in 10 inmates were held in jail for felony charges. TABLE 4 Characteristics of confned inmates in local jails, 2005 and 2010–2017 Characteristic Sex Male Female Adults Male Female Juvenilesb Held as adultc Held as juvenile Race/Hispanic origin Whited Blackd Hispanic American Indian/ Alaska Natived Asiand Otherd,e Conviction status Convicted Unconvicted Most serious type of ofense Felony Misdemeanor Otherf 2005 2010 2011 2012 2013 2014 2015a 2016a 2017* 87.3% † 12.7 † 99.1% † 86.5 † 12.6 † 0.9% † 0.8 † 0.1 † 87.7% † 12.3 † 99.0% † 86.7 † 12.3 † 1.0% † 0.8 † 0.3 † 87.3% † 12.7 † 99.2% † 86.6 † 12.6 † 0.8% † 0.6 † 0.2 † 86.8% † 13.2 † 99.3% † 86.1 † 13.2 † 0.7% † 0.6 † 0.1 † 86.0% † 14.0 † 99.4% † 85.4 † 13.9 † 0.6% † 0.5 0.1 † 85.3% † 14.7 † 99.4% † 84.8 † 14.6 † 0.6% † 0.5 † 0.1 † 85.7% † 14.3 † 99.5% 85.3 † 14.2 † 0.5% 0.4 0.1 85.5% † 14.5 † 99.5% 85.0 † 14.5 † 0.5% 0.4 0.1 † 84.7% 15.3 99.5% 84.3 15.2 0.5% 0.4 -- 44.3% † 38.9 † 15.0 44.3% † 37.8 † 15.8 † 44.8% † 37.6 † 15.5 † 45.8% † 36.9 † 15.1 47.2% † 35.8 † 14.8 47.4% † 35.4 † 14.9 48.3% † 35.1 † 14.3 48.1% † 34.4 15.2 49.7% 33.6 14.5 1.0 0.7 † 0.2 † 1.3 0.6 † 0.2 † 1.3 0.7 0.2 † 1.2 0.7 † 0.3 1.2 0.7 † 0.4 † 1.2 0.6 0.4 38.0% † 62.0 † 38.9% † 61.1 † 39.4% † 60.6 † 39.4% † 60.6 † 38.0% † 62.0 † 37.2% † 62.8 † 37.5% † 62.5 † 34.9% 65.1 35.3% 64.7 ... ... ... ... ... ... ... ... ... ... ... ... ... ... ... ... ... ... 67.8% † 26.5 5.5 † 69.7% 25.4 4.9 69.4% 26.1 4.5 1.2 0.6 0.3 1.4 0.6 † 0.3 † 1.4 0.7 0.2 Note: Details may not sum to totals due to rounding. Data for 2005, 2010–2014, and 2017 are based on the inmate population confned on the last weekday in June. See table 7 in Jail Inmates at Midyear 2009 - Statistical Tables (NCJ 230122, BJS web, June 2010) for data from 2006 to 2009. Results may be diferent from previous reports in the series due to data updates from jails. See appendix table 5 for standard errors. *Comparison year. †Diference with comparison year is signifcant at the 95% confdence level. --Less than 0.05%. ...Not collected. aBased on the inmate population confned on December 31. In 2015 and 2016, the Annual Survey of Jails collected demographic data on inmate population at year-end instead of midyear. bPersons age 17 or younger. cJuveniles who were tried or awaiting trial as adults. dExcludes persons of Hispanic/Latino origin (e.g., white refers to non-Hispanic whites and black refers to non-Hispanic blacks). eIncludes Native Hawaiians, Other Pacifc Islanders, and persons of two or more races. fIncludes civil infractions and unknown ofenses. Source: Bureau of Justice Statistics, Annual Survey of Jails, 2010–2017, and Census of Jail Inmates, 2005. J A I L I N M AT E S I N 201 7 | A P R I L 2019 6 The total rated capacity of jails was 915,100 beds Tere were more than 2,800 local jail jurisdictions in the United States in 2017 (table 5). Among these jurisdictions, roughly a third (34%) held fewer than 50 inmates on an average day. Tese smallest jails had a mean average daily TABLE 5 Average daily jail population, by size of jurisdiction, 2017 Jail jurisdiction Jail jurisdictions size (ADP)* Number Percent Total 2,828 100% 49 or fewer 972 34.4 50–99 516 18.3 100–249 677 24.0 250–499 305 10.8 500–999 205 7.2 1,000–2,499 121 4.3 2,500 or more 30 1.1 Total ADP* Number Percent Mean ADP 745,600 100% 264 21,600 2.9 22 35,500 4.8 69 111,300 14.9 164 109,200 14.6 358 144,500 19.4 705 173,700 23.3 1,431 149,900 20.1 4,925 Note: Details may not sum to totals due to rounding. See appendix table 6 for standard errors. *The average daily population (ADP) is the sum of all inmates in jail each day for the 12-month period ending on June 30, divided by the number of days in the 12-month period. Source: Bureau of Justice Statistics, Annual Survey of Jails, 2017. TABLE 6 Jail capacity, midyear population, and percent of capacity occupied in local jails, 2005–2017 Year 2005 2006 2007 2008 2009 2010 2011 2012 2013 2014 2015 2016 2017* Jail capacitya 787,000 795,000 810,500 828,700 849,900 857,900 870,400 877,400 872,900 890,500 901,400 915,400 915,100 † † † † † † † † † Midyear Percent of capacity populationb occupiedc 747,500 95.0% † 765,800 † 96.3 † 780,200 † 96.3 † 785,500 † 94.8 † 767,400 † 90.3 † 748,700 87.3 † 735,600 84.5 † 744,500 84.9 † 731,200 83.8 † 744,600 83.6 † 727,400 80.7 740,700 80.9 745,200 81.4 population (ADP) of 22 inmates. An estimated 151 jail jurisdictions had an ADP of 1,000 or more inmates. Tese large jails, representing just 5.3% of jail jurisdictions, held 43% of all jail inmates in 2017. Te total rated capacity of local jails was 915,100 beds in 2017, up from 787,000 in 2005 (fgure 3; table 6). About 4 in 5 (81%) jail beds were occupied at midyear 2017, down from 95% in 2005. An estimated 20% of jail FIGURE 3 Jail capacity, midyear population, and percent of capacity occupied in local jails, 2005–2017 Number 1,000,000 Percent 100 Percent of capacity occupieda Jail capacityb 800,000 80 Midyear population c 600,000 60 400,000 40 200,000 20 0 ’05 ’10 ’15 ’17 0 Note: Results may difer from previous reports in the series due to data updates from jails. See table 6 for estimates. aThe midyear inmate population divided by the rated capacity. bMaximum number of beds or inmates assigned by a rating ofcial to a facility, excluding separate temporary holding areas. cThe number of inmates held on the last weekday in June. Source: Bureau of Justice Statistics, Annual Survey of Jails, 2006–2017, and Census of Jail Inmates, 2005. Note: Results may difer from previous reports in the series due to data updates from jails. See appendix table 7 for standard errors. *Comparison year. †Diference with comparison year is signifcant at the 95% confdence level. aMaximum number of beds or inmates assigned by a rating ofcial to a facility, excluding separate temporary holding areas. bThe number of inmates held on the last weekday in June. cThe midyear inmate population divided by the rated capacity. Source: Bureau of Justice Statistics, Annual Survey of Jails, 2006–2017, and Census of Jail Inmates, 2005. J A I L I N M AT E S I N 201 7 | A P R I L 2019 7 jurisdictions were operating at or above 100% of their rated capacity at midyear 2017 (table 7), down from 26% in 2005 (not shown). Among jail jurisdictions with an ADP between 250 and 499, the percentage of jail jurisdictions operating at or above rated capacity was 30%, in comparison to 19% of jail jurisdictions with an ADP of 1,000 to 2,499. The estimated average time in jail was 26 days in 2017 In 2017, the overall weekly inmate turnover rate was 54%, and the estimated average time in jail was 26 days (table 8). Smaller jails had higher weekly inmate turnover rates and shorter lengths of stay than larger jails. On average, jails with an ADP of 2,500 or more held inmates about twice as long (34 days) as smaller jails with an ADP of less than 100 (15 days). TABLE 7 Percent of jail capacity occupied, by size of jurisdiction, 2017 Jail jurisdiction size (ADP) Total 49 or fewer 50–99 100–249 250–499 500–999 1,000–2,499 2,500 or more* Midyear populationa 745,200 21,300 36,400 109,000 111,400 144,100 174,400 148,800 Rated capacityb 915,100 36,300 49,900 128,100 127,600 178,100 203,500 191,600 Percent of capacity occupied at midyearc 81.4% 58.7 † 72.8 85.1 † 87.3 † 80.9 † 85.7 † 77.6 Percent of jail jurisdictions operating at more than 100% of rated capacity at midyear 20.0% 11.0 26.6 22.6 30.4 † 22.7 † 19.0 17.1 Note: Jail jurisdiction size is based on the average daily population (ADP). Details may not sum to totals due to rounding. See appendix table 8 for standard errors. *Comparison group. †Diference with comparison group is signifcant at the 95% confdence level. aThe number of inmates held on the last weekday in June. bMaximum number of beds or inmates assigned by a rating ofcial to a facility, excluding separate temporary holding areas. cThe midyear population divided by the rated capacity. Source: Bureau of Justice Statistics, Annual Survey of Jails, 2017. TABLE 8 Inmate turnover rate and estimated average time in jail, by size of jurisdiction, 2017 Jail jurisdiction size (ADP) Total 49 or fewer 50–99 100–249 250–499 500–999 1,000–2,499 2,500 or more* Average daily populationa 745,600 21,600 35,500 111,300 109,200 144,500 173,700 149,900 Annual admissions 10,570,300 684,300 726,200 1,899,400 1,543,000 2,022,100 2,086,200 1,609,000 Weekly inmate turnover rateb 54.0% 120.9 † 77.2 † 65.0 † 53.7 † 53.1 † 46.0 † 40.7 Estimated average time in jailc 25.7 days 11.5 † 17.8 † 21.4 † 25.8 † 26.1 † 30.4 † 34.0 Note: Jail jurisdiction size is based on the average daily population (ADP). Details may not sum to totals due to rounding. See appendix table 9 for standard errors. *Comparison group. †Diference with comparison group is signifcant at the 95% confdence level. aThe sum of all inmates in jail each day for the 12-month period ending on June 30, divided by the number of days in the 12-month period. bThe sum of weekly admissions and releases, divided by the ADP. Weekly admissions and releases are calculated as the annual admissions and releases, divided by the number of weeks in the 12-month period. cThe ADP divided by the number of annual admissions, then multiplied by the number of days in a year. Source: Bureau of Justice Statistics, Annual Survey of Jails, 2017. J A I L I N M AT E S I N 201 7 | A P R I L 2019 8 55,900 persons were supervised outside jail In addition to the confned jail population of 745,200 persons at midyear 2017, jail authorities supervised 55,900 persons in programs outside the jail, including weekend programs, electronic monitoring, home detention, day reporting, community service, alcohol or drug treatment programs, and other pre-trial and work programs (table 9). From 2008 to 2017, the number of persons supervised outside jail decreased 23%, from 72,900 to 55,900. TABLE 9 Persons under jail supervision, by confnement status, 2006–2017 Year 2006 2007 2008 2009 2010 2011 2012 2013 2014 2015b 2016b 2017* Total 826,000 † 848,400 † 858,400 † 837,600 † 809,400 798,400 808,600 790,600 808,100 782,300 794,900 801,100 Held in jail 765,800 † 780,200 † 785,500 † 767,400 † 748,700 735,600 744,500 731,200 744,600 727,400 740,700 745,200 Supervised outside of a jail facilitya 60,200 68,200 † 72,900 † 70,200 † 60,600 62,800 † 64,100 † 59,400 63,500 † 54,900 54,200 55,900 Note: Based on the number of inmates supervised on the last weekday in June, unless specifed. Data are rounded to the nearest 100. Details may not sum to totals due to rounding. See appendix table 10 for standard errors. *Comparison year. †Diference with comparison year is signifcant at the 95% confdence level. aExcludes persons supervised by a probation or parole agency. Includes ofenders who serve their sentences of confnement on weekends only (i.e., Friday to Sunday); persons under electronic monitoring; persons in work release programs, work gangs, and other alternative work programs; and persons in drug, alcohol, mental health, and other medical treatment. bIn 2015 and 2016, the Annual Survey of Jails collected the number of persons supervised outside of a jail facility on December 31. Source: Bureau of Justice Statistics, Annual Survey of Jails, 2006–2017. J A I L I N M AT E S I N 201 7 | A P R I L 2019 Local jail jurisdictions employed 225,700 full-time staf at midyear 2017 (table 10). Similar to in 2016, an estimated 4 in 5 (80%) jail employees in 2017 were correctional ofcers, including deputies, monitors, and other custody staf who spend more than half of their time with the incarcerated population. In 2017, an estimated 69% of correctional ofcers and 44% of other staf were male. Te inmate-to-correctional-ofcer ratio was 4.2:1 at midyear 2017. TABLE 10 Staf employed in local jails, by sex, year-end 2016 and midyear 2017 Job function Total Correctional ofcersa Male Female All other stafb Male Female Number 2016 2017* 226,300 225,700 178,800 179,500 124,300 123,200 54,500 56,300 47,500 46,200 21,000 20,300 26,500 25,900 Percent 2016 2017* 100% 100% 79.0% 79.5% 54.9 54.6 24.1 25.0 21.0% 20.5% 9.3 9.0 11.7 11.5 Note: Details may not sum to totals due to rounding. Results may difer from previous reports in the series due to data updates from jails. See appendix table 11 for standard errors. *Comparison year. †Diference with comparison year is signifcant at the 95% confdence level. aIncludes deputies, monitors, and other custody staf who spend more than 50% of their time with the incarcerated population. bIncludes administrators, clerical and maintenance staf, educational staf, professional and technical staf, and other unspecifed staf who spend more than 50% of their time in the facility. Source: Bureau of Justice Statistics, Annual Survey of Jails, 2016 and 2017. 9 Methodology In years between the complete censuses of jails, the Bureau of Justice Statistics (BJS) conducts the Annual Survey of Jails (ASJ) to estimate the number and characteristics of the jail population in the United States. Te ASJ is a nationally representative survey of all county or city jail jurisdictions and all regional jails in the country. Te combined jail and prison systems in Alaska, Connecticut, Delaware, Hawaii, Rhode Island, and Vermont are not covered. Tese are included in BJS’s prison collection. However, Alaska’s 15 locally operated jails are covered. A jail jurisdiction is a county (parish in Louisiana) or municipal government that administers one or more local jails and represents the entity responsible for managing jail facilities under its authority. Most jail jurisdictions consist of a single facility, but some have multiple facilities, or multiple facility operators, called reporting units. For example, four reporting units in Allegheny County, Pennsylvania, represent a single jail jurisdiction. Te ASJ sample is drawn at the jurisdiction level. When a jail jurisdiction with multiple reporting units is sampled, data are collected from all reporting units within that jail jurisdiction. Sampling design Te ASJ uses a stratifed probability sampling design based on jail population data collected through the most recent Census of Jails (2013). Jails in the ASJ sample are surveyed annually until the next sample refresh. Te most recent sample refresh occurred in 2015. A sample of 876 jail jurisdictions was selected to represent the approximately 2,851 jail jurisdictions nationwide. In selecting the jails, all jurisdictions were grouped into 10 strata based on their average daily population (ADP) and presence of juveniles measured in the most recent Census of Jails. In 8 of the 10 strata, a random sample of jail jurisdictions was selected. Te remaining two strata were certainty strata, where all jurisdictions were selected with a probability of one. One certainty stratum consisted of all jails that were operated jointly by two or more jurisdictions (referred to as multi-jurisdictional jails). Te other certainty stratum consisted of all jail jurisdictions that— held juvenile inmates at the time of the 2013 Census of Jails and had an ADP of 500 or more inmates during the 12 months ending on December 31, 2013 held only adult inmates and had an ADP of 750 or more J A I L I N M AT E S I N 201 7 | A P R I L 2019 were known to be operating in 2015 and not included in the 2013 Census of Jails were located in California. Te ASJ sample includes all California jail jurisdictions. Tis sampling feature was introduced in 2013 in response to the enactment of California Assembly Bill (AB) 109 and AB 117, aimed to reduce the number of inmates housed in state prisons starting on October 1, 2011. Afer the enactment of these two laws, the jail population in California experienced an unusual increase that the rest of the United States did not experience. For this reason, the ASJ sampling design was modifed to include all California jail jurisdictions in a certainty (selfrepresenting) stratum. (See Methodology in Jail Inmates at Midyear 2014, NCJ 248629, BJS web, June 2015.) Te inclusion of all California jail jurisdictions resulted in an additional 21 jurisdictions (California has 65 jurisdictions in total). Te sample also includes in the certainty stratum six new jail jurisdictions that were known to be operating in 2015 and were not represented in the sampling frame (2013 Census of Jails). Response rate and non-response adjustment ASJ data for 2017 were collected through a web-based survey. Te sample consisted of 871 active jail jurisdictions. Sixty jurisdictions did not respond to the survey. Te response rate was 93%. Non-response weighting adjustment Non-response weighting was implemented to account for unit non-response. Jurisdictions were grouped into weighting classes based on sampling stratum and the 2013 inmate population. Using a simple weighting class method, a non-response weighting adjustment factor was calculated within each weighting class h as— 𝐹𝐹ℎ = where— 𝑛𝑛 ℎ 𝑊𝑊 × 𝐽𝐽𝐽𝐽𝐽𝐽𝐽𝐽𝐽𝐽𝐽𝐽 ∑ 𝑖𝑖=1 ℎ𝑖𝑖 ℎ𝑖𝑖 𝑛𝑛 ℎ 𝑊𝑊 × 𝐽𝐽𝐽𝐽𝐽𝐽𝐽𝐽𝐽𝐽𝐽𝐽 ∑𝑖𝑖=1 ℎ𝑖𝑖 ℎ𝑖𝑖 nh = number of jurisdictions sampled in weighting class h, Whi = sampling weight for jurisdiction i in weighting class h, JURISAhi = active status indicator for jurisdiction i in weighting class h (1 = active, 0 = out of scope), and JURISRhi = response indicator of jurisdiction i in weighting class h (1 = respondent, 0 = non-respondent). 10 Final weight Te fnal weight FWhi for each jail jurisdiction is calculated as the product of the sampling weight, the weighting class adjustment within each weighting class, and the jurisdiction’s response factor. FWhi = Whi × Fh × JURISRhi Item non-response imputation Item response rates ranged from 94% to 100%. For responding jail jurisdictions that were unable to provide some requested items, a weighted sequential hot- or cold-deck imputation procedure was used to impute values. Tis procedure, implemented using the SUDAAN sofware package, substitutes current-year respondent and prior-year (2015 and 2016 ASJ, cold-deck) data for missing values. Te donor for each missing item was randomly selected from within a set of similar jails, sorted by related previous-year population values. Te resulting imputed values are generally similar to the reported values of the previous year. Adjusting for seasonal variation in jail population Prior to 2015, the ASJ asked jails to report the total and detailed inmate counts on the last weekday in June (the midyear reference date). In 2015 and 2016, the J A I L I N M AT E S I N 201 7 | A P R I L 2019 ASJ collected the total confned population at midyear but detailed inmate counts by characteristics (i.e., sex, race, Hispanic origin, age category, conviction status, and most serious type of ofense) on December 31 (the year-end reference date). Te 2017 ASJ reverted back to the midyear reference. Comparisons of year-end data with midyear data need to consider seasonal variations, as jails typically hold fewer inmates at year-end than at midyear. To adjust for the seasonal variation, the numbers of jail inmates by characteristic from 2015 and 2016 year-end collections in table 3 were multiplied by the ratio of midyear confned population to year-end confned population of the corresponding year. Te standard errors for the 2015 and 2016 counts in appendix table 3 were similarly adjusted. Te seasonally adjusted jail populations were also used in the calculation of 2015 and 2016 jail incarceration rates in table 2. Calculating weekly inmate turnover rates Te weekly jail inmate turnover rate is the sum of the average weekly admissions and releases, divided by the ADP. Te inmate turnover rate is an indicator of the fuctuation of the jail population. 11 APPENDIX TABLE 1 Standard errors for table 1: Inmates confned at midyear, average daily population, annual admissions, and incarceration rates, 2005–2017 Year 2005 2006 2007 2008 2009 2010 2011 2012 2013 2014 2015 2016 2017 Confned inmates ~ 3,552 3,720 4,016 4,231 5,430 6,009 7,684 8,042 8,382 7,188 5,943 6,614 Average daily population ~ 3,230 3,549 3,883 4,109 5,359 5,879 7,769 7,943 8,430 7,112 5,788 7,431 Annual admissions ~ ~ 169,151 272,916 178,537 233,704 211,335 188,549 688,181 205,287 141,792 138,605 152,636 Jail incarceration rate ~ 1.2 1.2 1.3 1.4 1.8 1.9 2.4 2.5 2.6 2.2 1.8 2.0 ~Not applicable. Data represent a complete enumeration based on the 2005 Census of Jail Inmates. Source: Bureau of Justice Statistics, Annual Survey of Jails, 2006–2017; Census of Jail Inmates, 2005; Mortality in Correctional Institutions (formerly Deaths in Custody Reporting Program), 2006 (for admissions only); and U.S. Census Bureau, Population Estimates by Age, Sex, Race, and Hispanic Origin for the United States: January 1, 2005, to January 1, 2018. APPENDIX TABLE 2 Standard errors for table 2: Jail incarceration rates, by sex and race/Hispanic origin, 2005 and 2010–2017 Demographic characteristic Total Adults Sex Male Female Race/Hispanic origin White Black Hispanic American Indian/Alaska Native Asian Other 2005 ~ ~ 2010 1.8 2.3 2011 1.9 2.5 2012 2.5 3.2 2013 2.5 3.3 2014 2.6 3.3 2015 2.2 2.9 2016 1.9 2.4 2017 2.0 2.6 ~ ~ 3.2 0.6 3.4 0.7 4.4 0.9 4.6 0.9 4.5 0.9 4.0 0.8 3.3 0.8 3.5 0.8 ~ ~ ~ ~ ~ ~ 1.8 8.4 4.2 44.3 0.8 2.7 1.9 8.9 5.0 40.7 1.2 2.4 2.2 11.9 5.6 37.5 1.4 2.9 2.3 12.4 4.8 40.0 0.8 3.2 2.3 11.9 4.9 39.4 0.9 3.1 2.1 8.9 5.8 38.2 0.9 2.3 2.2 9.1 3.4 35.7 0.8 4.8 2.3 9.8 3.7 33.2 0.9 3.5 ~Not applicable. Data represent a complete enumeration based on the 2005 Census of Jail Inmates. Source: Bureau of Justice Statistics, Annual Survey of Jails, 2010–2017, and Census of Jail Inmates, 2005. J A I L I N M AT E S I N 201 7 | A P R I L 2019 12 APPENDIX TABLE 3 U.S. resident population, by sex and race/Hispanic origin at midyear, 2005 and 2010–2017 Characteristic Total Adultsa Sex Male Female Race/Hispanic origin Whiteb Blackb Hispanic American Indian/ Alaska Nativeb Asianb Otherb,c 2005 2010 2011 2012 2013 2014 2015 2016 2017 295,843,000 309,466,000 311,656,000 313,930,000 316,418,000 319,023,000 321,177,000 323,141,000 325,218,000 222,082,000 235,113,000 237,718,000 240,169,000 242,773,000 245,381,000 247,509,000 249,469,000 251,616,000 145,599,000 152,455,000 153,324,000 154,514,000 155,749,000 157,024,000 158,102,000 159,101,000 160,158,000 150,245,000 157,010,000 158,332,000 159,416,000 160,669,000 161,998,000 163,075,000 164,040,000 165,059,000 198,119,000 198,765,000 197,546,000 197,713,000 197,842,000 197,928,000 197,992,000 197,903,000 197,733,000 36,163,000 38,029,000 38,346,000 38,710,000 39,133,000 39,551,000 39,904,000 40,243,000 40,588,000 42,579,000 50,296,000 52,059,000 53,111,000 54,182,000 55,422,000 56,467,000 57,541,000 58,733,000 2,242,000 2,328,000 2,292,000 2,311,000 2,330,000 2,351,000 2,370,000 2,387,000 2,403,000 12,291,000 14,382,000 15,066,000 15,548,000 16,200,000 16,832,000 17,309,000 17,745,000 18,250,000 4,449,000 5,666,000 6,348,000 6,536,000 6,731,000 6,939,000 7,135,000 7,322,000 7,512,000 Note: The numbers of U.S. residents at midyear were interpolated from the U.S. Census Bureau's population projections for January 1, 2005, to January 1, 2018. Rounded to the nearest thousand. aIncludes persons ages 18 and older. bExcludes persons of Hispanic/Latino origin (e.g., white refers to non-Hispanic whites and black refers to non-Hispanic blacks). cIncludes Native Hawaiians, Other Pacifc Islanders, and persons of two or more races. Source: U.S. Census Bureau, Population Estimates by Age, Sex, Race and Hispanic Origin for the United States: January 1, 2005, to January 1, 2018. J A I L I N M AT E S I N 201 7 | A P R I L 2019 13 APPENDIX TABLE 4 Standard errors for table 3: Number of confned inmates in local jails, by characteristics, 2005 and 2010–2017 Characteristic Total Sex Male Female Adults Male Female Juveniles Held as adult Held as juvenile Race/Hispanic origin White Black Hispanic American Indian/Alaska Native Asian Other Conviction status Convicted Unconvicted Most serious type of ofense Felony Misdemeanor Other 2005 ~ 2010 5,430 2011 6,009 2012 7,684 2013 8,042 2014 8,382 2015 7,198 2016 6,013 2017 6,614 ~ ~ ~ ~ ~ ~ ~ ~ 4,832 999 5,400 4,794 994 263 246 255 5,278 1,179 6,004 5,241 1,177 172 151 77 6,776 1,404 7,655 6,685 1,398 241 230 84 7,088 1,469 8,049 7,025 1,467 199 143 139 7,015 1,532 8,004 6,961 1,531 164 158 46 6,242 1,307 7,187 6,230 1,306 121 117 45 5,237 1,247 5,971 5,197 1,247 158 118 98 5,680 1,351 6,569 5,635 1,349 128 127 36 ~ ~ ~ ~ ~ ~ 3,589 3,194 2,131 1,031 117 160 3,764 3,418 2,617 933 185 153 4,370 4,608 2,958 866 219 189 4,574 4,860 2,580 932 122 213 4,605 4,712 2,719 926 156 216 4,192 3,548 3,297 906 157 167 4,361 3,680 1,981 853 137 349 4,629 3,987 2,165 798 155 259 ~ ~ 3,292 4,515 3,521 4,819 3,750 5,918 3,619 6,740 4,156 5,691 4,937 4,731 3,458 5,690 3,568 5,792 ... ... ... ... ... ... ... ... ... ... ... ... ... ... ... ... ... ... 5,701 3,106 1,822 5,482 2,899 1,361 5,810 3,388 1,774 ...Not collected. ~Not applicable. Data present a complete enumeration based on the 2005 Census of Jail Inmates. Source: Bureau of Justice Statistics, Annual Survey of Jails, 2010–2017, and Census of Jail Inmates, 2005. J A I L I N M AT E S I N 201 7 | A P R I L 2019 14 APPENDIX TABLE 5 Standard errors for table 4: Characteristics of confned inmates in local jails, 2005 and 2010–2017 Characteristic Sex Male Female Adults Male Female Juveniles Held as adult Held as juvenile Race/Hispanic origin White Black Hispanic American Indian/Alaska Native Asian Other Conviction status Convicted Unconvicted Most serious type of ofense Felony Misdemeanor Other 2005 2010 2011 2012 2013 2014 2015 2016 2017 ~ ~ ~ ~ ~ ~ ~ ~ 0.10% 0.10 0.04% 0.10 0.10 0.04% 0.03 0.03 0.12% 0.12 0.02% 0.12 0.12 0.02% 0.02 0.01 0.13% 0.13 0.03% 0.13 0.13 0.03% 0.03 0.01 0.14% 0.14 0.03% 0.14 0.14 0.03% 0.02 -- 0.15% 0.15 0.02% 0.14 0.15 0.02% 0.02 0.01 0.11% 0.11 0.02% 0.11 0.11 0.02% 0.02 0.01 0.12% 0.12 0.02% 0.12 0.12 0.02% 0.02 0.01 0.12% 0.12 0.02% 0.12 0.12 0.02% 0.02 -- ~ ~ ~ ~ ~ ~ 0.41% 0.40 0.30 0.17 0.02 0.03 0.43% 0.39 0.34 0.14 0.03 0.02 0.52% 0.47 0.38 0.13 0.03 0.03 0.55% 0.51 0.34 0.15 0.02 0.03 0.51% 0.48 0.34 0.14 0.02 0.03 0.46% 0.37 0.36 0.12 0.02 0.02 0.42% 0.38 0.25 0.11 0.02 0.05 0.45% 0.41 0.27 0.11 0.02 0.03 ~ ~ 0.41% 0.41 0.42% 0.42 0.47% 0.47 0.52% 0.52 0.48% 0.48 0.47% 0.47 0.45% 0.45 0.43% 0.43 ... ... ... ... ... ... ... ... ... ... ... ... ... ... ... ... ... ... 0.40% 0.36 0.24 0.39% 0.36 0.18 0.44% 0.41 0.23 --Less than 0.005%. ...Not collected. ~Not applicable. Data represent a complete enumeration based on the 2005 Census of Jail Inmates. Source: Bureau of Justice Statistics, Annual Survey of Jails, 2010–2017, and Census of Jail Inmates, 2005. APPENDIX TABLE 6 Standard errors for table 5: Average daily jail population, by size of jurisdiction, 2017 Jail jurisdiction size (ADP) Total 49 or fewer 50–99 100–249 250–499 500–999 1,000–2,499 2,500 or more Jail jurisdictions Number Percent -~ 46.3 1.64% 50.0 1.77 40.3 1.42 13.0 0.46 5.6 0.20 1.7 0.06 1.1 0.04 Total ADP Number Percent 7,431 ~ 2,099 0.28% 3,396 0.46 6,558 0.82 4,149 0.55 3,485 0.48 2,516 0.44 5,935 0.69 Mean ADP 2.6 1.7 1.5 3.9 4.4 4.9 8.9 94.4 --Less than 0.05%. ~Not applicable. Source: Bureau of Justice Statistics, Annual Survey of Jails, 2017. J A I L I N M AT E S I N 201 7 | A P R I L 2019 15 APPENDIX TABLE 7 Standard errors for table 6: Jail capacity, midyear population, and percent of capacity occupied in local jails, 2005–2017 Year 2005 2006 2007 2008 2009 2010 2011 2012 2013 2014 2015 2016 2017 Jail capacity ~ 4,741 5,056 5,063 6,460 11,013 11,776 10,217 13,198 11,082 9,518 8,467 9,217 Midyear population ~ 3,552 3,720 4,016 4,231 5,430 6,009 7,684 8,042 8,382 7,188 5,943 6,614 Percent of capacity occupied ~ 0.41% 0.45 0.42 0.45 0.88 0.88 0.48 0.49 0.43 0.41 0.43 0.48 ~Not applicable. Data represent a complete enumeration based on the 2005 Census of Jail Inmates. Source: Bureau of Justice Statistics, Annual Survey of Jails, 2006–2017. APPENDIX TABLE 8 Standard errors for table 7: Percent of jail capacity occupied, by size of jurisdiction, 2017 Jurisdiction size (ADP) Total 49 or fewer 50–99 100–249 250–499 500–999 1,000–2,499 2,500 or more Midyear population 6,614 2,278 3,607 5,340 4,277 3,559 2,535 5,813 Rated capacity 9,217 3,520 5,224 6,566 5,119 4,328 3,187 7,984 Percent of jail jurisdictions Percent of capacity operating at more than 100% occupied at midyear of rated capacity at midyear 0.48% 2.04% 4.23 4.08 3.69 6.05 1.75 3.45 1.25 3.00 0.66 1.55 0.50 0.82 0.64 1.46 Source: Bureau of Justice Statistics, Annual Survey of Jails, 2017. J A I L I N M AT E S I N 201 7 | A P R I L 2019 16 APPENDIX TABLE 9 Standard errors for table 8: Inmate turnover rate and estimated average time in jail, by size of jurisdiction, 2017 Jail jurisdiction size (ADP) Total 49 or fewer 50–99 100–249 250–499 500–999 1,000–2,499 2,500 or more Average daily population 7,431 2,099 3,396 6,558 4,149 3,485 2,516 5,935 Annual admissions 152,636 80,616 92,678 116,296 71,802 67,482 36,009 61,973 Weekly inmate turnover rate 0.73% 11.09 5.66 3.34 1.53 0.94 0.46 0.62 Estimated average time in jail 0.35 days 1.06 1.33 1.10 0.73 0.46 0.30 0.53 Source: Bureau of Justice Statistics, Annual Survey of Jails, 2017. APPENDIX TABLE 10 Standard errors for table 9: Persons under jail supervision, by confnement status, 2006–2017 Year 2006 2007 2008 2009 2010 2011 2012 2013 2014 2015 2016 2017 Total 3,783 4,041 4,732 4,548 5,897 6,446 8,438 8,692 9,248 7,510 6,543 7,250 Held in jail 3,552 3,720 4,016 4,231 5,430 6,009 7,684 8,042 8,382 7,188 5,943 6,614 Supervised outside of a jail facility 1,151 1,267 2,327 1,535 1,960 1,832 2,418 2,351 2,707 1,548 1,868 2,194 Source: Bureau of Justice Statistics, Annual Survey of Jails, 2006–2017. APPENDIX TABLE 11 Standard errors for table 10: Staf employed in local jails, by sex, year-end 2016 and midyear 2017 Job function Total Correctional ofcers Male Female All other staf Male Female Number 2016 2017 3,368 3,903 2,881 3,408 1,817 2,142 1,238 1,445 1,065 915 534 627 535 498 Percent 2016 2017 ~ ~ 0.38% 0.33% 0.32 0.29 0.30 0.32 0.38% 0.33% 0.23 0.19 0.21 0.21 ~Not applicable. Source: Bureau of Justice Statistics, Annual Survey of Jails, 2016 and 2017. J A I L I N M AT E S I N 201 7 | A P R I L 2019 17 Te Bureau of Justice Statistics of the U.S. Department of Justice is the principal federal agency responsible for measuring crime, criminal victimization, criminal ofenders, victims of crime, correlates of crime, and the operation of criminal and civil justice systems at the federal, state, tribal, and local levels. BJS collects, analyzes, and disseminates reliable statistics on crime and justice systems in the United States, supports improvements to state and local criminal justice information systems, and participates with national and international organizations to develop and recommend national standards for justice statistics. Jefrey H. Anderson is the director. Tis report was written by Zhen Zeng. Todd Minton and Stephanie Mueller verifed the report. Eric Hendrixson and Jill Tomas edited the report. Pei Miller produced the report. April 2019, NCJ 251774 NCJ 251774 Ofce of Justice Programs Building Solutions • Supporting Communities • Advancing Justice www.ojp.gov


