

Wa Office of Fin Mgt Research Brief Sentencing Reform Act 2006
Download original document:
Document text
Document text
This text is machine-read, and may contain errors. Check the original document to verify accuracy.
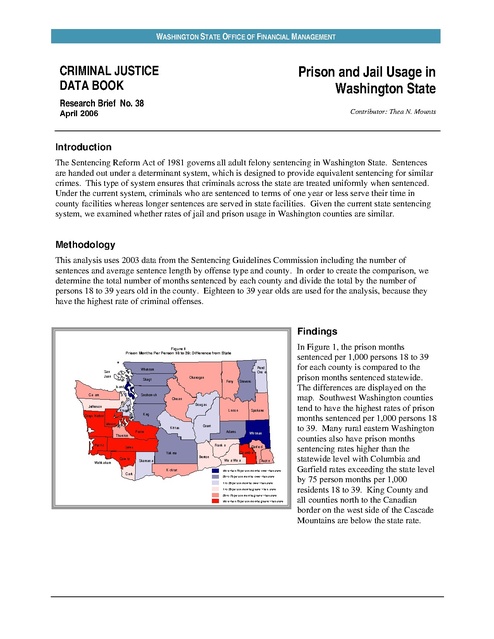
WASHINGTON STATE OFFICE OF FINANCIAL MANAGEMENT

CRIMINAL JUSTICE
DATA BOOK

Prison and Jail Usage in
Washington State

Research Brief No. 38
Contributor: Thea N. Mounts

April 2006

Introduction
The Sentencing Reform Act of 1981 governs all adult felony sentencing in Washington State. Sentences
are handed out under a determinant system, which is designed to provide equivalent sentencing for similar
crimes. This type of system ensures that criminals across the state are treated uniformly when sentenced.
Under the current system, criminals who are sentenced to terms of one year or less serve their time in
county facilities whereas longer sentences are served in state facilities. Given the current state sentencing
system, we examined whether rates of jail and prison usage in Washington counties are similar.

Methodology
This analysis uses 2003 data from the Sentencing Guidelines Commission including the number of
sentences and average sentence length by offense type and county. In order to create the comparison, we
determine the total number of months sentenced by each county and divide the total by the number of
persons 18 to 39 years old in the county. Eighteen to 39 year olds are used for the analysis, because they
have the highest rate of criminal offenses.

Findings
Figure 1
Prison Months Per Person 18 to 39: Difference from State

Pend
Oreille

Whatcom

San
Juan

Okanogan

Skagit

Ferry

Stevens

Island
Clallam

Snohomish

Chelan
Douglas

Jefferson

Kitsap

Grays Harbor
Mason
Thurston
Pacific

Lincoln

King

Pierce

Kittitas

Wahkiakum

Grant
Adams
Franklin

Lewis
Yakima
Cowlitz

Clark

Skamania
Klickitat

Spokane

Benton

Whitman
Garfield
Columbia

Walla Walla

Asotin

More than 75 person months lower than state
25 to 75 person months lower than state
1 to 25 person months lower than state
1 to 25 person months greater than state
25 to 75 person months greater than state
More than 75 person months greater than state

In Figure 1, the prison months
sentenced per 1,000 persons 18 to 39
for each county is compared to the
prison months sentenced statewide.
The differences are displayed on the
map. Southwest Washington counties
tend to have the highest rates of prison
months sentenced per 1,000 persons 18
to 39. Many rural eastern Washington
counties also have prison months
sentencing rates higher than the
statewide level with Columbia and
Garfield rates exceeding the state level
by 75 person months per 1,000
residents 18 to 39. King County and
all counties north to the Canadian
border on the west side of the Cascade
Mountains are below the state rate.

RESEARCH BRIEF NO. 38

OFM FORECASTING DIVISION

Figure 2
Jail Months Per Person 18 to 39: Difference from State

Pend
Oreille

Whatcom

San
Juan

Okanogan

Skagit

Ferry

Stevens

Island
Clallam

Snohomish

Chelan
Douglas

Jefferson

Kitsap

Grays Harbor
Mason
Thurston
Pacific

Lincoln

King
Kittitas

Pierce

Wahkiakum

Grant
Adams
Franklin

Lewis
Yakima
Cowlitz

Skamania

Benton

Whitman
Garfield
Columbia

Walla Walla

Klickitat

Clark

Spokane

Asotin

More than 20 person months lower than state
10 to 20 person months lower than state
1 to 10 person months lower than state
1 to 10 person months greater than state
10 to 20 person months greater than state
More than 20 person months greater than state

Figure 3
Jail Months Per 1,000 Persons 18 to 39 vs Prison Months Per 1,000 Persons 18 to 39

Prison Months Per 1,000 Persons 18 to 39

1,000

Columbia

800

600
Lewis
Wahkiakum

400

Mason

Cowlitz

Grays Harbor
Thurston

200

Figure 2 is similar to Figure 1 except
that the data represent the jail months
sentenced per 1,000 persons 18 to 39
years old for each county. Similar
patterns of sentencing are evident.
Southwest Washington has higher rates
of jail months sentenced as occurred
with the prison data. Many rural
eastern Washington counties also have
jail month sentence rates higher than
the state. The counties with the highest
prison usage also tend to have higher
levels of jail usage (See Figure 3).
The prison months sentenced per 1,000
persons 18 to 39 can be decomposed
into two parts to determine whether the
pattern illustrated in Figure 1 is the
result of different rates of sentencing or
differing lengths of sentences. If we
calculate the percent that each county’s
rate of sentencing differs from the mean
rate of sentencing for all counties and
also calculate the percent that each
county’s average sentence length
differs from the overall sentence length,
then we can calculate the standard
deviation 1 of the percent difference for
each component for a direct
comparison.

Klickitat

For this study, prison months sentenced
per 1,000 persons 18 to 39 (Mi) in a
0
county,
i, is the product of the average
0
10
20
30
40
50
60
70
Jail Months Per 1,000 Persons 18 to 39
sentence length for the county (Xi) and
the number of sentences per 1,000
persons 18 to 39 in the county (Yi): Mi
= Xi*Yi. Each county’s average
sentence length differs from the statewide mean average sentence by a percentage (pxi), and its number of
sentences per 1,000 persons 18 to 39 differs from the statewide mean rate by a percentage (pyi). The prison
months sentenced per 1,000 persons for a county can therefore be written as Mi = μx(1+pxi)*μy(1+pyi). The
percentage differences from the mean statewide values are isolated and their standard deviations calculated.
Using this methodology, the standard deviation for the average length of sentence is .21391 and for the rate
of sentencing is .61109. The rate of sentencing, therefore, explains more of the difference in the prison
months sentenced per 1,000.
Whitman County

1

Standard deviation is a statistical measure of the dispersion of data values.

RESEARCH BRIEF NO. 38

OFM FORECASTING DIVISION

Conclusions
In Washington State, counties with the highest rates of prison usage also tend to have the highest rates of
jail usage. Counties in southwestern Washington are particularly high on both measures. In an effort to
better understand the pattern of usage, we examined the components used in calculating prison usage by
county, the number of sentences per 1,000 persons 18 to 39 years of age and the average sentence length.
Based on the analyses, we found that the pattern results from differing rates of sentencing rather than the
length of sentences. Additional analyses are needed to determine whether sentencing for certain types of
crime are responsible for the variation in rates across counties.


